Changes in chromosomal polymorphism and global warming:
The case of
Drosophila subobscura
from Apatin (Serbia)
Goran Zivanovic
1and Francesc Mestres
2 1Department of Genetics, Institute for Biological Research “Sinisa Stankovic”, University of Belgrade,
Belgrade, Serbia.
2
Departament de Genètica, Universitat de Barcelona, Barcelona, Spain.
Abstract
In this study, chromosomal inversion polymorphism data for a natural population ofDrosophila subobscura from a swampy region near the town of Apatin (Serbia) were compared with data for the same population collected approxi-mately 15 years earlier. The pattern of chromosomal inversion polymorphism changed over time. There were signifi-cant increases in the frequency of characteristic southern latitude (“warm” adapted) chromosomal arrangements and significant decreases in the frequency of characteristic northern latitude (“cold” adapted) chromosomal arrange-ments in the O and U chromosomes. The chromosomal arrangearrange-ments O3+4and O3+4+22(derived from the O3+4 arrange-ment) showed significant increases in 2008 and 2009 with regard to the 1994 sample. There was also a significant increase (~50%) in the U1+2arrangement, while U1+8+2(a typical southern arrangement) was detected for the first time. Since the Apatin swampy population ofD. subobscura has existed for a long time in a stable habitat with high humid-ity that has not been changed by man our results indicate that natural selection has produced chromosomal changes in response to the increase in temperature that has occurred in the Balkan Peninsula of central southeastern Euro-pean.
Key words:chromosomal inversions,Drosophila subobscura, global warming, karyotypes.
Received: November 16, 2010; Accepted: March 28, 2011.
Introduction
The climate change of recent decades has led to heri-table genetic changes in animal species as diverse as birds, squirrels and mosquitoes (Bradshaw and Holzapfel, 2006). Long-term changes in chromosomal inversion polymor-phisms inDrosophilaspecies suggest that the genetic con-stitution of populations is responding to climate change (Van Heerwaarden and Hoffmann, 2007). This suggestion is strongly supported by the fact that genes located within inversions are associated with a variety of traits including those involved in climate adaptation (Hoffmann and Riese-berg, 2008). This characteristic was observed in some spe-cies ofDrosophila, such asD. melanogaster in Australia (Andersonet al., 2005; Uminaet al., 2005),D. robustain North America (Levitan and Etges, 2005) and D. subobscurain Europe (Rodríguez-Trelles and Rodríguez, 1998; Soléet al., 2002; Balanyàet al., 2004, 2006, 2009) and America (Balanyàet al., 2006, 2009).
In allD. subobscurapopulations from southwestern and central Europe studied to date an increase in the
fre-quency of “warm”-adapted chromosomal arrangements ty-pical of southern latitudes, and a decrease in the frequency of “cold”-adapted chromosomal inversions typical of nor-thern latitudes, has been observed (Rodríguez-Trelles and Rodríguez, 1998; Soléet al., 2002; Balanyàet al., 2004, 2006, 2009). This species is an excellent model organism for such studies because of its extensive polymorphism for chromosomal inversions: 67 inversions distributed in 93 chromosomal arrangements have been identified, with the frequencies of most of these varying clinally with latitude (Krimbas and Loukas, 1980; Prevostiet al., 1988; Menozzi and Krimbas, 1992; Krimbas, 1993).
Of the five acrocentric chromosomes in D. subobscura, the O chromosome (homologous to the 3R chromosomal arm ofD. melanogasterand second chromo-some ofD. pseudoobscura) is the longest and most poly-morphic, with about 40 natural chromosomal arrangements (Krimbas, 1993). Since the 1960s more than 150 natural populations have been studied throughout the Palearctic distribution of this species. However, few long-term analy-ses of changes in inversion polymorphism have been done in southeastern Europe or the Balkan Peninsula. For this reason, the main aim of this work was to study a population ofD. subobscurafrom Apatin (Serbia). This population is
Send correspondence to Goran Zivanovic. Department of Genet-ics, Institute for Biological Research “Sinisa Stankovic”, University of Belgrade, Bulevar Despota Stefana 142, 11000 Belgrade, Ser-bia. E-mail: [email protected].
located in a swampy region on the left bank of the Danube river in the lowlands of the Pannonian plain. This area, which is midway along the Danube river about 1366-1433 km from the mouth of this river in the Black sea, is de-liberately left to be flooded permanently or during spring across an area of at least 3500 ha. Consequently, the Apatin
D.subobscurapopulation has existed in a very humid habi-tat that has never been changed by man. This is probably the main reason for the large differences observed between the Apatin and otherD. subobscurapopulations from the Balkan Peninsula (Zivanovicet al., 2002; Zivanovic and Marinkovic, 2003; Zivanovic, 2007; Zivanovic and Mes-tres, 2010a,b).
Specifically, we analyzed inversion polymorphisms inD. subobscurafrom Apatin 14 and 15 years after the ini-tial studies, and used this information to assess variation in composition. Our intention was to compare samples from June 2008 and 2009 with the sample from June 1994 at ex-actly the same site, paying special attention to calendar and climatology data. The results may be especially interesting because during this period there were several heat waves, for example the first evidence of climate change in the re-gion was recorded in summer 2003 (Schar and Jendritzky, 2004). The study should tell us whether long-term chromo-somal inversion polymorphism changes, if they exist, are characteristic of all or only of specific chromosomes and their arrangements. Finally, the analysis of possible chan-ges in frequency of some chromosomes in the O3+4group
(O3+4+1, O3+4+22and so on) correlated to climate changes is
of particular interest, because some genes involved in ther-mal adaptation are located in the O3+4region (Quintana and
Prevosti, 1991; Moltóet al., 1992; Laayouniet al., 2007).
Material and Methods
Drosophila subobscura flies were collected from a poplar (Populus alba) wood in a swampy region located on the left bank of the river Danube, near the town of Apatin (45°40’ N, 19°00’ E, approximately 200 km NW of Bel-grade). This region is included in the Ramsar List, which lists wetlands of international importance, and is known as the Upper Danube wetland area. Meteorological data for the site were obtained from the Serbian Republic Hydro-meteorological Service. Samples were collected twice from exactly the same place in June 2008 and June 2009. To al-low comparison with the June 1994 sample, the 2008 and 2009 samples were collected 2.5 days earlier per decade be-cause spring/summer has advanced an average of 2.5 days per decade in Europe (Menzelet al., 2006). Unfortunately, the need to trap on precise days and Danube river flooding limited the sample size obtained. Only wild males (June 2008, June 2009) and the sons of wild females (June 2009) were used to assess chromosomal inversion polymorphism. The males were crossed individually with virgin females of the Kussnacht strain that were homokaryotypic for stan-dard chromosomal arrangements in all five chromosomes.
Polytene chromosomes were stained and squashed in aceto-orcein solution. At least eight larvae from the prog-eny of each cross were examined. The chromosomal map of Kunze-Mühl and Müller (1958) was used for cytological analysis of the chromosomal arrangements and the nomen-clature for these arrangements followed that of Kunze-Mühl and Sperlich (1955). Departure of the observed fre-quencies of chromosomal arrangements and chromosomal karyotypes from expectations was tested usingc2test con-tingency tables. The degree of chromosomal inversion polymorphism in the population analyzed was assessed us-ing the index of free recombination (IFR) (Carson, 1955). Chromosomal inversion polymorphism patterns were ob-tained by computing Nei’s genetic distances (Nei, 1972) between Apatin 2008+2009 and Apatin 1994 and another five previously analyzed Balkan populations (Kamariste, June 1996; Djerdap, June 2001; Petnica, June 1995; Jastrebac, June 1993; Zanjic, June 1997) (Zivanovicet al., 2002; Zivanovic and Marinkovic, 2003; Zivanovic, 2007).
Results
The frequencies of chromosomal arrangements in the Apatin population from June 2008 and June 2009, together with those previously obtained for this population in June 1994 (Zivanovicet al., 2002), are shown in Table 1. A total of 18 chromosomal arrangements were found in the old and new samples. Some of the chromosomal arrangements found earlier (U1, E1+2, O6, O3+4+2, in 1994) were not
ob-served in 2008 and 2009, whereas some chromosomal ar-rangements, such as U1+8+2, E1+2+9+12, O22and O3+4+22that
were not found 15 years earlier were observed in the 2009 samples (Table 1). There were significant differences in the frequencies of the U chromosomal arrangements between the June 1994 and June 2009 samples (c2= 21.2,d.f.= 4, p < 0.001). Similarly, the 1994 and 2008+2009 samples also differed significantly in the frequencies of five U chro-mosomal arrangements (c2= 17.4,d.f.= 4, p < 0.01). There was a significant decrease in the frequency of the Ust
ar-rangement in the two comparisons (c2 = 9.5, d.f. = 1, p < 0.01 andc2= 6.9,d.f.= 1, p < 0.01, for the first and sec-ond comparison, respectively). Over the same period of time, U1+2 showed a significant increase in frequency
(c2= 8.0,d.f.= 1, p < 0.01, for the first case andc2= 8.1,
d.f.= 1, p < 0.01, for second). The U1+8+2arrangement was
detected for the first time in the 2008 and 2009 samples.
There were also significant differences among seven O-chromosomal arrangement frequencies between the 1994 and 2009 samples (first case) (c2 = 25.1, d.f. = 6, p < 0.001). This significant difference was also observed in the second case (comparing the 1994 and 2008+2009 sam-ples:c2= 23.8,d.f.= 6, p < 0.001). The Ostarrangement
showed a significant decrease in frequency (c2 = 4.2,
and second case, respectively), while the O3+4+22
arrange-ment was observed for the first time in the 2009 sample. The O3+4 arrangement increased in frequency, but there
were no significant differences (c2= 1.3,d.f.= 1, p > 0.05 andc2= 3.3,d.f.= 1, p > 0.05, for the first and second case, respectively). However, O3+4and the other O3+4+x
chromo-somal arrangements derived from O3+4(O3+4+1, O3+4+2and
O3+4+22) showed significant increases in frequency
(c2= 5.5,d.f.= 1, p < 0.05 andc2= 7.1,d.f.= 1, p < 0.01 for the two cases, respectively). Finally, there was no signifi-cant difference in frequency for any chromosomal arrange-ment between the 2008 and 2009 samples.
The frequencies of the chromosomal karyotypes ob-tained for the Apatin population are shown in Table 2. The 1994 and 2008+2009 samples had 28 and 23 chromosomal karyotypes, respectively. Sixteen chromosomal karyotypes were found in both the old and new samples. Twelve chro-mosomal karyotypes previously observed were not found
in the new samples, while seven chromosomal karyotypes present in the new samples were not detected in 1994. There were significant differences in the frequency of the U karyotypes (c2= 19.6,d.f.= 8, p < 0.05) between the 1994 and 2008+2009 samples. The Ust/Ustkaryotype showed a
dramatic decrease (not seen in the 2008 and 2009 samples), whereas Ust/U1+8+2appeared for the first time in the 2009
sample. There were also significant differences in the fre-quencies of all 14 O-chromosome karyotypes for the two samples analyzed (1994 versus 2008+2009) (c2 = 29.2,
d.f.= 13, p < 0.01). Ost/Ostshowed a significant decrease in
frequency (c2 = 7.3, d.f. = 1, p < 0.01), while Ost/O3+4
showed a significant increase (c2= 7.8,d.f.= 1, p < 0.01) and O3+4/O3+4+22was detected for the first time in the 2009
sample. A similar result was found for all nine E chromo-some karyotypes (c2 = 16.8, d.f. = 8, p < 0.05). Est/Est
showed a significant decrease in frequency (c2 = 4.5, Table 1- Frequencies of chromosomal arrangements for the Apatin natural population ofDrosophila subobscura.
Chromosomal arrangement
June 1994 June 2008 June 2009 June 2008+2009
n p (%) n p (%) n p (%) n p (%)
Ast 25 50.0 3 60.0 7 46.7 10 50.0
A1 21 42.0 2 40.0 7 46.7 9 45.0
A2 4 8.0 / / 1 6.6 1 5.0
Total 50 5 15 20
Jst 39 39.0 4 40.0 11 36.7 15 37.5
J1 61 61.0 6 60.0 19 63.3 25 62.5
Total 100 10 30 40
Ust 52 52.0 5 50.0 6 20.0 11 27.5
U1 1 1.0 / / / / / /
U1+2 23 23.0 4 40.0 15 50.0 19 47.5
U1+2+6 24 24.0 1 10.0 6 20.0 7 17.5
U1+8+2 / / / / 3 10.0 3 7.5
Total 100 10 30 40
Est 70 70.0 7 70.0 18 60.0 25 62.5
E1+2 2 2.0 / / / / / /
E1+2+9 11 11.0 / / 6 20.0 6 15.0
E1+2+9+12 / / / / 2 6.6 2 5.0
E8 17 17.0 3 30.0 4 13.4 7 17.5
Total 100 10 30 40
Ost 61 61.0 4 40.0 12 40.0 16 40.0
O6 6 6.0 / / / / / /
O22 / / / / 1 3.3 1 2.5
O3+4 23 23.0 6 60.0 10 33.3 16 40.0
O3+4+1 8 8.0 / / 2 6.6 2 5.0
O3+4+2 2 2.0 / / / / / /
O3+4+22 / / / / 5 16.7 5 12.5
d.f.= 1, p < .05), while for Est/E8there was a significant
in-crease (c2= 5.1,d.f.= 1, p < 0.05) and Est/E1+2+9+12was
ob-served for the first time in the 2009 sample.
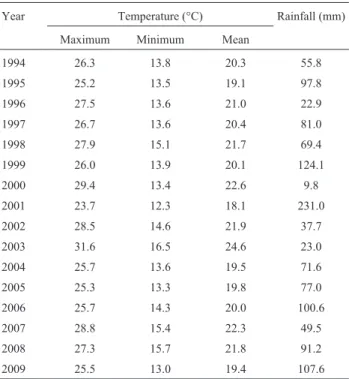
The variations in chromosomal polymorphisms were compared with the meteorological data shown in Table 3.
The combined average for the maximum, minimum and mean temperatures (26.4 °C, 14.4 °C and 20.6 °C, respec-tively) for 2008 and 2009 were higher than in 1994. A year-by-year analysis from 1994 onwards revealed several heat waves such as the well documented heatwave of 2003
Table 2- Frequencies of chromosomal karyotypes for the Apatin natural population ofDrosophila subobscura.
Chromosomal karyotype
June 1994 June 2008 June 2009 June 2008+2009
n p (%) n p (%) n p (%) n p (%)
Jst/Jst 9 18.0 1 20.0 1 6.7 2 10.0
Jst/J1 21 42.0 2 40.0 9 60.0 11 55.0
J1/J1 20 40.0 2 40.0 5 33.3 7 35.0
Total 50 5 15 20
Ust/Ust 17 34.0 / / / / / /
Ust/U1+2 10 20.0 4 80.0 3 20.0 7 35.0
Ust/U1+2+6 8 16.0 1 20.0 1 6.7 2 10.0
Ust/U1+8+2 / / / / 2 13.3 2 10.0
U1/U1+2 1 2.0 / / / / / /
U1+2/U1+2 3 6.0 / / 4 26.7 4 20.0
U1+2/U1+2+6 6 12.0 / / 3 20.0 3 15.0
U1+2/U1+8+2 / / / / 1 6.7 1 5.0
U1+2+6/U1+2+6 5 10.0 / / 1 6.7 1 5.0
Total 50 5 15 20
Est/Est 29 58.0 3 60.0 3 20.0 6 30.0
Est/E1+2 1 2.0 / / / / / /
Est/E1+2+9 8 16.0 / / 6 40.0 6 30.0
Est/E1+2+9+12 / / / / 2 13.3 2 10.0
Est/E8 3 6.0 1 20.0 4 26.7 5 25.0
E1+2+9/E1+2+9 2 4.0 / / / / / /
E8/E8 1 2.0 1 20.0 / / 1 5.0
E8/E1+2 1 2.0 / / / / / /
E8/E1+2+9 5 10.0 / / / / / /
Total 50 5 15 20
Ost/Ost 22 44.0 / / 2 13.3 2 10.0
Ost/O6 4 8.0 / / / / / /
Ost/O22 / / / / 1 6.7 1 5.0
Ost/O3+4 7 14.0 4 80.0 5 33.3 9 45.0
Ost/O3+4+1 4 8.0 / / 1 6.7 1 5.0
Ost/O3+4+2 2 4.0 / / / / / /
Ost/O3+4+22 / / / / 1 6.7 1 5.0
O6/O3+4 1 2.0 / / / / / /
O6/O3+4+1 1 2.0 / / / / / /
O3+4/O3+4 7 14.0 1 20.0 1 6.7 2 10.0
O3+4/O3+4+1 1 2.0 / / / / / /
O3+4/O3+4+22 / / / / 3 20.0 3 15.0
O3+4+1/O3+4+1 1 2.0 / / / / / /
O3+4+1/O3+4+22 / / / / 1 6.7 1 5.0
(Schar and Jendritzky, 2004) and less drastic ones in 2000, 2002 and 2007. These data suggest a gradual increase in temperature at the locality studied. However, desiccation does not seem to affect the Apatin habitat: although the rainfall pattern is irregular, a general decrease has not been observed. Indeed, data from 2006 onwards suggest that there has been a tendency for rainfall to increase, in agree-ment with global warming predictions (Houghton, 2005; Wentzet al., 2007).
The IFR values obtained for the Apatin population were: 75.60±1.88 (June 2008) and 77.13 ±2.11 (2009), with a mean of 76.75 ± 1.63. These values were only slightly lower than that for 1994 (84.62±1.55). Table 4 shows Nei’s genetic distances between the Apatin and other Balkan populations. This table also provides older ge-netic distances between Apatin (1994) and these Balkan populations (Zivanovicet al., 2002; Zivanovic, 2007). The
new genetic distances were lower than those obtained pre-viously.
Discussion
The world’s climate is changing rapidly, with a global temperature increase of 0.6 °C in the past three decades, and 0.8 °C in the past century (Hansenet al., 2006; Van Heerwaarden and Hoffmann, 2007). Many animals and plants adapt rapidly to variations in environmental condi-tions (Endler, 1986). In particular, widespread generalist species such asD. melanogasterandD. subobscura, which have short generation times and rapidly form phenotypic and genotypic clines, are excellent sensitive indicators of such global warming (Van Heerwaarden and Hoffmann, 2007; Balanyàet al., 2009). The results of long-term stud-ies indicate that there have been changes in the frequency of chromosomal arrangements inD. subobscura. In recent de-cades, a significant decrease in the frequency of standard chromosomes (“cold” adapted and abundant in northern latitudes) and an increase in some non-standard chromo-somal arrangements (“warm” adapted and characteristic of southern latitudes) have been described in natural D. subobscurapopulations from southwestern and central Eu-rope (de Frutos and Prevosti, 1984; Gosteli, 1990; Orengo and Prevosti, 1996; Rodriguez-Trelleset al., 1996; Soléet al., 2002; Balanyàet al., 2004, 2006, 2009) and in Ameri-can colonizing populations (Balanyà et al., 2006, 2009). These changes have been attributed to the adaptation of chromosomal inversion polymorphism to a warmer climate in Europe and America.
The effect of global warming in the Apatin popula-tion is reflected as variapopula-tion in chromosomal polymor-phism. Specifically, there was a significant increase in the frequency of some chromosomal arrangements characteris-tic of southern latitudes (“warm” adapted) and a significant decrease in the frequency of some standard inversions (“cold” adapted) in the O and U chromosomes. Thus, O3+4
showed a significant increase when considered together with O3+4+xarrangements (~40% on average) in 2008 and
2009 compared to 1994. Similar results have been reported for other southwestern European populations (Orengo and Prevosti, 1996; Rodríguez-Trelles and Rodríguez, 1998). Interestingly, associations between heat-tolerance and the O3+4 arrangement have been described previously for D.
Table 3- Meteorological data for the Apatin region for the month of June
from 1994 to 2009.
Year Temperature (°C) Rainfall (mm)
Maximum Minimum Mean
1994 26.3 13.8 20.3 55.8
1995 25.2 13.5 19.1 97.8
1996 27.5 13.6 21.0 22.9
1997 26.7 13.6 20.4 81.0
1998 27.9 15.1 21.7 69.4
1999 26.0 13.9 20.1 124.1
2000 29.4 13.4 22.6 9.8
2001 23.7 12.3 18.1 231.0
2002 28.5 14.6 21.9 37.7
2003 31.6 16.5 24.6 23.0
2004 25.7 13.6 19.5 71.6
2005 25.3 13.3 19.8 77.0
2006 25.7 14.3 20.0 100.6
2007 28.8 15.4 22.3 49.5
2008 27.3 15.7 21.8 91.2
2009 25.5 13.0 19.4 107.6
Max. T, Min. T and Mean T stand for maximum, minimum and mean tem-peratures, respectively.
Table 4- Nei’s genetic distances calculated between theD. subobscurapopulation from Apatin (2008+2009), the same population in 1994, and another
five Balkan populations.
Apatin Kamariste Djerdap Petnica Jastrebac Zanjic
45°40’ N 45°29’ N 44°37’ N 44°16’ N 43°26’ N 42°24’ N
June 1994 June 1996 June 2001 June 1995 June 1993 June 1997
Apatin June 08+09 0.058 0.145 0.053 0.119 0.092 0.094
subobscura (Quintana and Prevosti, 1991). Furthermore, several genes that code for heat stress proteins (Moltóet al., 1992) and others involved in thermal adaptation (Laayouni
et al., 2007) are located in this arrangement. In addition, the O3+4 and O3+4+xfrequencies in the old Apatin population
(June 1994) were 53% and 59% lower, respectively, that in all other southern Balkan populations (Jastrebac, June 1993; Petnica, June 1995; Kamariste, June 1996; Zanjic, June 1997; Djerdap, June 2001; Avala, June 2004) (Zi-vanovic et al., 2002; Zivanovic and Marinkovic, 2003; Zivanovic, 2007; Zivanovic and Mestres, 2010a,b). In con-trast, the frequencies of the O3+4and O3+4+xarrangements in
the new Apatin population (2008 + 2009 sample) were no much lower (by 19% and 28%, respectively) than those pre-viously reported for the southern Balkan populations. Data for the O-chromosome suggest that the Apatin population is evolving towards a more “southern” population. Simi-larly, for the U chromosome, a significant increase in the U1+2frequency (~50%) during the period studied, as well as
the presence of the U1+8+2arrangement which was not
pre-viously observed, indicate evolution towards a “southern” population.
Our results agree with those from southwestern and central European populations (Rodríguez-Trelles and Ro-dríguez, 1998; Soléet al., 2002; Balanyàet al., 2004, 2006, 2009). The relatively low IFR values obtained in this study (not previously observed in 1994) are characteristic of eco-logically central European populations ofD. subobscura
(Krimbas, 1993). This result, and the smaller genetic dis-tances between the new Apatin population (2008+2009) and all other Balkan populations (Table 4) compared to the distances previously found, provide further evidence that the Apatin population is becoming more “southern”. A sim-ilar decrease in genetic distances over time has been ob-served in Mediterranean, Atlantic and Central European populations ofD. subobscura(Balanyàet al., 2004).
The absence of frequency changes for chromosomal polymorphism in the remaining chromosomes (A, J and E) suggests that our results were most probably not a conse-quence of gene flow from the south, where the frequencies of all the arrangements in these three chromosomes are completely different in all southernD.subobscura popula-tions analyzed (Zivanovicet al., 2002; Zivanovic and Ma-rinkovic, 2003; Zivanovic, 2007; Zivanovic and Mestres, 2010a,b). Together, these observations suggest that we have detected the effect of selection on chromosomal poly-morphism composition (see also the discussion of this topic in Hoffman and Rieseberg, 2008). Some form of natural se-lection appears to be acting as a reaction to the increase in temperature associated with many heat waves that have markedly affected the Balkan Peninsula; random processes and genetic drift do not appear to be involved. The latter conclusion is supported by the high migration rate among
D. subobscurapopulations from the Balkan Peninsula
(Zi-vanovic et al., 2007) since migration among populations efficiently purges most effects of genetic drift.
Acknowledgments
This study was supported by grants from the Ministry of Science and Technological Development of the Repub-lic of Serbia (no. 173025), Ministerio de Ciencia e Inno-vación (Spain) (no. BFU2009-07564) and “Generalitat de Catalunya” (Spain) (no. 2009 SGR 636). We thank Prof. C. Arenas (Dept. Estadística, Universitat de Barcelona) for her statistical advice and Mr. C. Evans (Servei d’Assessora-ment Lingüístic, Universitat de Barcelona) for correcting the English.
References
Anderson AR, Hoffmann AA, McKechnie SW, Umina PA and Weeks AR (2005) The latitudinal cline in theIn(3R) Payne
inversion polymorphism has shifted in the last 20 years in AustralianDrosophila melanogasterpopulations. Mol Ecol 14:851-858.
Balanyà J, Solé E, Oller JM, Sperlich D and Serra L (2004) Long-term changes in the chromosomal inversion polymor-phism ofDrosophila subobscura. II. European populations. J Zool Syst Evol Res 42:191-201.
Balanyà J, Oller JM, Huey RB, Gilchrist GW and Serra L (2006) Global genetic change tracks global climate warming in
Drosophila subobscura. Science 313:1773-1775.
Balanyà J, Huey RB, Gilchrist GW and Serra L (2009) The chro-mosomal polymorphism ofDrosophila subobscura: A mi-cro evolutionary weapon to monitor global change. Heredity 103:364-367.
Bradshaw WE and Holzapfel CM (2006) Evolutionary response to rapid climate change. Science 312:1477-1478.
Carson HL (1955) The genetic characteristics of marginal popula-tions ofDrosophila. Cold Spring Harbor Symp Quant Biol 20:276-287.
de Frutos R and Prevosti A (1984) Temporal changes of chromo-somal polymorphism in natural populations ofDrosophila subobscura. Genetica 63:181-187.
Endler JA (1986) Natural Selection in the Wild. Princeton Univer-sity Press, Princeton, 336 pp.
Gosteli M (1990) Chromosomal polymorphism in natural popula-tions ofDrosophila subobscuranear Zurich, Switzerland: A contribution to long-term comparisons. Genetica 81:199-204.
Hansen J, Sato M, Ruedy R, Lo K, Lea DW and Medina-Elizade M (2006) Global temperature change. Proc Natl Acad Sci USA 103:14288-14293.
Hoffmann AA and Rieseberg LH (2008) Revisiting the impact of inversions in evolution: From population genetic markers to drivers of adaptive shifts and speciation? Annu Rev Ecol Evol Syst 39:21-42.
Houghton J (2005) Global warming. Rep Prog Phys 68:1343-1403.
Krimbas CB (1993)Drosophila subobscura: Biology, Genetics and Inversion Polymorphism. Verlag Dr Kovac, Hamburg, 395 pp.
Kunze-Mühl E and Müller E (1958) Weitere Untersuchungen über die chromosomale Struktur und die natürlichen Strukturtypen von Drosophila subobscura. Chromosoma 9:559-570.
Kunze-Mühl E and Sperlich D (1955) Inversionen und chro-mosomale Strukturtypen bei Drosophila subobscura. Z Indukt Abstamm Vererb Lehre 87:65-84.
Laayouni H, García-Franco F, Chávez-Sandoval BE, Trotta V, Beltran S, Corominas M and Santos M (2007) Thermal evo-lution of gene expression profiles in Drosophila subobscura. BMC Evol Biol 7:e42.
Levitan M and Etges WJ (2005) Climate change and recent ge-netic flux in populations ofDrosophila robusta. BMC Evol Biol 5:e4.
Menozzi P and Krimbas CB (1992) The inversion polymorphism ofD. subobscurarevisited: Synthetic maps of gene arrange-ment frequencies and their interpretation. J Evol Biol 5:625-641.
Menzel A, Sparks TH, Estrella N, Koch E, Aasa A, Ahas R, Alm-Kubler K, Bissolli P, Braslavska O, Briede A, et al.
(2006) European phenological response to climate change matches the warming pattern. Global Change Biol 12:1969-1976.
Moltó MD, Pascual L, Martinez-Sebastian MJ and de Frutos R (1992) Genetic analysis of heat shock response in the three
Drosophilaspecies of the obscura group. Genome 35:870-880.
Nei M (1972) Genetic distance between populations. Am Nat 106:283-292.
Orengo DJ and Prevosti A (1996) Temporal changes in chromo-somal polymorphism ofDrosophila subobscura related to climatic changes. Evolution 50:1346-1350.
Prevosti A, Ribo G, Serra L, Aguade M, Balaña J, Monclus M and Mestres F (1988) Colonization of America byDrosophila subobscura: Experiment in natural populations that supports the adaptive role of chromosomal-inversion polymorphism. Proc Natl Acad Sci USA 85:5597-5600.
Quintana A and Prevosti A (1991) Genetic and environmental fac-tors in the resistance of Drosophila subobscuraadults to high temperature shock. III. Chromosomal-inversion and enzymatic polymorphism variation in lines selected for heat shock resistance. Genetica 84:165-170.
Rodríguez-Trelles F and Rodríguez MA (1998) Rapid micro-evolution and loss of chromosomal diversity inDrosophila
in response to climate warming. Evol Ecol 12:829-838.
Rodríguez-Trelles F, Alvarez G and Zapata C (1996) Time-series analysis of seasonal changes of the O inversion polymor-phism ofDrosophila subobscura. Genetics 142:179-187. Schar C and Jendritzky G (2004) Hot news from summer 2003.
Nature 432:559-560.
Solé E, Balanyà J, Sperlich D and Serra L (2002) Long-term changes in the chromosomal inversion polymorphism of
Drosophila subobscura. I. Mediterranean populations from southwestern Europe. Evolution 56:830-835.
Umina PA, Weeks AR, Kearney MR, McKechnie SW and Hof-fmann AA (2005) A rapid shift in a classic clinal pattern in
Drosophilareflecting climate change. Science 308:691-693. Van Heerwaarden B and Hoffmann AA (2007) Global warming: Fly populations are responding rapidly to climate change. Curr Biol 17:R16-R18.
Wentz FJ, Ricciardulli L, Hilburn K and Mears C (2007) How much more rain will global warming bring? Science 317:233-235.
Zivanovic G (2007) Seasonal changes in chromosomal inversion polymorphism in aDrosophila subobscuranatural popula-tion from a south-eastern European continental refugium of the last glaciation period. Russ J Genet 43:1344-1349. Zivanovic G and Marinkovic D (2003) Viabilities of originally
natural O-chromosomal inversion homo and heterokaryo-types inDrosophila subobscura. Hereditas 139:128-142. Zivanovic G and Mestres F (2010a) Viabilities ofDrosophila
subobscura homo- and heterokaryotypes at optimal and stress temperatures. I. Analysis over several years. Hereditas 147:70-81.
Zivanovic G and Mestres F (2010b) Viabilities ofD. subobscura
homo- and heterokaryotypes at optimal and stress tempera-tures. II. Seasonal component analysis. Hereditas 147:82-89.
Zivanovic G, Andjelkovic M and Marinkovic D (2002) Chromo-somal inversion polymorphism of Drosophila subobscura
from south-eastern part of Europe. J Zool Syst Evol Res 40:201-204.
Zivanovic G, Arenas C and Mestres F (2007) The genetic struc-ture of Balkan populations ofDrosophila subobscura. Here-ditas 144:120-128.
Associate Editor: Fábio de Melo Sene