INTRODUCTION
Patterns and processes of genetic divergence among local populations have recently been investigated using spatial correlograms to describe autocorrelation of gene frequencies for increasing classes of spatial distance (Sokal and Jacquez, 1991). Simulations have shown that this tech-nique is a powerful tool for studying the microevolution-ary processes of genetic divergence (Sokal and Wartenberg, 1981; Sokal et al., 1989, 1997; Epperson, 1995a,b).
One of the random processes most widely used to describe the present genetic divergence among local popu-lations is isolation-by-distance (Wright, 1943) and its dis-continuous version, the stepping-stone model (Kimura and Weiss, 1964). The basic isolation-by-distance model is usually modeled in a unidimensional distribution space through the Morton-Malecot equation
φ (d) = ac -bd
where φ (d) is the “kinship” between populations located at a geographic distance d, and a and b are constants that can be interpreted as a function of the demographic and ge-netic characteristics of the populations (Wijsman and Cavalli-Sforza, 1984). In both models, a negative exponen-tial relationship between genetic similarity and spaexponen-tial dis-tance is generated by drift in local populations and is con-strained by migration effects at short distances. This
rela-tionship also holds for coalescence models, in which the main determinant of divergence is genetic drift within lo-cal populations, that accumulates variance through time and not through spatially structured gene flow (Nielsen et al., 1998; Avise, 2000).
Sokal and Wartenberg (1983) showed that isolation-by-distance correlograms have similar profiles, with an exponential decrease between autocorrelation and geo-graphic distances, despite the low correlation among sur-faces. Testing the similarity of correlograms and compari-son of the results with correlations among gene frequen-cies are then analogous to the Lewontin-Krakauer test of neutrality based on the homogeneity of the FST statistics
(Kimura, 1983; Barbujani, 1987). Sokal and Wartenberg (1983) and Sokal (1986) proposed that the same stochas-tic spatial process could generate correlograms with Man-hattan distances of less than 0.1 or 0.2 (produced using uncorrelated gene frequencies). However, a critical aspect of this proposal is that if the sample size (number of lo-cal populations) used to construct the correlograms is small, their profiles can vary considerably, even if they were generated by the same stochastic process of popu-lation divergence.
In this paper, we used an Ornstein-Uhlenbenck (O-U) stochastic process to simulate exponential relationships between genetic divergence and geographic distance, in a manner analogous to isolation-by-distance, stepping-stone or coalescence models. For a specified sample size and METHODOLOGY
Null expectation of spatial correlograms under a stochastic process of
genetic divergence with small sample sizes
Mariana Pires de Campos Telles1,3 and José Alexandre Felizola Diniz-Filho2
Abstract
An Ornstein-Uhlenbeck process was used to simulate the exponential relationship between genetic divergence and geographic distances, as predicted by stochastic processes of population differentiation, such as isolation-by-distance, stepping-stone or coalescence models. These simulations were based only on the spatial coordinates of the local populations that defined a spatial unweighted pair-group method using arithmetic averages (UPGMA) link among them. The simulated gene frequency surfaces were then analyzed using spatial autocorrelation procedures and Nei’s genetic distances, constructed with different numbers of variables (gene frequencies). Stochastic divergence in space produced strong spatial patterns at univariate and mutivariate levels. Using a relatively small number of local populations, the correlogram profiles varied considerably, with Manhattan distances greater than those defined by other simulation studies. This method allows one to establish a range of correlogram profiles under the same stochastic process of spatial divergence, thereby avoiding the use of unnecessary explanations of genetic divergence based on other microevolutionary processes.
1Programa de Pós-graduação em Agronomia, Escola de Agronomia, Universidade Federal de Goiás,
Caixa Postal 131, 74001-970 Goiânia, GO, Brasil. E-mail: [email protected]
2Departamento de Biologia Geral, ICB, Universidade Federal de Goiás, Caixa Postal 131, 74001-970 Goiânia, GO, Brasil. 3Departamento de Zootecnia, Universidade Católica de Goiás, Av. Universitária, 1440, Caixa Postal 86, 74605-010 Goiânia, GO, Brasil.
spatial distribution of local populations, this relatively simple and general method allows definition of the null expectation of variation for correlograms under a simple stochastic process of spatial divergence among local popu-lations.
MATERIAL AND METHODS
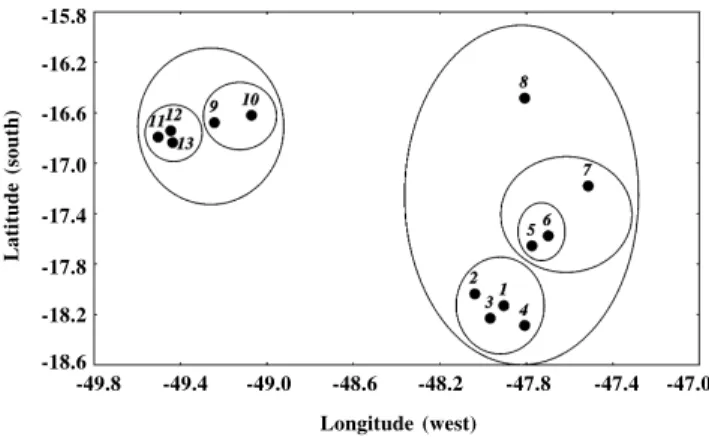
We simulated gene frequencies for 13 local popula-tions distributed geographically as shown in Figure 1. These localities were used in an isozyme study of Eugenia dysenterica DC (Myrtaceae) population genetics in a re-gion of the Brazilian “cerrado” (Telles, 2000), and served to illustrate the procedure developed here. Simulations were performed with the PDAP software (phenotypic di-versity analysis program - Díaz-Uriarte and Garland, 1996) based on an unweighted pair-group method using arithmetic averages (UPGMA) clustering of geographic distances (Sneath and Sokal, 1973), designed to represent the pairwise distances among local populations in a tree for-mat. The cophenetic correlation of clustering was very high (r = 0.96), which ensured that running simulations with PDAP across this tree simulated a spatial diffusion pro-cess. Thus, the branch lengths of UPGMA based on geo-graphic distances must be interpreted as a parameter re-lated to the expected amount of gene flow among local populations. On the other hand, if one wishes to simulate a spatially structured coalescence model (Avise, 2000), these branch lengths are a direct estimate of the divergence time between local populations.
An O-U stochastic process (Felsenstein, 1988; Mar-tins, 1995; Hansen and MarMar-tins, 1996) was then used to generate 500 distributions of gene frequencies p maintain-ing an exponential relationship between genetic divergence and geographic distances represented in UPGMA cluster-ing, as expected by the Malecót-Morton equation for iso-lation-by-distance and by other stochastic processes of
population differentiation. In the O-U process, the evolu-tionary changes were constrained by a constant force to-ward a central point (the adaptive peak of p), and the pairwise covariance among local populations (VB,
equiva-lent to φ (d)) was related to distance (d) by the exponential relationship
VB = σ
2/2α (1 - e-2αd) + ε
where σ2 is the variance of evolutionary change under a
sto-chastic process, and α is the restraining force. The vari-ance of evolutionary changes per unit of time (or space) in the simulations indicates the range of deviations of p from its “ancestral” value, and is a function of the variance of p (see below) and of the maximum distance between pairs of local populations (dmax). Following Díaz-Uriarte and
Gar-land (1996), the restraining force α was set to 2/dmax, in
order to produce a moderate exponential relationship be-tween VB and geographic distance. There is an equivalence
between the previously defined Malecót-Morton equation and the O-U process, with the constants a and b being ex-pressed in terms of σ2, α and e.
Since the O-U process “forgets” past events (in this case, long-range spatial patterns), it reduces the level of “spatial inertia” in the data. At each instant of divergence in time or space, the stochastic variation in p can be pushed to the adaptive peak if the value of gene frequencies be-comes too high or too low, which explains the exponential decrease of genetic divergence when distantly related popu-lations are compared (Felsenstein, 1988). The assumption of a constant population size through time, present in most models of population differentiation, is approximated in the O-U model used here by the constant variance in evo-lutionary changes throughout the process.
All simulations started with an initial gene frequency (the adaptive peak) of 0.5 ± 0.04, so that most values of gene frequencies would fall between zero and 1.0 (values of p assume a normal distribution). However, since PDAP was originally developed to generate variation in continu-ous traits, we also used the boundary option of the pro-gram to constrain the variation between zero and 1.0 (the “replace” algorithm; Díaz-Uriarte and Garland, 1996).
Each gene frequency vector simulated represented surfaces of variation in geographic space (sensu Sokal and Oden, 1978a,b), and was analyzed and interpreted using stan-dard procedures of spatial autocorrelation (Sokal and Oden, 1978a,b; Sokal and Jacquez, 1991). Moran’s I coefficients were estimated in four geographic distance classes in or-der to generate the spatial correlograms. A Pearson corre-lation coefficient was calculated between Moran’s I values and the upper limit of the distance class in order to evalu-ate the linearity of the decrease of each correlogram.
To provide microevolutionary inferences (Sokal and Jacquez, 1991), the correlograms were then compared us-ing pairwise Manhattan distances, which were also com-pared with pairwise Pearson correlations among original
Figure 1 - Schematic map of the spatial distribution of the 13 local popula-tions used in the simulapopula-tions. The circles indicate the main spatial hierar-chy defined by unweigthed pair-group method using arithmetic averages (UPGMA) clustering of geographic distances.
-15.8
-16.2
-16.6
-17.0
-17.4
-17.8
-18.2
-18.6
-49.8 -49.4 -49.0 -48.6 -48.2 -47.8 -47.4 -47.0
Longitude (west)
gene frequency surfaces. Based on previous studies (Sokal and Wartenberg, 1983; Sokal and Jacquez, 1991), similar correlograms were expected to appear, even if they origi-nated from uncorrelated gene frequency surfaces.
We also analyzed multivariate patterns of spatial autocorrelation under this O-U stochastic process by ran-domly sampling the gene frequencies to estimate Nei’s (1972) genetic distances among local populations. A total of 100 genetic distance matrices were constructed using 10, 20 and 30 gene frequencies. Each matrix was compared with the geographic distances by the Mantel test, which was used to establish the statistical significance of the matrix correlation using 1,000 permutations (Sokal et al., 1986; Manly, 1991).
RESULTS
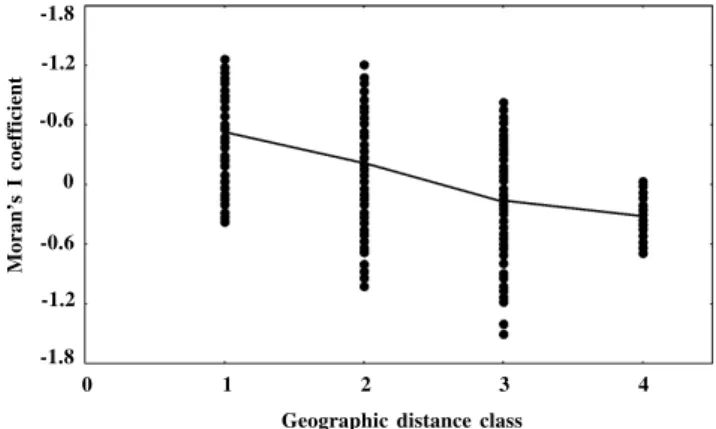
The correlograms obtained from the gene frequency surfaces (Figure 2) usually showed a monotonic decrease in Moran’s I coefficient with geographic distance, with very high negative correlations among them (Figure 3). The av-erage correlogram showed a continuous decrease in Moran’s I coefficients with distance, suggesting a clinal pattern in space (Sokal and Oden, 1978a,b). Other simula-tions (Sokal and Wartenberg, 1983; Sokal and Jacquez, 1991; Sokal et al., 1997) produced a more stabilizing pat-tern in Moran’s I coefficient in the last distance classes. However, in our study, the variance of the coefficients de-creased strongly in this class in such a way that the profiles were then compatible with those obtained in these previ-ous studies.
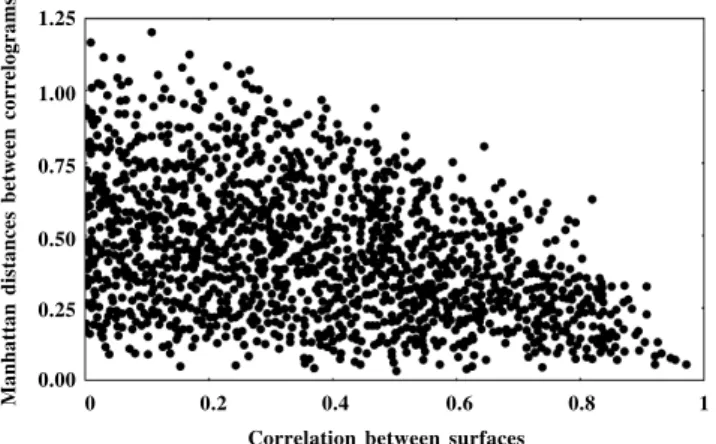
The values of the Manhattan distances between correlograms were widely distributed, ranging from 0 to 1.2, with a modal value close to 0.2 (Figure 4). Plotting the Manhattan distances against the correlation between surfaces indicated, as expected, that dissimilar surfaces (with low correlations) can produce similar correlograms and these formed a triangular envelope in bivariate space (Figure 5).
The analysis of Nei’s genetic distances using the Mantel test (Figure 6) also indicated a strong correlation between multivariate genetic divergence and geographic space under this stochastic process, although the magni-tude of this correlation depended on the number of gene frequencies used to construct each matrix. The average matrix correlation (standardized Mantel test; Smouse et al., 1986) increased when the number of gene frequencies used to establish Nei’s genetic distances was large, whereas the variance decreased with an increase in this number.
DISCUSSION
The correlograms obtained after simulating the varia-tion in gene frequencies across local populavaria-tions were usu-ally highly significant, indicating that stochastic processes generated by an O-U model produced strong spatial
pat-Figure 2 - Spatial correlograms obtained with simulated data. The average correlogram is shown by the solid line. See Figure 3 to examine the linear decrease in most of these correlograms.
90
75
60
45
30
15
0
-1 -0.8 -0.6 -0.4
Correlation between Moran’s I cofficient and distance class
Frequency of Pearson’s correlation
-0.2 0 0.2 0.4 0.6 0.8
Figure 3 - Frequency distribution of correlations relative to Pearson’s correlation between Moran’s I coefficient and distance class. Note the high degree of linearity of the correlograms shown in Figure 2.
Figure 4 - Frequency distribution of pairwise Manhattan distances be-tween correlograms generated using the Ornstein-Uhlenbeck stochastic spatial process with the same parameters.
150
135
120
105
90
75
60
45
30
15 0
0.031 0.161 0.291 0.421 0.551
Manhattan distances between correlograms
Frequency of Manhattan distance
0.681 0.811 0.941 1.071 1.201 -1.8
-1.2
-0.6
0
-0.6
-1.2
-1.8
0 1 2 3
Geographic distance class
Moran’s I coefficient
tances of 0.1-0.2 indicate the same spatial processes un-derlying the gene frequency surfaces, although it is diffi-cult to make a final decision about a specific critical value. Indeed, our results show that this critical value is depen-dent on the sample size. With a relatively low number of local populations, as used in this study, more variation is expected in the profiles and, although the modal value of the Manhattan distance was very close to 0.2, values up to 1.2 were obtained between correlograms generated by the same process.
The simulation strategy used in this study was com-pletely different from that previously used to investigate microevolutionary processes using autocorrelation analyses (Sokal and Wartenberg, 1981; Sokal et al., 1989, 1997), de-spite the convergence of the results in terms of expecta-tions of genetic divergence obtained with an isolation-by-distance model. Instead of simulating the dynamics of indi-viduals in space across time and estimating the correspond-ing gene frequencies, we simply used a stochastic process that produced an exponential relationship between genetic divergence and geographic distance. This strategy, although less realistic, is more general because it does not explicitly use ecological and genetic parameters of the organisms (un-known for most species), and is based only on the shape of the relationship between divergence and space. Although bio-logical parameters related to dispersion and drift obviously vary among different organisms, this relationship has been widely described by nonlinear equations. As such, null ex-pectations would be generated using this procedure based only on information about the geographic coordinates of the local populations studied. This strategy is based on well-known mathematical procedures that have been tested in phy-logenetic comparative analyses and can be easily imple-mented using various computer programs (see Martins and Garland, 1991; Martins, 1996; Díaz-Uriarte and Garland, 1996). The correlograms and related statistics were similar to those previously found using these more realistic proce-dures, thus validating the simple approach proposed here.
The procedures adopted here do not allow one to test differences among correlograms generated by different microevolutionary processes, since they do not simulate such processes. The idea is simply to approximate the ex-pected shape of the relationship between genetic divergence and geographic distance (which, in fact, would be gener-ated by different combinations of microevolutionary pro-cesses). Nevertheless, this approach does permit one to establish a range of variation in correlogram profiles that could be obtained with a simple stochastic process that simulates the evolution of gene frequencies in isolation-by-distance and related models. This possibility may be important when working with a few local populations be-cause very distinct correlograms may be obtained by chance only. Such correlograms suggest that different microevo-lutionary processes are involved in gene frequency varia-tion, but the approach used here indicated that they could be generated by a unique stochastic process.
Figure 5 - Relationship between pairwise Manhattan distances between correlograms and correlations between gene frequency surfaces. Note that similar correlograms can be obtained from uncorrelated surfaces.
70
60
50
40
30
20
0
0.2 0.4 0.6
Matrix correlation (Nei’s genetic distances versus geographic distances)
Frequency of matrix correlations
0.8 1
10
0
p = 10 p = 20 p = 30
Figure 6 - Distribution of the matrix correlations (standardized Mantel tests) between Nei’s (1972) genetic and geographic distances among popu-lations. The genetic distances were calculated using increasing number of simulated p gene frequencies.
terns. The profiles of the correlograms showed a decrease in Moran’s I coefficient with increasing geographic dis-tances, although the variance was low in the larger distance classes, as expected for an isolation-by-distance model and other stochastic models of genetic divergence among lo-cal populations in time and space (Sokal and Jacquez, 1991). Mantel tests used to evaluate the multivariate patterns of spatial autocorrelation in Nei’s genetic distances supported these conclusions. Matrix correlation values, however, are sensitive to increases in the number of gene frequencies used to estimate genetic distances (see modal values of correlations in Figure 6).
The most important aspect revealed by the simula-tions was the wide range of variation in the correlograms obtained under the same stochastic process that mimics the isolation-by-distance model, which results in relatively high Manhattan distances among them. According to Sokal and Wartenberg (1983) and Sokal (1986), Manhattan
dis-1.25
1.00
0.75
0.50
0.25
0.00
0 0.2 0.4 0.6
Correlation between surfaces
Computing the Manhattan distances among simulated correlograms allowed us to define a range for these values that would be expected in a specific situation (defined sample size and spatial distribution of local populations). If correlograms obtained with real genetic data for the same populations fall within this range, we may then conclude that autocorrelation analyses do not provide evidence that other microevolutionary processes, beyond simple stochas-tic variation structured across spatial dimension, are in-volved in gene frequency variation among local populations.
ACKNOWLEDGMENTS
The authors thank A.S.G. Coelho, F.A. Valva and L.J. Chaves for helpful discussions about population genetics and spa-tial structure. This work was parspa-tially supported by FUNAPE (Master’s degree grant to M.P.C.T) and CNPq (research fellow-ship to J.A.F.D.F.).
RESUMO
Nesse artigo, um processo estocástico Ornstein-Uhlenbeck foi utilizado para simular a relação exponencial entre divergência genética e distância geográfica, conforme é esperado em modelos de isolamento-por-distância, alpondras ou coalescência. As simulações foram realizadas a partir de um dendrograma UPGMA estimado a partir das distâncias geográficas entre 13 populações locais. As superfícies espaciais de freqüências alélicas simuladas foram analisadas através de autocorrelação espacial e construção de distâncias genéticas de Nei, com base em diferentes números de alelos. A divergência entre populações locais produziu padrões espaciais significativos, tanto em nível univariado (correlogramas espaciais) quanto em nível multivariado (teste de Mantel entre distâncias de Nei e distâncias geográficas). Entretanto, se as aná-lises são baseadas em um pequeno número de populações locais, os perfis dos correlogramas variam consideravelmente e as dis-tâncias Manhattan calculadas entre eles podem ser maiores do que as previamente estabelecidas em outros estudos de simulação. O método proposto permite assim estabelecer uma amplitude de perfis que podem ser obtidos pelo mesmo processo estocástico de divergência genética. A comparação de correlogramas obser-vados com esses perfis permite assim evitar o uso de outros meca-nismos microevolutivos para explicar essa divergência genética.
REFERENCES
Avise, J.C. (2000). Phylogeography. Harvard University Press, Cambridge.
Barbujani, G. (1987). Autocorrelation of gene frequencies under isolation-by-distance. Genetics 177: 772-782.
Díaz-Uriarte, R. and Garland, T. (1996). Testing hypotheses of correlated evolution using phylogenetically independent contrasts: sensitivity to deviations from Brownian motion. Syst. Biol. 45: 27-47.
Epperson, B.K. (1995a). Spatial distribution of genotypes under isolation by distance. Genetics 140: 1431-1440.
Epperson, B.K. (1995b). Spatial distribution of two-locus genotypes
un-der isolation by distance. Genetics 140: 365-375.
Felsenstein, J. (1988). Phylogenies and quantitative characters. Annu. Rev. Ecol. Syst. 19: 445-471.
Hansen, T.F. and Martins, E.P. (1996). Translating between microevolu-tionary process and macroevolumicroevolu-tionary patterns: the correlation struc-ture of interspecific data. Evolution 50: 1404-1417.
Kimura, M. (1983). The Neutral Theory of Molecular Evolution. Cam-bridge University Press, CamCam-bridge.
Kimura, M. and Weiss, G. (1964). The stepping stone model of population structure and the decrease of genetic correlation with distance. Ge-netics 49: 561-576.
Manly, B.F.J. (1991). Randomization and Monte Carlo Methods in Biol-ogy. Chapman and Hall, London.
Martins, E.P. (1995). Phylogenies and comparative data: a microevolu-tionary perspective. Philos. Trans. R. Soc. Lond. B. 349: 85-91.
Martins, E.P. (1996). Phylogenies, spatial autoregression and the com-parative method. Evolution 50: 1750-1765.
Martins, E.P. and Garland, T. (1991). Phylogenetic analyses of the corre-lated evolution of continuous characters: a simulation study. Evolu-tion 45: 534-557.
Nei, M. (1972). Genetic distance between populations. Am. Nat. 106: 283-292.
Nielsen, R., Mountain, J.L., Huelsenbeck, J.P. and Slatkin, M. (1998). Maximum likelihood estimation of population divergence times and population phylogeny in models without mutation. Evolution 52: 669-677.
Smouse, P.E., Long, J.C. and Sokal, R.R. (1986). Multiple regression and correlation extensions of the Mantel test of matrix correspondence.
Syst. Zool. 35: 627-632.
Sneath, P.H.A. and Sokal, R.R. (1973). Numerical Taxonomy. W.H. Free-man, San Francisco.
Sokal, R.R. (1986). Spatial data analysis and historical processes. In: Data Analysis and Informatics IV (Diday et al., eds.). Science Publishers, Amsterdam, pp. 29-43.
Sokal, R.R. and Jacquez, G.M. (1991). Testing inferences about microevo-lutionary processes by means of spatial autocorrelation analysis.
Evolution 45: 152-168.
Sokal, R.R. and Oden, N.L. (1978a). Spatial autocorrelation in biology. 1. Methodology. Biol. J. Linn. Soc. 10: 199-228.
Sokal, R.R. and Oden, N.L. (1978b). Spatial autocorrelation in biology. 2. Some biological implications and four applications of evolutionary and ecological interest. Biol. J. Linn. Soc. 10: 229-249.
Sokal, R.R. and Wartenberg, D. (1981). Space and population structure. In:
Dynamic Spatial Models (Griffith, D. and McKinnon, R., eds.). Sijthoff and Noordhoff, Alohen ann den Rijn, Netherlands, pp. 186-213.
Sokal, R.R. and Wartenberg, D. (1983). A test of spatial autocorrelation using an isolation-by-distance model. Genetics 105: 219-237.
Sokal, R.R., Smouse, P.E. and Neel, J.V. (1986). The genetic structure of a tribal population, the Yanomama indians. XV. Patterns inferred by autocorrelation analysis. Genetics 114: 259-287.
Sokal, R.R., Jacquez, G.M. and Wooten, M.C. (1989). Spatial autocorrelation analysis of migration and selection. Genetics 121: 845-855.
Sokal, R.R., Oden, N.L. and Thomson, B.A. (1997). A simulation study of microevolutionary inferences by spatial autocorrelation analysis. Biol. J. Linn. Soc. 60: 73-93.
Telles, M.P.C. (2000). Diversidade genética e estrutura populacional de cagaiteira(Eugenia dysenterica DC.) no Sudeste de Goiás. Master’s thesis, Universidade Federal de Goiás, Goiânia.
Wijsman, E.M. and Cavalli-Sforza, L.L. (1984). Migration and genetic population structure with special reference to humans. Annu. Rev. Ecol. Syst. 15: 279-301.
Wright, S. (1943). Isolation by distance. Genetics 28: 114-138.