i
João Pedro de Almeida Ribeiro
Project presented as partial requirement for obtaining the
Master’s degree in Information Managemen
t
ii
NOVA Information Management School
Instituto Superior de Estatística e Gestão de Informação
Universidade Nova de LisboaThe use of web analytics on a small data set in an online media company:
Shifter's case study
by
João Pedro de Almeida Ribeiro
Project presented as partial requirement for obtaining the Master’s degree in Information Management, with a specialization in Marketing Intelligence
Advisor:Professor Doutor Rui Gonçalves
iii
DEDICATION
iv
ACKNOWLEDGMENTS
I am grateful to many persons who shared their thoughts and concerns with me along the way but especially to my family and closest friends.
v
ABSTRACT
The primary struggle in data analysis is the lack of talent in performing relevant and fit-to-business analyzes that retrieve knowledge and provides concise and clear action plans to today’s startups and small enterprises that exist online. Tracking, knowing and understanding the navigational patterns of user behavior for a 3 month period collection and using an Excel spreadsheet tool obtained a context for each piece of content produced and published by Shifter, an online media company. Investigations made after acquiring Shifter’s data resulted in recommendations for rethink and redesign the editorial content of the business to answer different community’s needs.
KEYWORDS
vi
RESUMO
A primeira dificuldade na análise de dados é a falta de talento na prossecução de análises relevantes e que se adequem ao negócio que recolham conhecimento e planos de ação concretos para as Startups e pequenas empresas que existem Online nos dias de hoje. Rastrear, conhecer e perceber os padrões de navegação de comportamento dos utilizadores durante um período de recolha de dados de 3 meses e através de uma ferramenta de cálculo como o Excel obter um contexto para cada conteúdo produzido e publicado pelo Shifter, uma empresa de media Online. Investigações feitas depois de recolher os dados do Shifter resultaram em recomendações para repensar e redesenhar o conteúdo editorial do negócio para responder às diferentes necessidades das comunidades.
PALAVRAS-CHAVE
vii
TABLE OF CONTENTS
1.
INTRODUCTION ... 1
1.1.
Theoretical framework ... 1
1.2.
Main objectives ... 3
1.2.1.
Research question/ main goal ... 3
1.2.2.
Specific objectives ... 3
2.
RELEVANCE TO BUSINESS ... 4
3.
LITERATURE REVIEW ... 6
3.1.
Data mining ... 6
3.1.1.
Forms of Data Mining System ... 7
3.1.2.
Data Mining Algorithms ... 7
3.1.3.
Data Mining Process Models (KDD, CRISP-DM and SEMMA) ... 7
3.1.4.
Supervised Learning vs. Unsupervised Learning ... 8
3.1.5.
Data Mining Methodologies ... 8
3.1.6.
Data Problems plus Data Reduction Not Being a Real Problem ... 9
3.2.
Web mining ... 10
3.2.1.
Web usage mining ... 10
3.2.2.
Web content mining ... 11
3.2.3.
Web structure mining... 11
3.3.
Clickstream data ... 11
3.3.1.
What Benefit is there in Measuring Clickstreams? ... 12
3.4.
Analytical tools ... 12
4.
RESEARCH METHODOLOGY ... 14
4.1.
Data collection ... 14
5.
RESULTS & DISCUSSION ... 16
5.1.
Class Analysis ... 16
5.1.1.
Average Global Time per Visit ... 16
5.1.2.
Average Time per Visit per Class ... 17
5.1.3.
Device Access Rate by Class ... 18
5.1.4.
Device Access Rate by Day Period ... 19
viii
5.2.
User Analysis ... 20
5.2.1.
Nation That Spends More Time on Average at Shifter’s Website?
... 20
5.2.2.
Which Nation Reads More Tech and Music? ... 21
5.2.3.
What Nation Returns To Consume The Same Class? ... 22
5.2.4.
Users Return through the Same Device? ... 23
5.2.5.
Users Return at the Same Day Period? ... 23
5.2.6.
Which Users Take Longer in their Returns? ... 23
6.
CONCLUSIONS ... 24
7.
LIMITATIONS AND FUTURE RESEARCH ... 27
8.
REFERENCES ... 28
9.
APPENDICES ... 31
9.1.
Appendix A - Magic Quadrant for Digital Marketing Analytics ... 31
ix
LIST OF FIGURES
x
LIST OF TABLES
Table 1
–
Average Global Time per Visit ... 16
Table 2
–
Average Time per Visit per Class ... 17
Table 3
–
Device Access Rate by Class ... 18
Table 4
–
Device Access Rate by Day Period ... 19
Table 5
–
Class by Day Period ... 19
Table 6
–
Nation That Spends More Time on Average at Shifter’s Website
... 20
Table 7
–
Nation Consumption by Class ... 21
xi
ACRONYMS AND ABBREVIATIONS
ANN Artificial Neural Network
BI Business Intelligence
BBC British Broadcast Company
KPI Key Performance Indicators
API Application Programming Interface
CRISP-DM Cross-Industry Standard Process for Data Mining
DW Data Warehousing
GA Google Analytics
HTTP Hyper-Text Transfer Protocol
IBM International Business Machines
ICA Independent Component Analysis
ID Identity
IJCA International Journal of Computer Applications
IP Internet Protocol
IT Information Technology
KDD Knowledge Discovery Databases
KPI Key Performance Indicators
MDS Multidimensional Scaling
PC Personal Computer
PCA Principal Components Analysis
ROI Return on Investment
SEMMA Sample, Explore, Modify, Model, Assess
TDMI Technology Driven Market Intelligence
UK United Kingdom
URL Uniform Resource Locator
1
1.
INTRODUCTION
Long time ago data scarce and statistical tools were actually created for manual calculation. Now the power is on our desktop and there is a lot of data to work with. Data is plural and available for incoming leaders. Data is getting better every day, allowing having control over the model data created by analysts. If it doesn't leave to some sort of action it is a failure. But does everybody use it? There is no place for a “one size fits all” approach. We can’t expect to find an automated system. In fact, we have to get experienced and discover what software suits best the statistic output that is needed to solve the business problem.
In the XXI century is common sense that not knowing how to look at data and find meaningful patterns the same is to say valuable information may be perceived as a sign of neglect. This is an important part of professional progression for today’s leaders. Providing a more responsive and personalized business focused on people (employees, customers, society) with aligned values and long-term key performance indicators (KPI) is where the spotlight is. Understanding online user behavior in this context will allow better development of the website content, as well as reaching the right target audience (Lindén, 2016).
The purpose of this study is to design a framework that will help understand and retrieve values from the behavior of Shifter’s website users, a Portuguese online media company. The key question here is to find a process that helps young leaders analyze their core business from inside out. The promise of a small world is not real. We will not search for an outlier and prove if Data Mining works, but it is a good story beginning. It can be used at institutions of any size (profit and nonprofit) and depends on the robustness of one’s database. So how can we shrink Big Data analysis and the new complex sources of data that keep appearing? Applying machine learning to analyze where it is generated. Knowing the source is knowing where to start tracking.
1.1.
T
HEORETICAL FRAMEWORKMining, or the ability to revise unstructured or structured elements, is a critical life skill. Figuring out data mining is the science of learning the secret behind the numbers and statistical functions. Data miners take web scraping - name commonly given by hackers to the activity of mining the web - very seriously. The general term we often use of data mining is finding or detecting patterns in large databases does not represent what we now refer to as “everyday data.” Engagement with the objective and organization will help young innovative leaders to relate the collected data to current problems they expect to fix.
2 competitive context possessing and acting on structural data is a critical success factor for a website, such as traffic, engagement, and profitability (Jamalzadeh, 2011).
According to Dell’s advanced analytics & Big Data adoption report 2016 being able to gain a competitive advantage through advanced analytics appears as a permanent need because it’s seen as a tool for justifying spending and investments both also to measure Return on Investment (ROI). With an ever expanding amount of content and more interactive data that comes with the rise of social media. With the increasing complexity of the so called modern websites and new technologies to collect more data generated in interactive conversations, users’ behaviors or navigation paths, leaders try to understand if they’re exploring their marketplace at the fullest: are they extracting all the value in every string of digital data? And when this question is made in a scarce environment, it gets the spotlight of thousands of new young professionals.
Figure 1 – Web Mining Tree Structure Explanation. Reprinted from “Web Mining Techniques in E -Commerce Applications” by Siddiqui & Aljahdali, 2013, International Journal of Computer
Applications, 69, p.39, Copyright by the IJCA Journal – No.8
3
1.2.
M
AIN OBJECTIVES1.2.1.
Research question/ main goal
Our main goal with this project is to develop a model of analysis that allows small organizations to retrieve valuable knowledge from their businesses in a situation where exists a lack of understanding on how to take the best out of analytical tools available in the market. The correct identification of clusters with similar navigational and behavioral usage patterns will help design and optimize Shifter’s online performance (Kapusta, Pilková, Munk, & Švec, 2013).
Making a wise use of extractable pieces of data we intend to prove that learning the business context is crucial to develop more eligible variables to the analysis in order to capture the real value of visitors/users of Shifter’s website. The relevance of this research question ties to a new, simplified and open-minded way to think how can marketers create, plan and publish their editorial content to their online community according to different categories. In this project we called it classes.
1.2.2.
Specific objectives
By the end of this project we aspire to be successful in achieving the main goal. To do so, our specific objectives are the collection of data concerning Shifter’s core business (editorial content publishing), and users’ online navigation through a freely available analytical tool or software. Preprocessing data retrieved by not only cleaning both missing values and outliers resorting to the use of Excel spreadsheets but also creating classes of articles. In this particular step we should be able remove visitors with access values that constitute an outlier to this project (duration of visit over one hour long, per example) and move in advance to clustering techniques.
4
2.
RELEVANCE TO BUSINESS
By the time we’ve written these thesis tones of new websites have been built and for that reason it is urgent to put together a proper methodology to understand who is navigating our website and how their behavior impacts the business alone. Managing data tend to lead to business knowledge growth that should be aligned with both big and small corporations turning problem solving in decision making. Trying to use data as a benefit and not hide it in the closet fearing what new reality it holds.
Using data to fuel disruptive business strategies will eventually reduce big companies data issues, generally caused by a combination of the proliferation of duplicate, and often inconsistent occurrences of data (Gordon, 2007). Continuous misinterpretation and misunderstanding of the data caused by the lack of a cohesive, enterprise-wide data sources or bad data collection infrastructure are all ingredients of today’s beginner leaders. This could be the baseline for a continuous feedback process to improve upon the outcomes identified as organizations thrive to adjust their technical practices to accommodate analytics and to better manage data. For that reason, it’s highly important to define data management as it involves the collection and storage of data, plus its processing and delivery — whether traditional data, new big data, or both. As mentioned in the Technology Driven Market Intelligence (TDMI) Best Practices Report in 2013, processing can be extensive, especially when data is repurposed for a use differing from that of its origin as is common in business intelligence (BI), data warehousing (DW), and analytics (Russom, 2013).
Data analytics on its own is not a new thing, as data has been collected and recorded and utilized in some form or another for a very long time. However, technological advances in storing information have allowed for continuous collecting of data, whether it is relevant or not. Data storing capabilities are virtually limitless, and as such, the practice of storing all data has become commonplace. The challenge that arises from storing absolutely all collected data is finding and structuring the data in a way to make the information useful and accessible. Big data attempts to build those connections within the network of information, so as to make it easier for the data to find its way to the user, as opposed to the user having to find a way to the data (Gandomi & Haider, 2015).
To understand the impact of how data have transformed our daily lives, we can see how the media and technology consumption experience has changed. Now more than ever before we first validate it online with our friends and peer community. We live in a data driven world with the direct result of advents in information and communication technologies. Today, enterprises rely on a set of automated tools for knowledge discovery to gain business insight and intelligence. Many branches of knowledge discovery tools were developed to help today’s competitive business markets thrive in the age of information (Rashid Al-Azmi, 2013).
Information network analysis
With the development of Google and other effective web search engines, information network analysis has become an important research frontier, with broad applications, such as social network analysis, web community discovery, terrorist network mining, computer network analysis, and network intrusion detection.
Discovering, understanding, and the usage of patterns and knowledge
5 Stream data mining
Stream data refer to the data that flows into and out of the system like streams. Stream data are usually in vast volume, changing dynamically, possibly infinite, and containing multi-dimensional features. Typical examples of such data include audio and video recording of scientific and engineering processes, computer network information flow, web click streams, and satellite data flow. Such data cannot be handled by traditional database systems, and moreover, most systems, may only be able to read a data stream once in sequential order. This poses great challenges of effective mining of stream data that is quite common on social media nowadays and could be an important flow of.
Mining data for scheduling
For gaining competitive advantages, enterprises develop market research groups that analyze the large data sets to acquire knowledge. Market research, through mining, try and find what products dominate the market, why this is and what hidden elements that set such products leading in sales. For example, media networks use mining in their market research to set the common factors between audience and the program’s scheduled slot. The British Broadcasting Corporation (BBC) used to hire human experts to schedule its program slots. Now it uses fully automated mining tools for scheduling the results were equivalent or better than the human manual scheduling (Rashid Al-Azmi, 2013).
A more aware data-driven team
An analytics-driven culture requires employees who are passionate and skilled in exploring data and content. These users must understand the implications of critical data points and apply insight to every task. Companies that encourage this kind of behavior can liberate teams that have had to make crucial decisions based on instinct and past experiences alone. We believe that this Thought Leadership White Paper from 2014 conducted by the International Business Machines (IBM) sums up the need for a new skill set people in today’s organizations.
The Visual Display of Data
Visualization affects how the data is provisioned for users and the value they gain from it. Graphical interaction with data is fast becoming the expected norm for the full spectrum of users, from executives to frontline personnel. The Data Warehousing Institute 3rd Quarter 2013 Best Practices Report finds that visualization is a key concern for business intelligence and data analysis professionals because it affects how the data is provisioned for users and the value they gain from it. Good data visualization is critical to making smarter decisions and improving productivity; poorly created visualizations. On the other hand, can mislead users and make it more difficult for them to overcome the daily data onslaught.
Sharing of data insights
6
3.
LITERATURE REVIEW
In this section, themes like data mining, web mining, clickstream data, relevance to business, methodology, results & discussion, limitations of the thesis and conclusions will be presented in order to design a proper framework for the most affected companies that don't have the means to access and retrieve the data their own business is producing every day.
Existing research related to this thesis have been found in online articles, academic publications, in scientific journals, such as the Applied Computing and Informatics, and reports built by the biggest technological players around.
We do not limit our review of related work to data mining or web usage mining. We found that it has been a solid reason for not all of these studies are explicitly related to data mining. The central theme is the strategically extraction and use of information for innovative young organizations that can’t access the same amount of data due to their business dimension or small generation of data.
3.1.
D
ATA MININGThis data-driven discovery and decision-making phenomenon is more than a trend. Data mining is the extraction of knowledge from large amount of observational data sets, to discover unsuspected relationship and pattern hidden in data, summarizing the data in novel ways to make it understandable and useful to the data users (Adeniyi, Wei, & Yongquan, 2016). Data mining is also the process of exploration and analysis, by automatic or semiautomatic means, of large quantities of data in order to discover meaningful patterns and rules. Being an interdisciplinary subfield of computer science, it involves a computational process of large data sets’ pattern discovery. The goal of this advanced analysis process is to extract information from a data set and transform it into an understandable structure for further use (N. Jain & Srivastava, 2013). Traditionally conducted in areas where data abound, data mining main task is to identify patterns within the data, which may eventually become knowledge. To this end, the data mining methods used, such as cluster analysis, link analysis and classification and regression typically aim to reduce the amount of information (or data) to facilitate this pattern recognition (Zhu & Davidson, 2007).
Data mining methods are a panacea for solving problems involving hundreds of thousands of highly dimensional records. No single method can be expected to work well with diverse types of large databases (Cios & Kurgan, 2006).
Drew Conway, a Ph.D. student in the Department of Politics at New York University, shared a powerful statement on what Data Mining is in his research ‘Data Science U.S. Intelligence Community in IQT Quarterly Spring 2011: “The ability to take data – to be able to understand it, to process it, to extract value from it, to visualize it, to communicate it –that’s going to be a hugely important skill in the next decades, not only at the professional level but even at the educational level for elementary school kids, for high school kids, for college kids.” We believe that being a data scientist relates to what Drew stands for. A genuine ability to go on a mission to unlock opportunities that help everyday people improving their business processes and decisions.
7 that, broadly speaking, allow us to “teach” computers how to perform tasks by providing examples of how they should be done (Hertzmann & Fleet, 2012).
3.1.1.
Forms of Data Mining System
Following the notoriety and importance of a proper model to present to the machine making rules and fostering a faster learning system, two forms of data mining tasks were identified by researchers over the years: a predictive and descriptive approach.
In predictive data mining task, inference is performed on the current data in a database in order to predict future values of interest. A typical example is using consumer purchasing patterns to predict which products to place closer together on shelves, or to offer coupons for. While in descriptive task, data in a database are classified by characterizing the general properties of the data, it finds a pattern describing the data in the database so as to present the interpretation to the user (Sondwale, 2015).
3.1.2.
Data Mining Algorithms
Data mining algorithms can be divided into several categories. Here, we discuss two well-established categories: supervised learning and unsupervised learning. In supervised learning, the class attribute exists, and the task is to predict the class attributes value. Our previous example of predicting the class attributes “will buy” is an example of supervised learning (Zafarani, Abbasi, & Liu, 2014).
In unsupervised learning, the dataset has no class attribute, and our task is to find similar instances in the dataset and group them. By grouping these similar instances, one can find significant patterns in a dataset. For example, unsupervised learning can be used to identify events on Shifter’s Twitter account for instance, because the frequency of tweeting is different for various events. By using unsupervised learning, tweets can be grouped based on the times at which they appear and hence, identify the tweets’ corresponding real world events (Zafarani et al., 2014).
3.1.3.
Data Mining Process Models (KDD, CRISP-DM and SEMMA)
The Knowledge Discovery Databases (KDD) model is an iterative and interactive model. It has total nine steps that go from defining goals, creating a target data set, data cleaning and pre-processing, data transformation, choosing the proper data mining task and algorithm applies the algorithm and then interpret the mined patterns using discovered knowledge. The KDD is the process of extracting the hidden knowledge according from databases.
Cross-Industry Standard Process for Data Mining (CRISP-DM) was launched in late 1996 by Daimler Chrysler (then Daimler-Benz), SPSS (then ISL) and NCR. It provides a uniform framework and guidelines for data miners. It focuses on and uncovers important factors, including success criteria, business and data mining objectives.
8
3.1.4.
Supervised Learning vs. Unsupervised Learning
Supervised machine learning is the search for algorithms that reason from externally supplied instances to produce general hypotheses, which then make predictions about future instances. In other words, the goal of supervised learning is to build a concise model of the distribution of class labels in terms of predictive features (Kotsiantis, 2007).
It can be divided into classification when the class attribute is discrete and into regression when it is continuous. Examples can be decision tree learning, naive Bayes classifier, k-nearest neighbor classifier, classification with network information and regression methods, such as linear regression and logistic regression.
In unsupervised learning corrections to the network weights are not performed by an external agent, because in many cases we do not even know what solution we should expect from the network. The network itself decides what output is best for a given input and reorganizes accordingly (Rojas, 1996) because the clustering data are often unlabeled and it requires a distance measure (the Euclidean distance) to be known to the clustering algorithm.
3.1.5.
Data Mining Methodologies
NEURAL NETWORK
A neural network is an artificial representation of the human brain that tries to simulate its learning process. An artificial neural network (ANN) is known as a neural network. An artificial neural network is an efficient information system which resembles in characteristics with the biological neural network. In ANNs, collective behavior is characterized by their ability to learn , recall and generalized training pattern or data similar to that of human brain (Nanda, Tripathy, Nayak, & Mohapatra, 2013).
DECISION TREES
A decision tree is a classifier expressed as a recursive part of the instance space. The decision tree consists of nodes that form a rooted tree, meaning it is a directed tree with a node called “root” that has no incoming edges. All other nodes have exactly one incoming edge. A node with outgoing edges is called an internal or test node. All other nodes are called leaves (also known as terminal or decision nodes). In a decision tree, each internal node splits the instance space into two or more sub-spaces according to a certain discrete function of the input attributes values. In the simplest and most frequent case, each test considers a single attribute, such that the instance space is partitioned according to the attribute’s value. In the case of numeric attributes, the condition refers to a range (Ben-Gal, Maimon, & Rokach, 2005).
GENETIC ALGORITHM
Genetic algorithms are the heuristic search and optimization techniques that mimic the process of natural evolution. Thus, genetic algorithms implement the optimization strategies by simulating evolution of species through natural selection (A. Jain, Srinivasalu, & Bhattacharjya, 2005). It evaluates the target function to be optimized at some randomly selected points of the definition domain. Taking this information into account, a new set of points (a new population) is generated. Gradually, the points in the population approach local maxima and minima of the function.
9 RULE DISCOVERY OR RULE EXTRACTION
Rule discovery or rule extraction from data are data mining techniques aimed at understanding data structures, providing a comprehensible description instead of only black box prediction. Rule-based systems should expose in a comprehensible way knowledge hidden in data, providing logical justification for drawing conclusions, showing possible inconsistencies, and avoiding unpredictable conclusions which black box predictors may generate in untypical situations. Sets of rules are useful if rules are not too numerous, comprehensible, and have sufficiently high accuracy. Rules are used to support decision making in classification (classification, machine learning), regression (regression, statistics) and association tasks. Various forms of rules that allow expression of different types of knowledge are used: classical propositional logic (C-rules), association rules (Arules), fuzzy logic (F-rules), M-of-N or threshold rules (T-(F-rules), similarity or prototype-based rules (P-rules). Algorithms for extraction of rules from data have been advanced in statistics, machine learning, computational intelligence and Artificial Intelligence fields (Duch, 2007).
3.1.6.
Data Problems plus Data Reduction Not Being a Real Problem
A web analyst is responsible for delivering pertinent insights to strategic and tactical initiatives across their board of directors. Collecting, creating, and cleaning a target dataset is important tasks of the data mining process and it makes room for a well performed data preprocessing activity.
Analysts must be aware of some limitations within this job such as the occurrence of noise in the data due to the recording, uncertainty or probabilistic nature of specific feature and class values. Missing data or missing values can originate biased analysis if not treated carefully, therefore it can lead to poor assumptions or bad estimations, depending on the method used for handling missing data that can go from conventional methods, such as listwise deletion (or complete case analysis), imputation methods - marginal mean imputation, conditional mean imputation and the multiple imputation - maximum likelihood (direct maximum likelihood, the expectation-maximization). Even Bayesian simulation methods, namely the Schafer algorithms, the Van Buuren algorithm or the Hot deck imputation methods, despite each one, has its advantages and limitations (Soley-bori, 2013). Neglecting duplicated or redundant data can heavily affect a full committed analysis. Data scientists must spot data that has been recorded under different names or that has been repeated, but also the records which contain irrelevant and information-poor attributes. It is mandatory to have the right posture to understand that sometimes the data may not be up to date and hence we may need to discard them and may end up with insufficient data (Boba, 2009).
To deal with these data problems, the following types of data preprocessing are performed where appropriate: Data cleaning is the process of starting with raw data from one or more sources and maintaining reliable quality for your applications. It includes tasks such as removing duplicates, removing inconsistencies, supplying missing values. The same is to say that consists of tasks aimed at improving the quality of data (Ganti & Das, 2013).
10 correlation structure, whereas PCA capture the maximum variability in the data. Independent Component Analysis (ICA) starts from a factor analysis solution and searches for rotations that lead to independent components. The main drawback with all these classical dimensionality reduction approaches is that they only characterize linear subspaces (manifolds) in the data also assume that the underlying manifold is a linear subspace (Ghodsi, 2006).
3.2.
W
EB MININGA web analyst is responsible for delivering pertinent insights to strategic and tactical initiatives across the business. He or she must seek extensive understanding of data management full-lifecycle, developing and designing algorithms run multiple validations with business experts. They should also work on the operationalization of internally-developed modeling, and analytics tools using real business data and/or models. Assembling data sets from disparate sources is a plus when working with computational frameworks and systems, and when the main goal is to make the data useful. Web mining is a scientific step in the knowledge discovery in databases process and it aims to analyze data and discover knowledge from the Web. The Web data include all kinds of Web documents, hyperlinks among Web pages, and Web usage logs. Depending on the type of Web data being mined, Web mining can be broadly divided into three categories: Web content mining, Web structure mining, and Web usage mining (Srivastava et al., 2000).
Disruptive technologies carry implications, but how far ahead is Web Mining when in comparison with Clickstream (that we’ll explore further in chapter 2.3)? Rather than treating all the new data-related missions with scalable solutions, intelligence must kick in, providing new assessments plus new IT tools, new skill sets, and new business processes to meet the challenge that big data requires. Cultivating this new conceptual method will help mitigate the risks inherent in incongruent clicks or misleading conversion rates. Areas of predictive behavior and life cycle analytics.
This data mining technique automatically discovers or extracts the information from web documents and it consists of four main tasks: First, we extract the data either from online or offline text resources available on the World Wide Web - that is called resource finding. Second, we select and preprocess specific information from retrieving web resources. Third, through machine learning per example we discover general patterns - this phase it’s called generalization. Finally, the fourth task has to do with validation and interpretation of the mined patterns - the analysis phase (Malviya & Agrawal, 2015).
We conclude with a more advertising and media related definition that web mining is used to understand customer behavior, evaluate effectiveness of a particular Website, and help quantify the success of a marketing campaign” (Rahman & Ramos, 2013).
3.2.1.
Web usage mining
Web usage mining is the automatic discovery of user access patterns from Web logs (Cooley, Tan, & Srivastava, 1999). The identified visit patterns can help in understanding the overall access patterns, trends (Zaiane, Han, Li, & Hou, 1998) and allow for Web site design that is responsive to business goals and customer needs, such as user-level customization (Eirinaki & Vazirgiannis, 2003).
11 Web-based organization with its daily operations have reached astronomical proportions (B Liu, Mobasher, & Nasraoui, 2011).
3.2.2.
Web content mining
Web content mining is the process of discovering knowledge from Web page content (i.e., often text). It often uses techniques based on data mining and text mining (Bing Liu, 2011). Important Web content mining problems include data/information extraction (Hammer, Cho, Aranha, & Crespo, 1997), Web information integration (Knoblock et al., 1998), online opinion extraction, Web search (Page, Brin, Motwani, & Winograd, 1998) and processing (e.g., clustering or categorizing) search results, according to page content (Chen, Chiang, & Storey, 2012).
Web Content Mining is the process of extracting useful information from the contents of Web documents. Content data corresponds to the collection of facts a Web page was designed to convey to the users. It may consist of text, images, audio, video, or structured records such as lists and tables. While there exists a significant body of work in extracting knowledge from images - in the fields of image processing and computer vision - the application of these techniques to Web content mining has not been very rapid (Arti, Choudhary, & Purohit, 2015).
3.2.3.
Web structure mining
Web structure mining tries to discover useful information such as the importance of pages of the structure of hyperlinks on the basis of social network analysis (SNA) techniques and graph theory. Its research topics cover ranking pages (Page et al., 1998) (Sukhwani, Garla, & Chakraborty, 2012), finding Web community (Gibson, Kleinberg, & Raghavan, 1998).
Web structure mining focuses on the hyperlink structure of the Web. The different objects are linked in some way. Simply applying the traditional processes and assuming that the events are independent can lead to wrong conclusions. However, the appropriate handling of the links could lead to potential correlations, and then improve the predictive accuracy of the learned models (Costa & Gong, 2005).
The structure of a typical Web graph consists of Web pages as nodes, and hyperlinks as edges connecting between two related pages. Web structure mining can be regarded as the process of discovering structure information from the Web. This type of mining can be further divided into two kinds based on the kind of structural data used (Arti et al., 2015).
3.3.
C
LICKSTREAM DATAUnderstanding visitors in real-time could probably help decision makers turn clickstreams into revenue. Mastering data are very useful if monitoring lives web traffic. Visitor details is a clear aim to any organization, no question about this one. But what actions must we take in order to get some money out of ad clicks or simply improve traffic records, visiting sessions, click views, grow conversion events?
12 According to the 2003 International Journal of Computer Applications “the click-stream means a sequence of Web pages viewed by a user; pages are displayed one by one at a time. When a visitor accesses a website, the server retains all the actions taken by visitors in a log file.”
3.3.1.
What Benefit is there in Measuring Clickstreams?
Analyzing Web data has become a must-have for businesses. Significant research has been done in studying clickstream data to understand the navigation behavior of users after visiting a Web site. Analyzing clickstream data is not easy for most companies because Web logs are stored in a form that is not suited for analysis (Sukhwani et al., 2012).
Shifter’s leaders can’t address these issues using paid tools because that does not reflect their data management and investment policy. For that matter, it is quite difficult to retrieve information from their web logs. Nonetheless, to say that it is relevant to define some terms that compose the items that come with web logs. According to SAS Global Forum 2012 those are:
Visitor Identification Number: This is a unique identification number for each user visit. Date and time: Timestamp of the page visit.
IP Address: This field captures the unique IP address of the machine from where the page request is originating.
Page URL: URL of the current page the user is viewing.
Referral Page Information: Referral page captures the URL of the source page from where the request has originated
Browser and device information: Browser and device column provides information on the type of browser and device used for accessing the web pages.
With the improvement of the data mining tools, today’s online services collect all traces of user activity to produce clickstreams, sequences of time stamped events generated by user actions. For web-based services, these might include detailed HTTP requests. For mobile apps, clickstreams can include everything from button clicks, to finger swipes and text or voice input. Compared to user studies, clickstream analysis can scale to large user populations, identify behaviors without user assistance, and identify previously unknown behaviors (Wang, Zhang, Tang, Zheng, & Zhao, 2016).
3.4.
A
NALYTICAL TOOLSProviding the best customer experience in an online environment has given rise to the concept of data mining, big data and data analytics to create important and faster knowledge regarding a more efficient dashboard of business solutions or in Shifter’s concerns, to web content delivery.
No matter which approach or viewpoint applied towards website mining, Google Analytics (GA) is the holy grail of measurement tools for small enterprises to get free access to raw data. With modern and advanced web metrics GA is organized to provide managers with a clear step-wise progression of knowledge building: How is web traffic important to enterprises, what leaders can achieve with leveraging GA to optimize their websites and businesses in terms of marketing, user experience, conversions and reports based on solid, reliable data (Clifton, 2010).
13 requests to a web server for a file like a web page or image, (iv) metrics and (v) dimensions are quantitative measurements like conversion rates or bounce rates.
14
4.
RESEARCH METHODOLOGY
This methodology section describes how we’ve obtained the data, applied certain procedures or techniques, and analyzed our results. To articulate how we intended to discuss the problem diagnosed in the prior sections we must clarify the reasons we chose a particular technique over another and how the elected method fulfilled the overall goals of the project.
In order to conduct Shifter’s data mining analysis, we initially realized that the problem at hand was a classification problem; therefore the K-Nearest Neighbor method of data mining would be ideal. The objective of the system would be to create a mapping, a model or hypothesis between a given set of documents and class labels (Adeniyi et al., 2016).
However, we found a creative solution that resonates with Shifter’s context where marketers lack the analytical and statistical skills to understand the importance of choosing a certain methodology. The same can be defined as a process model instance, in which not only tasks, inputs and outputs must be specified, but also the way in which the tasks must be carried out (Mariscal, Marbán, & Fernández, 2010).
We’ve opted to work exclusively with Excel spreadsheets and apply filters to reach to clusters. Then we grouped it with similar characteristics or with very specific features or even with the type of behaviors that look alike among each other. Clustering is a division of data into groups of similar objects. Representing the data by fewer clusters necessarily loses certain fine details, but achieves simplification. It models data by its clusters. There exist a variety of algorithms that meet these requirements and were successfully applied to real-life data mining problems (Banerji, Saxena, Soni, & Upadhyay, 2015).
Anticipating problems that come along with a small database built on a free platform full of constraints of tracking and recording observations (visitors entering the website); with this software the variable transformation was a steady procedure and an expected consequence due to the circumstances we faced.
4.1.
D
ATA COLLECTIONIt was important to identify which variables would be meaningful for this type of business. The Shifter’s channel is an online media one and like many of other online media companies it produces data in such an extension that marketers don't realize its true value and relevance. Learning and acknowledging that there is data being generated that reveals powerful insights is the first step to get closer to a better customer service.
Nowadays, web analytics services are provided by commercial tools like CrazyEgg or Hotjar that automatically gather interaction data from live websites, offering heat maps and other usability-specific statistics. These services demand fewer resources since end-users are the ones who unknowingly provide the required feedback (Grigera, Garrido, Rivero, & Rossi, 2016).
Although the first thought was to use SAS Enterprise Miner and apply data mining techniques using the nodes of the software to build the most accurate model and diagram, we’ve established that using an Excel-based approach and all that its functionalities came closer to the real environment characterized by scarcity has we’ve mentioned above.
15 accessed also included). We found necessary to have a set of 9 essential variables that are important to convey richer information to Shifter’s leaders.
To ensure a rigorous analysis we needed always to guarantee that there was an identification number or character of each person that interacted somehow with the business itself. In this case, the interaction was accessing Shifter’s website and specific URL article through a known device in a certain period in of time.
UserID Nation URL Article Publishing Date
Access
Date Class Device Duration
Day Period
490e9106 Portugal http://shifter... 20/04/2016 08/07/2016 TV
Series Smartphone 1:07 Morning
Figure 2 – Example of a Data Set
In Shifter’s analysis, we named User ID a unique visitor ID, the Nation given by each visitors’ IP address (Angola, Belgium, Brazil, France, Germany, Portugal, Ireland, Mozambique, USA, Spain, Switzerland and UK, were the twelve different nations discovered and collected in this project), presented with the URL for each visited article. Not only the publishing date that was available on the correspondent URL Article, but also the access date given by the three month period time for data collection (enough to ensure a large enough sample size: approximately 50.000 entries). These last two variables were very important to include because it gave us the time span between the time it was public to the audience and it was consumed or visited.
16
5.
RESULTS & DISCUSSION
Amongst the problems that we identify has been the root of the project - scarcity of data and knowledge of data treatment and management -, the first question we tried to answer with this project was how to classify the data we’ve had collected.
The solution was to create seven classes (TV Series, Society, Social Media, Music, Sports and Technology) to cluster information with similar importance and value to the business - the produced theme allocated to each article in order to perform a coherent analysis. The user or visitor accessing Shifter’s website was the second point of view from which the analysis would focus on as we can see in the section below: a Class Analysis and a User Analysis.
5.1.
C
LASSA
NALYSIS5.1.1.
Average Global Time per Visit
Shifter Data Set Average Global Time Per Visit
Shifter Data Set 1min 21 sec
Table 1 – Average Global Time per Visit
17
5.1.2.
Average Time per Visit per Class
Class Average Time Per Visit
Music 0min 59 sec
TV Series 2min 18 sec
Social Media 0min 35 sec
Society 1min 29 sec
Sports 1min 05 sec
Tech 0min 54 sec
Table 2 – Average Time per Visit per Class
18
5.1.3.
Device Access Rate by Class
Class/Device Smartphone Desktop Tablet
Music 35,54% 46,28% 18,18%
Social Media 10,74% 72,73% 16,53%
Society 52,89% 34,71% 12,40%
TV Series 51,24% 32,23% 16,53%
Sports 35,99% 38,49% 15,52%
Tech 51,54% 35,54% 12,92%
Table 3 – Device Access Rate by Class
19
5.1.4.
Device Access Rate by Day Period
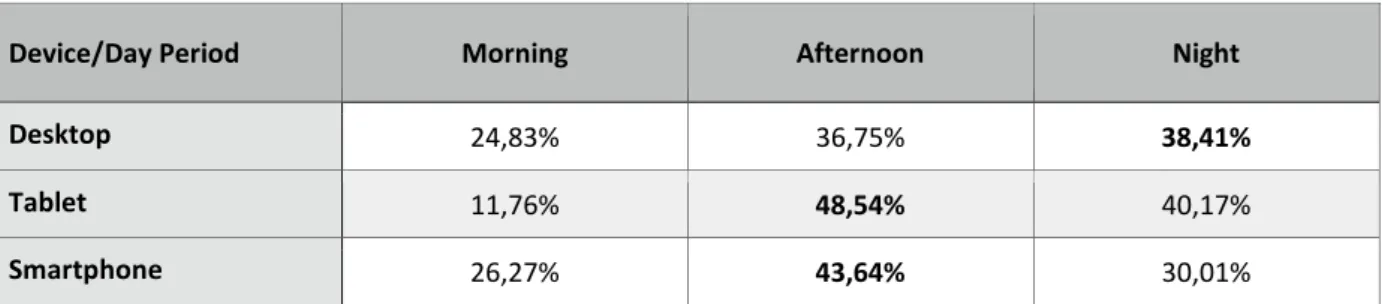
Device/Day Period Morning Afternoon Night
Desktop 24,83% 36,75% 38,41%
Tablet 11,76% 48,54% 40,17%
Smartphone 26,27% 43,64% 30,01%
Table 4 – Device Access Rate by Day Period
As the mobile tipping point is important and knowing what are consumers preferences, we’ve perceived that day and period of time were a very important learning variable to identify the path on page visiting. In our project, we’ve detected that by Desktop has more usage by night and afternoon, Tablet has clearly a afternoon usage (almost half of the accesses by Tablet were taken in the afternoon) and Smartphone is mainly used by afternoon and it's the device most used in the morning - perhaps due to the people’s commute period.
5.1.5.
Class by Day Period
Class/Day Period Morning Afternoon Night
Music 27,86% 35,25% 36,89%
Social Media 25,53% 25,53% 48,94%
Society 23,33% 0,4% 36,67%
TV Series 17,94% 38,46% 43,59%
Sports 29,89% 52,87% 17,24%
Tech 19,55% 46,62% 33,83%
Table 5 – Class by Day Period
20
5.2.
U
SERA
NALYSIS5.2.1.
Nation That Spends More Time on Average at Shifter’s Website?
Nation Average Time Per Visit
Angola 1min 33 sec
Belgium 1min 05 sec
Brazil 1min 59 sec
France 1min 24 sec
Germany 1min 03 sec
Portugal 1min 40 sec
Ireland 1min 12 sec
Mozambique 1min 20 sec
USA 1min 11 sec
Spain 1min 09 sec
Switzerland 1min 0 sec
United Kingdom 1min 30 sec
Table 6 – Nation That Spends More Time on Average at Shifter’s Website
21
5.2.2.
Which Nation Reads More Tech and Music?
Nation/Class Music Social Media Society TV Series Sports Tech
Angola 20,23% 11,81% 47,26% 9,77% 5,43% 5,5%
Belgium 35,30% 26,22% 5,66% 12,11% 14,11% 6,6%
Brazil 11,11% 13,14% 7,86% 17,16% 20,20% 30,53%
France 8,12% 22,23% 43,14% 4,12% 12,29% 10,10%
Germany 12,16% 12,23% 4,12% 36,12% 6,19% 29,18%
Portugal 19,44% 15,26% 10,51% 14,1% 10,51% 30,18%
Ireland 30,50% 8,86% 5,43% 10,79% 5,43% 38,99%
Mozambique
22,06% 27,05% 7,40% 19,88% 16,73% 6,88%
USA 3,82% 15,74% 20,88% 13,19% 2,11% 44,26%
Spain 17,47% 20,74% 3,33% 12,11% 13,04% 33,31%
Switzerland 7,83% 7,55% 27,27% 47,21% 5,36% 4,78%
United
Kingdom 19,85% 29,99% 9,45% 6,14% 24,36% 10,21%
Table 7 – Nation Consumption by Class
22 The data revealed a similar pattern of device access behavior - both prefer mobile experience and that could be the connection to such interest in Social Media issues - leading to a social media generation highly committed in evolving their expertise in online marketing and perfecting their digital presence (characteristics present in entertainment professional fields that could be found in the Music or Sports industries - both have some interesting values on this class).
Nation
1st Access 2nd Access
Class Device Day
Period
Avg Visit
Duration Class Device
Day Period
Avg Visit Duration
Angola Society Desktop Morning 1min 33 sec Music Smartphone Morning 1min 33 sec
Belgium Music Desktop Morning 1min 05 sec
Social
Media Tablet Afternoon
0min 50 sec
Brazil Tech Desktop Morning 1min 59 sec Sports Desktop Morning 1min 44 sec
France Society Desktop Afternoon 1min 24 sec Sports Smartphone Afternoon 1min 11 sec
Germany Series TV Smartphone Night 1min 03 sec
Portugal Tech Desktop Afternoon 1min 40
sec Sports Smartphone Night
1min 45 sec
Ireland Tech Smartphone Afternoon 1min 12
sec Tech Tablet Afternoon
1min 12 sec
Mozambique Social
Media Smartphone Afternoon
1min 20 sec
Social
Media Smartphone Night
1min 01 sec
USA Tech Smartphone Night 1min 11
sec Tech Desktop Morning
0min 32 sec
Spain Tech Desktop Night 1min 09 sec Series TV Smartphone Night 1min 0 sec
Switzerland TV
Series Smartphone Afternoon 1min 0 sec
United Kingdom
Social
Media Smartphone Night
1min 30
sec Sports Smartphone Morning
1min 28 sec
Table 8 – 1st
and 2nd Access Matrix by Nation
5.2.3.
What Nation Returns To Consume The Same Class?
23 always results in habits, we have the confirmation that Shifter is now a mass media broadcaster than just a Tech-only media company. The far majority of the Nations in the Data Set (9 out of 10) exactly 90% of the total of Nations that come back for new experiences with Shifter opt for totally new contents and subjects. It is difficult to convince and persuade visitors to come to our website, but it is even more challenging to have a second opportunity to persuade them again. Keeping an interested audience engaged in time is possible with refreshing broad news when we are talking about a website with Shifter’s dimension.
5.2.4.
Users Return through the Same Device?
Using the same device when consuming news from leading online media portals or websites is important for supporting the redesign of the marketing strategies and editorial publications’ segmentation plan. We discovered that only Brazil, Ireland and UK come back through the same device they had their very first experience on Shifter - most of them (2 out of 3) was from Smartphone that is to say due to its satisfactory mobile experience (from the layouts, user-friendly interaction, close to other key-factors like easiness to find information or the size of the buttons or imagery).
5.2.5.
Users Return at the Same Day Period?
Returning is a point in favor of any website and it means that attention first capture was converted in a happy customer that sees a business as trustworthy and reliable. Coming back at the same day period has the last visit is an insight for behavior pattern or habit being formed: only Angola, Brazil, France, Ireland and Spain consumed at the same day period has the first time, which can have implications in segmentation planning when a certain remarketing campaign is active for audiences of these countries (ensuring that people who visited Shifter’s website will get shown ads).
5.2.6.
Which Users Take Longer in their Returns?
24
6.
CONCLUSIONS
We’ve noticed that was central to cross values after the construction and transformation of the URL Links into Classes of the main 6 articles subjects: Tech, Social Media, TV Series, Music, Society and Sports. This decision simplified our mission to build a framework on how to analyze and learn about Shifter’s community behavior. We set out to create an easy way to retrieve business intelligence by a Class Analysis and a User Analysis.
Shifter’s Data Set showed us that the average time per visit was 1 minute and 21 seconds across all devices, nations and classes. TV Series was the Class with the biggest time per visit with an average of 2 minutes and 18 seconds, followed by Society with 1 minute and 29 seconds, Sports (1 minute and 5 seconds), Music (59 seconds), Tech with 54 seconds and Social Media with 35 seconds are the Classes were visitors spent the least time. Observing this behavior we recommend Shifter’s managers to rethink their editorial publications’ priorities such as focusing their efforts on TV Series content and rebuilding awareness near the Tech supporters.
Being a responsive website it was essential to pinpoint the Devices through which visitors were accessing each Class and in what Day Period that happened with more consistency. Findings exhibited that Music, Social Media and Sports were mostly viewed from Desktop, Society, TV Series and Tech articles were in the majority of the time accessed through Smartphone. Here the main message is that Phone and Desktop are the first choices to access information and that the Tablet was is not an important piece of the equation of interaction with Shifter’s content. Devices by Day Period evaluations revealed that Morning is not a decisive moment to users to access the website on every Device. Excluding Desktop that is more used by Night, Smartphone and Tablet are more required in an afternoon period.
Trying to answer the question of in what day period does classes get visited the most? We’ve found out some interesting insights. We recommend Shifter publish Social Media, TV Series and Music content by night because nearly half their visitors come at night to consume it (approximately 49%, 44% and 37% respectively). Sports, Society and Tech are with no doubt subjects more consumed by Afternoon which reinforces the key finding that mornings are not that active.
Looking now to a User Analysis we first concentrate our efforts in discriminate each Nation’s average time per visit and that lead us to the following: Brazil, Portugal and Angola are with no surprise the leading countries that spend more time on Shifter’s Website due to its mother tongue being Portuguese. On the other hand, we see Germany and Belgium Switzerland with the lowest amount of time at the Portuguese website. France, Ireland, Mozambique, USA, United Kingdom and Spain all spent somewhere between 1 minute and 9 seconds and 1 minute and 30 seconds. There is an opportunity to explore affiliate marketing campaigns with Portuguese countries to promote more traffic from this target segment if this follows Shifter’s marketing strategy.
Investigating the preferences per Nation per Class we gather values that resulted in clear navigations pattern behaviors. Attempting to narrow some favorite subjects for some countries we also measured visitors that came for a second time to consume the same Class. Fair is to say that German and Swiss didn’t come back during the period this data was collected.
25 The Belgium first access was from Desktop in search for Music articles in the Morning period and the second visit was conducted from Tablet in the Afternoon looking for Social Media news that took them on average less 15 seconds of their time (1 minute and 5 seconds to 50 seconds in this last page visit).
Brazilian visitors consumed at both events recorded in the same Device (Desktop) and in the same Day Period (in the Morning), but searched for different subjects and took less time on average: first access revealed their preference for Tech and the second access they returned for Sports spending 1 minute and 44 seconds less 15 seconds than the first time.
The French consumed Shifter’s content principally in the Afternoon whereas in the second time it took them less 13 seconds (from 1 minute and 24 seconds to 1 minute and 11 seconds). They alternated Society through Desktop access in the first visit for Sports through Phone in the second one.
Both German and Swiss visitor navigation pattern was similar in the only visit they took to Shifter’s website. They opted for TV Series and accessed it though Smartphone and took almost the same time (Germans took 1 minute and 3 seconds on average and Swiss 1 minute alone). The only difference was on the Day Period their interaction took place: the Germans by Night and the Swiss in the Afternoon.
The Portuguese visitor preferences were the only country that has seen its experience prolonged in time on page. In resume their first access was mainly done by Desktop in the Afternoon for Tech related articles and in the second time it occurred by Night through Phone to consume Sports related info (1 minute and 40 seconds increased to 1 minute and 45 seconds in the second event).
Irish visitors were conservative in their consumption of information in their interaction with Shifter’s website mainly because they preferences pointed to a regular behavior or performance. They access in the Afternoon to consume Tech in both visits only changing the Device from which they conveyed their interaction: from Phone to Tablet spending the same time - 1 minute and 12 seconds.
Mozambique another former Portuguese colony like Angola repeated their first interaction with Shifter’s work, namely Social Media information through Smartphone, first in the Afternoon, and in a second time at night, spending less time on this one (from 1 minute and 20 seconds to 1 minute and 1 second). Along with Ireland and USA, Mozambique visitors came back to consume the same type of information.
The USA as mentioned above returned to consume Tech based articles but one characteristic that stood out was the great reduction of time on page from the first visit to the second one (from 1 minute and 11 seconds to 32 seconds, the biggest in our sample: 39 seconds less). The first contact was through Phone by Night and the second one in the Morning through the Desktop which could indicate commute consumption or right before starting a day of labor.
26 United Kingdom’s visitors were like Mozambique visitors - they preferred to interact with Shifter’s website through Phone which opens a window to explore if mobile marketing could have an impact on the increase of traffic from this two Nations. The Social Media information accessed by Night was in their majority of the time 1 minute and 30 seconds (the highest time on page from a non-Portuguese speaking country) their keen topic, followed by Sports in the morning in their second interaction (with an average visit duration of 1minute and 28 seconds) which could indicate a segment to nurture and track with attention because they maintained in their essence their navigation pattern length.
Our project was able to retrieve value and business intelligence for Shifter’s daily work planning and offering editorial contents with giving recommendations on how to address the main issue of translate data into information into real business applications from affiliated marketing opportunities with Portuguese Speaking Nations, publications rescheduling orientations for some Nations and redesigning priorities around Device and Day Period segmentation plus investing in non-so obvious communities like the United Kingdom.
We have tried to pursue the goal to analyze and retrieve valuable indications from a small data set that contains lower volumes of entries or sources than Big Data problems most common in bigger companies. We showed that with fewer variables and slight transformations on the collected data, we managed to extract meaningful insights and learn so much from the business: we now are in a good position to affirm that Shifter can now address immediate needs of consumption of their audience but not only that. Namely, we demonstrated that we can apply along with a Class a User analysis on the small data we had and we also validated the existence of different classes that attract distinctly engaged Nations and therefore visitors and potential consumers of Shifter’s content.
Our study proved which clusters tend to return to the website and how they behave in this second experience, the comparison showed amazing findings and we took a step further comparing this returning behavior between Nations and pointed out evidences of similarities and differences in this journey. Our examination revealed a new flow of patterns and habits such as a gross preference for Smartphone and mobile experience from the Mozambique and United Kingdom’s Users or a global reduction of time spent on this second visit by all countries (excluding Portugal that rose its average duration on site).
27
7.
LIMITATIONS AND FUTURE RESEARCH
Using a free software not as powerful as SAS Enterprise Miner (that was a possibility in this project, but was rejected for the reason we pointed out in chapter 4) or even Google Analytics (which was a poor solution mainly due to its focus on visibility metrics that reflect the performance on website visitors), like Hotjar had his constraints beginning with the incapability to export data recorded to an xlsx or other file format.
Not being able to detect patterns in an automated fast way like graphic view was a difficult part of the analysis that made our collecting work slower than, for instance, if we instead used Google Analytics which gives us reporting tables and tracking in a quick way. However, our main contribution happened due to the need to transform the given variables and we recognize that many other transformations could have been conducted, but a concern was always to reduce the complexity of the analysis the same is to say the number of variables to analyze.