A SIMPLE INTERFEROMETRIC METHOD TO MEASURE THE
CALIBRATION FACTOR AND DISPLACEMENT AMPLIFICATION IN
PIEZOELECTRIC FLEXTENSIONAL ACTUATORS
Francisco de Assis Andrade Barbosa
∗Gilder Nader
†Ricardo Tokio Higuti
∗Cláudio Kitano
∗Emílio Carlos Nelli Silva
‡ [email protected]∗Departamento de Engenharia Elétrica - Unesp Avenida Brasil, 56, CEP 15385-000, Ilha Solteira, SP
†Instituto de Pesquisas Tecnológicas, Centro de Metrologia de Fluidos
Rua Prof. Almeida Prado, 532, Cidade Universitária, CEP 05508-901 - São Paulo, SP
‡Departamento de Mecatrônica e de Sistemas Mecânicos - EPUSP
Avenida Prof. Mello Moraes, 2231, CEP 05508-900, São Paulo, SP
ABSTRACT
Laser interferometry is a well-established technique for the characterization of piezoelectric actuators. In this work, by using a low cost Michelson interferometer, the measurement of the calibration factor and the displacement amplification of a novel piezoelectric flextensional actuator (PFA), de-signed by using the topology optimization method, is per-formed. A simple method, based on small phase modula-tion depth when the PFA is driven by a triangular wave-form, allows the absolute interferometer calibration. The free-displacement of the PFA for various drive voltages is measured and the displacement amplification is determined. The linearity and frequency response of the PFA are evalu-ated up to 20 kHz.
KEYWORDS: Interferometers, Displacement measurement, Piezoelectric flextensional actuators, PZT ceramics.
Artigo submetido em 13/08/2009 (Id.: 01024) Revisado em 17/03/2010, 02/08/2010
Aceito sob recomendação do Editor Associado Prof. Sebastian Yuri Caval-canti Catunda
RESUMO
Um método interferométrico simples para mensurar o fa-tor de calibração e a amplificação do deslocamento em atuadores piezoelétricos flextensionais
A interferometria laser constitui uma técnica consagrada para caracterizar atuadores piezoelétricos. Neste trabalho, utiliza-se um interferômetro de Michelson de baixo custo para men-surar o fator de calibração e a amplificação de deslocamento de um novo atuador piezoelétrico flextensional (APF), pro-jetado através da técnica de otimização topológica. Um mé-todo simples, baseado na excitação do APF com sinal tri-angular e com baixa profundidade de modulação de fase óp-tica, permite realizar a calibração absoluta do interferômetro. Deslocamentos do APF para várias tensões de excitação são mensurados e a amplificação do deslocamento da piezocerâ-mica é determinada. A linearidade e a resposta em frequência do APF, até a frequência de 20 kHz, são avaliadas.
1
INTRODUCTION
Piezoelectric ceramics such as PZT can convert electrical energy to mechanical form (Uchino, 2000). As the PZT drive voltage changes, the piezo element changes its dimen-sions. Because of the free strain or displacement (in plane:
d31; out of plane: d33) of the piezoceramics is small, they
generally cannot be used directly as actuators in their raw form, unless high drive voltage levels are employed; con-sequently, amplification is required. Piezoelectric ceramic actuators usually employ mechanical amplifiers to convert the small induced strain of the ceramic material to a large output displacement, which can be used for practical ap-plications. Compliant mechanisms are generally used as mechanical displacement amplifiers to prevent displacement losses that can occur in conventional pin-jointed mechanisms (Carbonari et al., 2007).
The use of piezoelectric actuators is increasing in vari-ous novel applications such as optical instruments (lasers and interferometers), accurate positioning in semiconduc-tor chips manufacturing, smart composite structures, scan-ning probe microscopy, micromanipulation tools (needles or micro pipettes) applied to cell manipulation, and others (Niezrecki et al., 2001; Bouchilloux et al., 2004; De Abreu et al., 2004; Putra et al., 2007). They can yield large force generation, sub-millisecond response, no magnetic fields, ex-tremely low steady-state power consumption, etc. One kind of this transducer is the piezoelectric flextensional actuator (PFA), which consists of three parts: the metal caps or shell, the active piezoelectric element, and an epoxy adhesive. Two examples are given by the moonie and the cymbal PFAs (Newnham et al., 1993; Dogan et al., 1996). PFAs have been developed in the past by using analytical models that were complemented by experimental observations in the case of simple structures, or by the finite-element method (FEM) in the case of more complex structures. The topology choice was usually based on the physical intuition of the problem.
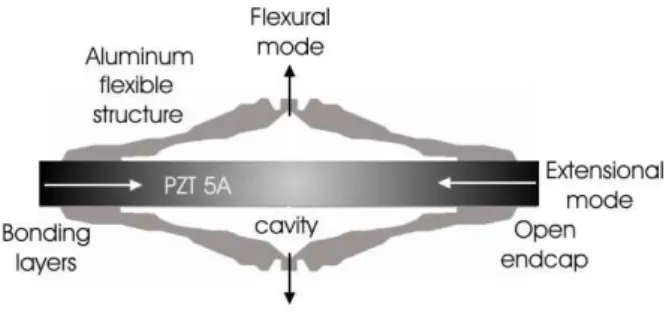
Recently, novel models of optimized PFAs have been de-signed using the topology optimization technique, a compu-tational design method that combines FEM and an optimiza-tion algorithm (Silva and Kikuchi, 2000; Silva et al., 2003). A schematic of a such PFA is shown in figure 1: the caps convert and amplify the small radial displacement and vibra-tion velocity of the piezoceramic into a much larger axial displacement and vibration velocity normal to the surface of the caps (Marçal et al., 2007).
In this work, a prototype based on these novel flextensional piezoactuators was manufactured and analyzed. This PFA was designed with the aim to be employed, in a future work, as a mechanical controller in the reference arm of a high-sensitive optical interferometer proposed to measure
time-Figure 1: Schematic of the piezoelectric flextensional actuator (Marçal et al., 2007).
varying displacements with arbitrary shape in sub-angström ranges. For the purpose of mechanically stabilizing this in-terferometer, it was specified that the PFA should provide amplitude displacements ranging from 100 to 200 nm, with frequency bandwidth corresponding to 3.5 kHz at least, and maximum drive voltage equal to 150 Vpeak. Accordingly,
in order to characterize the PFA it is necessary to measure displacements down to the nanometric scale. An important measure of the performance of the PFA mechanism is its stroke amplification or geometric advantage. The no-load amplification corresponds to the ratio of free-displacement of output-point of the PFA compliant mechanism and free-displacement of the piezoceramic itself.
in-troduces noise into the detection system. Methods of spec-trum analysis of the interferometric output can also be used to measure displacements by simple passive phase-detection schemes. The J1/J2 and J1/J3 techniques were devel-oped to be applied with a homodyne Michelson interferome-ter to measure the vibrational displacement ranging from 26 up to 600 nm at sonic and ultrasonic frequencies (Deferrari et al., 1967). However, these methods require adjusting the reference mirror of the interferometer to maximize either the fundamental or the second harmonic of the photodetected signal. In addition, they require inversion of Bessel func-tion relafunc-tionships to determine the vibrafunc-tion amplitudes and also problems with phase ambiguity arises, which make dif-ficult the correct demodulation of the intended signals. On the other hand, the technique named J1..J4 method pro-vides direct, self-consistent, and linear phase readout without using any feedback or phase-bias (Sudarshanam and Srini-vasan, 1989). Recently, this method has been applied to nanometric displacement measurements in PFAs by using a Michelson interferometer (Marçal et al., 2007). This tech-nique employs well-known Bessel functions recurrence rela-tions to determine the optical phase modulation index, and the phase measurement is unaffected by fading. However, this method of spectrum analysis has poor phase demodula-tion dynamic range and the time-varying displacement of the vibrating transducer face should be a pure sinusoidal func-tion.
The system setup used in this work is a very simple, low cost and precise one, which enables the measurement of the nanometric displacements of a PFA that will be coupled to a mirror in a future assembly, functioning in another closed-loop ultra sensitive interferometer as an optical phase con-troller. It corresponds to an homodyne Michelson interfer-ometer operating under small phase modulation depth, and needs neither critical electronics nor complex optical parts. Additionally, it is possible to measure arbitrary time-varying displacement functions. However, the operation under small phase modulation depth is not a self-consistent approach, and a calibration factor, used to convert the photodetected voltage into nanometers, must be determined. In practice, as the PFA structure is quite complex, an accurated interferometer cali-bration factor cannot be analytically obtained, and hence an experimental procedure must be established to measure it. In this work, a simple method that uses a triangular waveform voltage to drive the PFA is discussed, in order to calibrate the interferometer. The paper presents the theory of operation, the layout of the system, and experimental results obtained from the laboratory system prototype.
2
PIEZOELECTRIC ACTUATOR DESIGN
AND ASSEMBLY
In a compliant mechanism the movement is given by the structure flexibility rather than by the presence of pins and joints. The metal caps serve as mechanical transformers for converting and amplifying the lateral nanometric displace-ments of the ceramic into a larger axial displacement normal to the caps. Actually, both thed31andd33coefficients of the
piezoelectric ceramic contribute to the axial displacement of the composite.
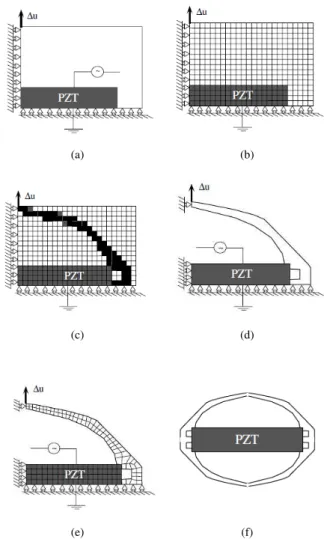
Topology optimization with homogenization method is ap-plied to the design of compliant mechanisms and composite materials (Silva and Kikuchi, 1999; Li et al., 2001). It is a computational design method that combines optimization algorithms and FEM to find the optimized topology of me-chanical parts considering an objective function and some constraints. Since the mechanical part of piezoelectric actua-tors is actually a compliant mechanism, PFAs have also been designed by using topology optimization techniques. The performance of PFAs depends on the distribution of stiff-ness and flexibility in the coupling structure that is bonded to the piezoceramic, which is related to the coupling struc-ture topology. Therefore, the problem of designing a PFA is posed as the design of a flexible structure coupled to the piezoceramic that maximizes the output displacement and generative force in some specific direction. Even though the coupling structure acts as a compliant mechanism, it must be designed while coupled to the piezoceramic, since the force applied by the piezoceramic to the coupling structure de-pends on the flexible structure characteristics (stiffness and mass).
to compliant mechanism design is given in Carbonari et al. (2007), Li et al. (2001), Silva and Kikuchi (2000), and Silva and Kikuchi (1999).
Specifically in this work, the device designed by topology optimization is shown in figure 4 (the same as sketched in figure 1), and it consists essentially of a piezoceramic bonded with epoxy resin to an aluminium flexible structure manufac-tured by using a wire EDM (Electrical Discharge Machin-ing). The piezoceramic (PZT-5A, American Piezoceramics, 30 mm x 13 mm x 3 mm in directions 1, 2 and 3, respec-tively) is polarized in direction 3 and electrodes are deposited on the 1-2 plane. PFA displacements decreases away from the center of the caps, where the maximum displacement is observed, to the edge, where displacement is equal to that of PZT-5A without the endcaps. The flextensional piezoactu-ator is fixed to a holder (not displayed in figure) by three points, perpendicular to the displacement to be measured. Thus the actuator is free to vibrate in directions 1 and 3.
3
THE MICHELSON INTERFEROMETER
A low cost Michelson interferometer is employed in the mea-surement of PFA displacements, as sketched in figure 5. The practical utilization of the interferometric procedure relies critically on the monocromaticity and coherence degree of the light source being used (Udd, 2006). A 50/50 beam split-ter divides a coherent laser beam into two equal components: a reference beam and a sensor beam directed towards the fixed and the moving mirrors, respectively. The reflected sen-sor beam re-enters the beam splitter, where it is directed to a photodetector. The reflected reference beam re-enters the beam splitter and it is also focused onto the photodetector. At the photodetector (a PIN photodiode), the two beams are recombined. As the sample is displaced longitudinally, the phase of the sensor beam changes relative to the reference beam, causing a fringe pattern movement.
When a time-varying voltage (the PFA drive voltage) is fed to the actuator, the sensor beam is phased modulated by the PFA displacements and the interferometric phase shift can be written as the superposition:
Φ(t) =φ0+φ(t), (1)
where
φ0= 4π
λr(t) (2)
is (in principle) the static phase shift, φ(t)is the dynamic phase shift between arms, andtis the time. The termr(t)
corresponds to any optical path variations in the reference
(a) (b)
(c) (d)
(e) (f)
Figure 2: Topology optimization procedure (Silva et al., 2003). (a) Initial domain; (b) Discretized domain; (c) Topology ob-tained; (d) Interpretation; (e) Verification; (f) Manufacturing.
arm of the interferometer provided by the mirror translation stage (see figure 5), andλis the light wavelength in vacuum. AsΦ(t)is a time-varying function, the instantaneous output voltage (or current),v(t), of the photodetector is proportional to the normalized optical intensityI/I0, whereI0is the laser intensity [W/m2
], and can be written generically as (Udd, 2006):
v(t) =A[1 +Vcos Φ(t)], (3)
where Ais a constant depending on the laser power, pho-todetector responsivity, etc, and V is called fringe pattern visibility(0< V <1). In practical bulk interferometers,V
(a)
(b)
Figure 3: Topology optimization results and the correspond-ing interpretation (Silva et al., 2003). (a) Maximum displace-ment at the centre of the cap; (b) Maximum displacedisplace-ment at the edge of the cap.
(a) (b)
Figure 4: Prototype of manufactured piezoelectric flexten-sional actuator. (a) Top view; (b) Lateral view.
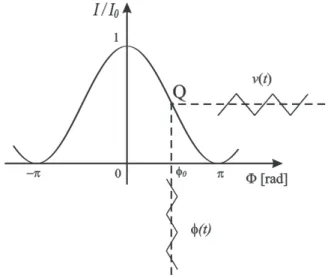
It can be seen from equation (3) that the interferometric out-put is a non-linear, sinusoidal function of the optical phase shift induced by the time-dependent signal. Hence, a direct linear measurement of signal phase from the photodetector output is not possible, unless for the case of a small phase modulation depth, which happens whenφ(t)is small. The following analysis will be made under this hypothesis. In figure 6 theI/I0transfer function (which is proportional to the detected voltagev) is sketched relative to total phase shift
Φ, for the caseV = 1, as well as the small modulation depth operation under phase quadrature regime (φ0 = π/2 rad).
By expanding equation (3) into a Taylor series (relative to the variableΦ) around the pointφ0, and selecting only the
linear term, the output signal has a bias component:
vbias=v(φ0) =A(1 +V cosφ0). (4)
Around point Q (see figure 6), which is associated to phase
φ0, the slope of the transfer function,dv/dΦ|φ0 , is given by
(−AV sinφ0). By moving the reference mirror at some very
Figure 5: Homodyne Michelson interferometer used to char-acterize the PFA.
Figure 6: Interferometric transfer function and small modula-tion depth operamodula-tion.
slow constant velocity,cosφ0andsinφ0can be made to vary from zero to unity during a measurement (but not simultane-ously). The maximum slope is obtained whenφ0=π/2rad, corresponding to optimum quadrature operation, where there is a quasi-linear relationship between phase shift and output signal. Under this condition the photodetected signal is:
v[Φ(t)] =vbias−AV φ(t), (5)
which is directly proportional to the instantaneous phase shift
φ(t). TheAV factor, in principle, is unknown, and conse-quently the interferometric technique requires a calibration procedure.
λ (Novikov et al., 2007). Consequently, it does not re-quire a calibration based on comparison with a measurement reference method. In the present work the absolute cali-bration procedure for the interferometric measurement can be done by selecting the a.c. component from the output signal in equation (3), vac(t), when the PFA is driven by
a small amplitude triangular waveform and under quadra-ture regime, as sketched in figure 6. This condition can be established by translating the “fixed mirror” position (by using the micrometric translation stage shown in figure 5)
r(t), until the peak-to-peak output signal becomes maximum (Clark, 1989). Asφ(t)is the corresponding a.c. phase shift, then
vac(t) =AVcos[π/2 +φ(t)] =−AV sinφ(t). (6)
It must be reminded that in a Michelson interferometer (Udd, 2006):
φ(t) =4π
λ ∆L(t), (7)
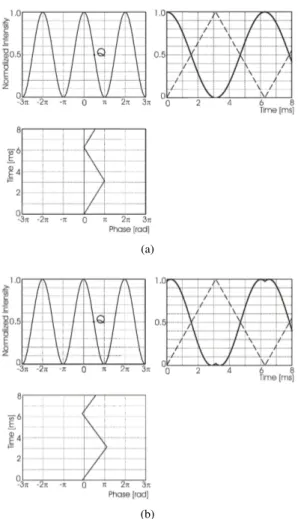
where∆L(t)is the instantaneous displacement of the PFA. Next (however, still under phase quadrature operation), the PFA drive voltage is increased untilφ(t) reaches the peak value corresponding toXpeak = π/2 rad. At this
condi-tion, the interferometric output signal becomes perfectly si-nusoidal, as observed the simulation shown in figure 7a). Right after this point (which should not be exceeded in the calibration process) the output signal will present a small dip around the peak, as it can be seen in figure 7b).
Based on the behaviour of the output interferometric signal, when the phase shift between their arms is a triangular wave-form, a calibration procedure can be established. The am-plitude of the output signal waveform must be gradually in-creased until the small dip around the peak is observed. Next, the waveform amplitude must be slightly decreased in order to obtain a pure sinusoidal output. Although this procedure has been regularly applied to determine the half-wave volt-age of an optical integrated modulator (Shi et al., 2000), it has not been used in interferometric applications yet.
For φ(t) adjusted exactly to Xpeak = π/2 rad, the a.c.
photodetected signal [equation (6)] reaches the maximum:
Vmax =−AV sinXpeak, in whichVmaxcan be
experimen-tally measured by acquiring the detected signal using an os-cilloscope. By following this procedure the unknownAV
can be determined. The voltageVmaxconstitutes the
inter-ferometer calibration factor and need to be measured only once. Consequently, onceVmaxhas been measured, and
un-der small modulation depth condition, equation (6) can also be written as:
vac(t) =Vmaxsinφ(t)∼=Vmaxφ(t) =Vmax
4π λ∆L(t),
(8) where equation (7) was used. Finally, the PFA peak displace-ment can be determined from equation (8) by using
∆Lpeak=
λ 4π
vpeak
Vmax
, (9)
where vpeak is the peak voltage value ofvac(t) under the
Xpeak < π/2 rad condition (in other words, under small
phase modulation index as shown in figure 6). According to equation (9), from now on all that is needed to measure dis-placements is the peak value of the a.c. output signal, while the interferometer operates under phase quadrature. How-ever, if this last condition (φ0 = π/2 rad) is not satisfied
due to experimental difficulties in adjusting the translation stage because of fading, it can be used a motorized trans-lation stage coupled to the reference mirror and driven by a sawtooth waveform voltage. This drive voltage should be faster than typical fading frequencies (> 10 Hz) with suffi-ciently high amplitude so that the system is forced to pass through the phase quadrature point. When this occurs, the a.c. peak-to peak output signal necessarily goes to a maxi-mum and remains contant during a time interval sufficiently long to allow a reliable data acquisition (Clark, 1989).
4
EXPERIMENTAL RESULTS
The interferometric setup sketched in figure 5 was built using a 5 mW He-Ne laser (Newport,λ= 632.8nm) and a 50/50 ratio beam-splitter. The overall experimental setup is shown in figure 8.
The PIN photodiode (Siemens, BPX65) output was amplified and the signal was digitized by an oscilloscope (Tektronix TDS2022) with 8 bits vertical resolution. The sampling rate was 1 MHz and 2500 points were digitized for each wave-form. The acquired signals were windowed with a Hamming window and the harmonic magnitudes were measured after an FFT routine in Matlab. As the maximum signal harmonics were around 1500 Hz and the higher harmonics have lower magnitudes, it was not necessary to use an anti-aliasing fil-ter. Accordingly to Silva et al. (2003), and Silva and Kikuchi (1999), these PFAs are originally designed to be used in static or quasi-static mode (that is, below its first resonance fre-quency), thus the displacements and amplifications are de-termined by considering low drive voltage frequencies.
(a)
(b)
Figure 7: Principle of the calibration procedure for the interfer-ometer under small phase modulation depth operation. The input signal (lower left) is the phase shift (proportional to PFA drive voltage), biased at quadrature condition (point Q on the transfer curve, upper left), and the output signal (upper right) is the photodetected voltage. (a) Simulated output for drive voltage corresponding toXpeak=π/2rad; (b) ForXpeakright afterπ/2rad.
glass plate, was bonded to the actuator surface with epoxy resin (see figure 4). As the epoxy stiffness is of the order of 1010
N/m2
, the effect of an additional oscillator, con-stituted by the mirror and epoxy resin, is minimized (Silva et al., 2003). No additional resonance frequencies were ex-perimentally observed by bonding this thin mirror to the PFA.
A practical requirement of the optical interferometry is the mechanical stability of all components of the measuring sys-tem. Free-space interferometry based on air propagation of optical beams is affected by alterations in the air environmen-tal conditions. When air pressure, temperature or humidity change, the air refractive index will also change and so the speed of light and the light wavelength. Ideally, oncer(t)
Figure 8: The overall experimental setup: bulk Michelson-type interferometer.
is adjusted so thatφ0 = π/2 rad, the phaseφ0 should
re-main constant. However, in practice it suffers from fading, that is, it can fluctuate in a wide range and during brief pe-riods of time due to random drifts, induced by environment perturbations (Marçal et al., 2007; Udd, 2006). Because of this, prior to measurements a 2-hour warm-up time was al-lowed for the system to reduce the phase drift. In addition, measurements were carried out quickly to minimize the in-fluence of any temperature change on the system, and the assembly was mounted over a granite optical table in order to damp spurious mechanical vibrations.
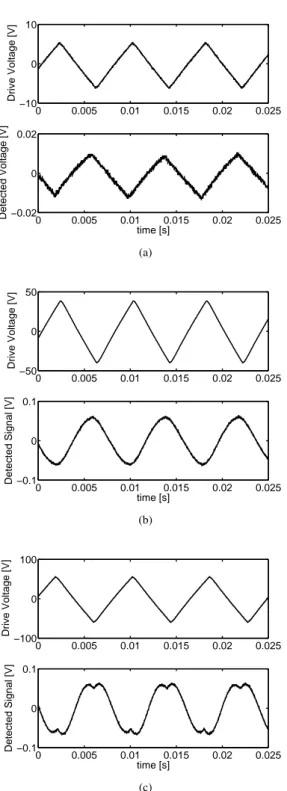
Initially, for calibrating the interferometer, the PFA was driven by triangular waveforms with amplitudes ranging from 2.5 to 58 Vpeak at 125 Hz. This frequency is high
enough to avoid the low frequency environmental vibrations but low enough to be considered in quasi-static regime. Ex-amples of digitized photodetected waveforms are shown in figure 9. In figure 9a) the interferometer is operating under small modulation depth. When the drive voltage reaches 39 Vpeak the a.c. output signal becomes fairly sinusoidal [see
figure 9b)], withVmax = 64 mVpeak. Henceforth, the
dis-placements can be measured by applying equation (9). As shown in figure 9c), when the drive voltage is 58 Vpeak, a
dip is present in the waveform.
Additionally, in order to increase the accuracy in the mea-surement of the calibration factorVmax, it is proposed to
evaluate the harmonic distortion in the photodetected signal, for both conditionsXpeak=π/2rad andφ0=π/2rad. In
0 0.005 0.01 0.015 0.02 0.025 −10
0 10
Drive Voltage [V]
0 0.005 0.01 0.015 0.02 0.025 −0.02
0 0.02
time [s]
Detected Voltage [V]
(a)
0 0.005 0.01 0.015 0.02 0.025 −50
0 50
Drive Voltage [V]
0 0.005 0.01 0.015 0.02 0.025 −0.1
0 0.1
time [s]
Detected Signal [V]
(b)
0 0.005 0.01 0.015 0.02 0.025 −100
0 100
Drive Voltage [V]
0 0.005 0.01 0.015 0.02 0.025 −0.1
0 0.1
time [s]
Detected Signal [V]
(c)
Figure 9: Photodetected signals (a.c. coupling) used for cal-ibrating the interferometric results. In all the cases the upper signal corresponds to PFA drive voltage and the lower one is the photodetected signal. (a) For triangular waveform, 5.8 Vpeakdrive voltage at 125 Hz; (b) For 39 Vpeakat 125 Hz; (c) For 58 Vpeakat 125 Hz.
0 500 1000 1500
−60 −50 −40 −30 −20 −10 0
frequency [Hz]
Magnitude [dB]
Figure 10: Spectrum of the photodetected signal when the PFA is driven with 39 Vpeakat 125 Hz and under quadrature regime.
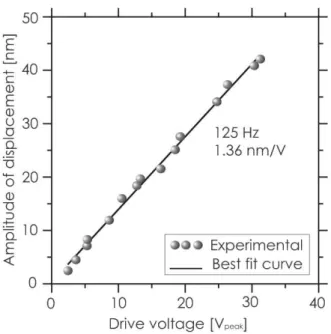
Figure 11 shows the displacement amplitudes at the cap cen-ter of the composite actuator for different triangular drive voltages at the fundamental frequency of 125 Hz. The curve presents a linear response over the displacement range con-sidered, and the least squares fit is shown with a 0.8 nm stan-dard deviation. The slope of the curve is 1.36 nm/Vpeak.
Thus, the PFA calibration factor at 125 Hz is equal to 1.36 nm/V. The displacement amplification rate is obtained for each frequency by dividing the displacement generated by the actuator and the displacement generated by the piezoce-ramic in the 1-direction(d31)and 3-direction(d33),
consid-ering the same drive voltage. By using the results obtained in Marçal et al. (2007), this amplification can also be measured.
Piezoceramic materials such as PZT-5A have its dielectric, piezoelectric and mechanical properties generally given by manufacturer manuals with up to 5% difference from man-ufacturer to manman-ufacturer. However, if these values are actually measured, deviations up to 20% can be obtained. Therefore, it is important to determine experimentally the strain coefficients of piezoceramics. Based on the work of Marçal et al. (2007), piezoceramic transducer relevant data were measured by using a commercial MTI-2000 fotonic sensorTM (MTI-2020R, 90 kHz frequency response range, with 101 and 1457 nm linear ranges, and 30 and 250 nm res-olutions, in its 1- and 2-operation ranges, respectively) oper-ating with a 1 Hz triangular waveform. The following values were obtained for the piezoelectric coefficients:d31=−133
pm/V andd33= 287pm/V.
Figure 11: Displacement amplitudes as a function of the drive voltage (triangular waveform at 125 Hz) applied to the PFA. The least-square fit to this plot is also shown(y = 1.36x+
0.30).
related to the length mode shape, occurs at 46.4 kHz. So, roughly speaking, the piezoceramic behaves linearly up to this frequency, and thed31 andd33 coefficients (measured
at 1 Hz) should not vary considerably with frequency in this range. Because of this, in the present work, it will be as-sumed that values ofd31 and d33 at 1 Hz and 125 Hz
re-main approximately constant. Next, the slopes of the PFA displacement curves obtained with MTI-2000 and ANSYS were determined and displayed in table 1, as well as that ob-tained from figure 11. By using the above values ofd31and
d33 coefficients, the amplification measurements (in direc-tions 1 and 3) are obtained by the interferometric, MTI-2000 and ANSYS methods.
As can be seen from table 1, although the amplification re-sults measured with the interferometer and the MTI-2000 are close (1% difference), the amplification obtained from ANSYS is very different (39% higher relative to interfer-ometer results). This is not a rule because ANSYS always provided excellent results when applied to PFA with closed endcap structure (Silva et al., 2003), like those shown in fig-ure 3. In closed endcap actuators the displacement transmis-sion from piezoceramic to the flexible structure involves two types of actions: a pressure mechanism between the ends of the piezoceramic and the flexible structure and, possibly, a shear mechanism between the upper and lower piezoceram-ics electrodes and the flexible structure. The presence of the epoxy layer between the piezoceramic and the flexible struc-ture, the existence of inhomogeneities in bonding thickness
Table 1: PFA no-load amplification measurement.
Method Slope Amplification Amplification (nm/V) 33 31
This work 1.36 9.50 2.04
MTI-2000 1.35 9.40 2.03
ANSYS 1.90 13.2 2.86
generated by surface roughness as well as the appearance of local meniscus and lacks of adhesive, may introduce some non-linear behavior in this displacement transmission mech-anism (Ochoa et al., 2007). The pressure mechmech-anism tends to be less affected by the epoxy layer non-linear behavior than the shear mechanism. In summary, the closed structure is not as significantly affected as the open ended PFA (as the one used in this work) by the epoxy layer non-linear behavior.
A fast response time is another important criterion for the PFA and it can be defined as the time to achieve the quick and precise response of the actuator without overshoot and ringing. The mechanical resonance of the system limits the practical actuating range. When arbitrary signals are applied to the PFA, as in practical micrometric or nanometric posi-tioners, higher resonance frequencies can be excited, and the linearity between control signal and the corresponding dis-placement is lost. Positioning actuators should be used only in the linear range of their spectra, well below any resonance frequency. Such a phenomenon is usually known as track-ing error (Bergander et al., 2003; Marçal et al., 2005). This is why it is important to know the piezoactuator frequency response, in order to determine (and avoid) its resonance fre-quencies.
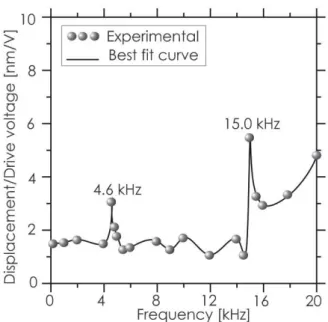
Figure 12 shows the experimental frequency response of the PFA measured using interferometer, in terms of the ampli-tude displacement normalized by the input voltage, (nm/V). The gain is fairly constant up to 4 kHz, equal to 1.4 nm/V ap-proximately. The first two resonance frequencies are found at 4.6 and 15 kHz (actually there are a large number of higher resonance frequencies, but they are not shown in figure), far from the PFA typical operation band. It should be empha-sized that simulations with ANSYS were not able to detect these two resonances; the first previewed resonance occurred at 20 kHz. Again, this probably happens due to difficulties in modelling the open ended PFA and the non-linear properties of the epoxy resin.
5
CONCLUSIONS
deter-Figure 12: Interferometric transfer function and small modu-lation depth operation.
mined by the measurement of nanometric displacements us-ing a low cost homodyne Michelson interferometer. In the theoretical analysis the hypothesis ofV = 1and small mod-ulation depth operation were considered. This measurement method is very reliable once the information is based on light phase modulation, rather than light intensity as happens for the MTI-2000 optical fiber sensor. This makes the inter-ferometer calibration procedure independent of any external standard, only depending on the knowledge of light wave-length. As the best resolution of MTI-2000 is 30 nm, the PFA was excited with amplitudes as high as 500 Vpeakat the
fre-quency of 1 Hz. On the other side, by using the interferome-ter, the PFA was excited with amplitudes below 58.0 Vpeak,
measuring the calibration factor of 1.36 nm/V with standard deviation of only 0.8 nm. In addition, unlike the light in-tensity modulation, the phase modulation provides excellent rejection of background light.
Together with the MTI-2000 results (Marçal et al., 2007), it can be concluded that the PFA performance was linear up to 200 Vpeak, with displacement amplification of 9.5
(associ-ated tod33) and 2.04 (associated tod31) in 3 and 1 directions, respectively. The PFA has a reasonably flat response below 4 kHz, where the gain is approximately constant, and the first significant resonance occurs at 4.6 kHz. Consequently, a 220 nm displacement can be obtained when 150 Vpeakvoltage is
applied to this PFA. In conclusion, the PFA designed by us-ing topology optimization method satisfied the required spec-ification to implement optical phase controllers to be used, in closed loop interferometer applications in future works.
ACKNOWLEDGEMENTS
The authors would like to thank the Brazilian sponsor agen-cies FAPESP and CAPES.
REFERENCES
Bergander, A., Driesen, W., Varidel, T. and Breguet, J. M. (2003). Development in miniature manipulators for application in biology and nanotechnologies, Proc. of the Microrobotics for Biomanipulation Workshop, IEEE/RSJ Int. Conf. on Intelligent Robots and Systems (IROS 03), Las Vegas, USA, pp. 11–35.
Bitou, Y. (2009). High-accuracy displacement metrology and control using a dual fabry-perot cavity with opti-cal frequency comb generator, Precision Engineering
33(2): 187–193.
Bouchilloux, P., Claeyssen, F. and LeLetty, R. (2004). Am-plified piezoelectric actuators: From aerospace to un-derwater applications,Proc. of the SPIE, Smart Struc-tures and Materials 2004: Industrial and Commer-cial Applications of Smart Structures Technologies, San Diego, USA, pp. 143–154.
Carbonari, R. C., Silva, E. C. N. and Nishiwaki, S. (2007). Optimum placement of material in piezoactuator de-sign,Smart Materials and Structures16(1): 207–220.
Clark, N. H. (1989). An interferometric method to measure oscillatory displacements,Metrologia26(2): 127–133.
De Abreu, G. L. C. M., Ribeiro, J. F. and Steffen Jr., V. (2004). Finite element modelling of a plate with lo-calized piezoelectric sensors and actuators,Journal of the Brazilian Society of Mechanical Sciences and Engi-neeringXXVI(2): 117–128.
Deferrari, H. A., Darby, R. A. and Andrews, F. A. (1967). Vi-brational displacement and mode-shape measurement by a laser interferometer,The Journal of the Acoustical Society of America42(5): 982–990.
Dogan, A., Fernandez, J. F., Uchino, K. and Newnham, R. E. (1996). The cymball electromechanical actuator,Proc. of the Tenth IEEE International Symposium on Appli-cations of Ferroelectrics, ISAF 96, New Jersey, USA, pp. 213–216.
Jackson, D. A., Priest, R., Dandridge, A. and Tveten, A. B. (1980). Elimination of drift in a single-mode optical fiber interferometer using a piezoelectrically stretched coiled fiber,Applied Optics19(17): 2923–2929.
2001 Genetic and Evolutionary Computation Confer-ence, GECCO-2001, San Francisco, USA, pp. 1085– 1089.
Marçal, L. A. P., Leão, J. V. F., Nader, G., Higuti, R. T., Kitano, C. and Silva, E. C. N. (2007). Analysis of linearity and frequency response of a novel piezoelec-tric actuator using a homodyne interferometer and the
j1−j4method,IEEE Transactions on Instrumentation and Measurement56(3): 954–961.
Marçal, L. A. P., Leão, J. V. F., Nader, G., Silva, E. C. N., Higuti, R. T. and Kitano, C. (2005). Dynamic analy-sis of a new piezoelectric flextensional actuator using thej1−j4optical interferometric method,Proc. of Rio
2005 Internoise Environmental and Control – The 2005 Congress and Exposition on Noise Control Engineer-ing, Rio de Janeiro, Brazil, pp. 1–10.
Newnham, R. E., Dogan, A., Xu, Q. C., Onitsuka, K., Tressler, J. and Yoshikawa, S. (1993). Flextensional moonie actuators, Proc. of the IEEE 1993 Ultrasonic Symposium, Baltimore, USA, pp. 509–513.
Niezrecki, C., Brei, D., Balakrishna, S. and Moskalik, A. (2001). Piezoelectric actuation: State of the art, The Shock and Vibration Digest33: 269–280.
Novikov, Y. A., Ozerin, Y. V., Rakov, A. V. and Todua, P. A. (2007). Method for linear measurement in the nanometre range, Measurement Science and Technol-ogy,18(2): 367–474.
Ochoa, P., Pons, J. L., Villegas, M. and Fernandez, J. F. (2007). Effect of bonding layer on the electromechan-ical response of the cymbal metal-ceramic piezocom-posite, J. European Ceramic Society 27(2–3): 1143– 1149.
Pisani, M. (2009). A homodyne Michelson interferometer with sub-picometer resolution, Measurement Science and Technology20(8): 1–6.
Putra, A. S., Huang, S., Tan, K. K., Panda, S. K. and Lee, T. H. (2007). Design, modelling, and control of piezo-electric actuators for intracytoplasmatic sperm injec-tion, IEEE Transactions on Control Systems Technol-ogy15(5): 875–890.
Shi, Y., Lin, W., Olson, D. J., Bechtel, J., Zhang, H., Steier, W. H., Zhang, C. and Dalton, L. R. (2000). Electro-optic polymer modulators with 0.8 v half-wave voltage,
Applied Physics Letters77(1): 1–3.
Silva, E. C. N. and Kikuchi, N. (1999). Design of piezo-electric transducers using topology optimization,Smart Materials and Structures8(3): 350–364.
Silva, E. C. N. and Kikuchi, N. (2000). Topology opti-mization design of flextensional actuators,IEEE Trans-actions on Ultrasonic, Ferroelectrics, and Frequency Control47(3): 597–605.
Silva, E. C. N., Nader, G., Shirahige, A. B. and Adamowski, J. C. (2003). Characterization of novel flextensional actuators designed by using topology optimization method, Journal of Intelligent Material Systems and Structures14(4–5): 297–308.
Sudarshanam, V. S. and Srinivasan, K. (1989). Linear read-out of dynamic phase change in a fiber-optic homodyne interferometer,Optics Letters14(2): 140–142.
Topcu, S., Chassagne, L., Haddad, D. and Alayli, Y. (2003). Heterodyne interferometric technique for displacement control at the nanometric scale,Review of Scientific In-struments74(11): 4876–4880.
Uchino, K. (2000). Ferroelectrics Devices, Marcel Dekker, New York.
Udd, E. (2006). Fiber Optic Sensors – An Introduction for Engineers and Scientists, John Wiley & Sons, New York.
Wylde, J. and Hubbard, T. J. (1999). Measurement of MEMS displacements and frequencies using laser interferom-eter, Proc. of the 1999 IEEE Canadian Conference on Electrical and Computer Engineering, Edmonton, Canada, pp. 1680–1685.
Xie, F., Chen, X. and Zhang, L. (2009). High stability inter-leaved fiber Michelson interferometer for on-line preci-sion displacement measurements,Optics and Lasers in Engineering47(11): 1301–1306.