Article
J. Braz. Chem. Soc., Vol. 25, No. 9, 1621-1629, 2014. Printed in Brazil - ©2014 Sociedade Brasileira de Química 0103 - 5053 $6.00+0.00
A
*e-mail: [email protected]
Determination of Sn
2+in Lyophilized Radiopharmaceuticals by Voltammetry,
Using Hydrochloric Acid as Electrolyte
Adilio S. Dadda,*,a,b Ariane C. Teixeira,a Paula K. Feltes,a,b Maria M. Campos,a,c
Carlos E. Leitea,d and Cristina M. Moriguchi-Jeckelb
aInstituto de Toxicologia e Farmacologia, bFaculdade de Farmácia and cFaculdade de Odontologia, Pontifícia Universidade Católica do Rio Grande do Sul, 90619-900 Porto Alegre-RS, Brazil
dPrograma de Pós-Graduação em Medicina: Ciências Médicas, Universidade Federal do Rio Grande do Sul, 90035-004 Porto Alegre-RS, Brazil
O objetivo do estudo foi desenvolver e validar um método de rotina para a determinação específica de Sn2+ em kits de radiofármacos 2-metóxi isobutil isonitrila (MIBI). Para a análise,
foi utilizado o equipamento analisador voltamétrico. Experimentos de triagem mostraram que o eletrólito HCl 1 mol L-1 apresentou os melhores resultados entre todas as soluções testadas.
Experimentos de estabilidade mostraram declínio gradual na corrente de Sn2+ no MIBI, e 23 dias
depois da preparação da solução, a corrente desapareceu. Para confirmar a seletividade de técnica utilizando o HCl 1 mol L-1, induzimos a oxidação do SnCl
2, resultando em um declínio proporcional
da corrente no voltamograma. A confiabilidade do método foi observada com os valores de precisão e exatidão intra- e inter-ensaios, e com a robustez. Nós proporcionamos novos dados quanto a detecção seletiva de Sn2+ na presença de sua forma oxidada em kits de radiofármacos, utilizando
HCl 1 mol L-1 como eletrólito.
This work aimed to develop and validate a routine method for the specific determination of Sn2+
2-methoxy isobutyl isonitrile (MIBI) radiopharmaceutical kits. A voltammetric electrochemical technique was used for the analysis. Screening experiments revealed that 1 mol L-1 HCl electrolyte
showed the best results, among all the tested solutions. Stability experiments showed a gradual decline in the current of MIBI, and 23 days after the preparation of the solution, the current corresponding to stannous ion disappeared. To confirm the selectivity of the technique using HCl, we have induced oxidation of SnCl2 that resulted in a proportional decline of the current
in the voltammogram. The reliability of the method was observed with the values of precision and accuracy intra- and inter-assay, and also its robustness. We provide novel evidence on the selective detection of Sn2+ in the presence of its oxidized form in radiopharmaceutical kits, by
using 1 mol L-1 HCl as electrolyte.
Keywords: stannous ion, radiopharmaceutical kits, selective electroanalysis, electrolyte, voltammetry
Introduction
Radiopharmaceutical kits are used in more than
90% of all procedures in nuclear medicine diagnosis.1-3
2-Methoxy isobutyl isonitrile (MIBI) is extensively used in clinics, especially to evaluate myocardial function, besides the application in differential diagnosis of some
cancer types.4-7 Other isonitrile-based compounds have
been used beforehand, but they presented low stability,
having their application discontinued.8 Subsequently, the
radiopharmaceutical MIBI proved to be greatly efficacious, overcoming the limitations of previously developed
compounds with the same diagnostic purposes.9
The stannous ion (Sn2+), used mainly in the form of
SnCl2 salt, is added to lyophilized radiopharmaceutical
kits to allow the complexation to the radioisotope. It is mainly employed in order to promote the reduction
of pertechnetate ion (TcO4)– for the preparation of
99mTc-radiopharmaceutical kits.10,11 For that reason, quality
are fundamental in the production of radiopharmaceutical kits. In fact, Sn2+ might be affected by several factors,
such as oxygen and light exposure, generating its oxidized form stannic ion (Sn4+). For instance, dental formulations
containing SnF2 are highly unstable in aqueous solutions,
since Sn2+ can be easily oxidized to Sn4+, compromising the
physical and chemical properties of the product.12
The implementation of quality control procedures in radiopharmacy is extremely important to ensure that unsuitable products will not be used in patients. It is well known that either lacking or excess of Sn2+ in lyophilized
formulations might affect the radiochemical purity, as well as the quality of images. Most analytical methods for the determination of tin, such as atomic absorption spectrometry, fluorimetry, spectrometry, or potentiometry do not allow distinguishing between Sn2+ and Sn4+ in solution.13-17 At
the present, there are a few techniques available for the selective determination of Sn2+, including titrimetric analysis
(redox-titration) and voltammetry. The low sensitivity of titrimetric methods for the concentrations of tin used in radiopharmaceutical kits impairs its precise and accurate measurement.13 Thus, especially for radiopharmaceutical kits
with low Sn2+ contents, the only reliable method to properly
determine Sn2+ is voltammetry.18
The peaks obtained in the latter technique give qualitative information through the value of the potential peak E (V), while the quantitative information is provided by the current peak i (A), in the presence of the selected electrolyte.19,20 The determination of Sn2+ by voltammetry
has been performed before using electrolytes containing complex mixtures of salts, buffers, acids and bases, such as 4-(2-hydroxyethyl)-1-piperazineethanesulfonic
acid (HEPES), piperazine-N,N’-bis(2-ethanesulfonic
acid) (PIPES), hydrochloric acid (HCl), citric acid (C6H8O7), potassium chloride (KCl) and sodium hydroxide
(NaOH).21,22
The aim of this study was to validate a simple method for determination of Sn2+ in MIBI radiopharmaceutical kits
to furnish a reliable routine method for quality control in radiopharmacy.
Materials and Methods
Apparatus and electrochemical technique
Equipment 757 VA Computrace (Metrohm) was used with a three electrode cell for differential pulse polarography technique: multimode mercury working electrode (MME), platinum auxiliary electrode (Pt) and electrode silver/ silver chloride (Ag/AgCl) reference containing potassium chloride (3 mol L-1 KCl) electrolyte solution.
Reagents and solutions
Anhydrous stannous chloride (SnCl2) (Sigma Aldrich,
Switzerland); stannic chloride pentahydrate (SnCl4.5H2O)
(Sigma-Aldrich, USA); MIBI radiopharmaceutical cold
kit (tetrakis (2-methoxy isobutyl isonitrile) copper(I)
tetrafluoroborate ([Cu(MIBI)4]BF4) (1 mg), anhydrous
stannous chloride (0.084 mg), sodium citrate, L-cysteine hydrochloride monohydrate and mannitol (Radiopharmacus Group, Porto Alegre, Brazil); HEPES (Sigma-Aldrich, USA); nitric acid suprapur (HNO3) (Merck, Germany); KCl
(Merck); NaOH (Synth, Brazil); disodium ethylenediamine tetraacetic acid (EDTA-Na2) (Quimex, Brazil); potassium
nitrate (KNO3) (Nuclear,Brazil); PIPES (Sigma Aldrich);
sodium fluoride (NaF) (Merck); sodium nitrate (NaNO3)
(Dinâmica, Brazil); citric acid (Merck); HCl P. A. (Merck); hydrogen peroxide suprapur (H2O2) (Merck); and copper
metal standard solution (Cu) (Fluka
).
General procedures
For initial screening of a series of electrolytes, we tested the current and reproducibility of standard solutions
at the concentration of 50 mg L-1. The sample used for
analysis was the radiopharmaceutical MIBI containing
approximately 0.052 mg of Sn2+, corresponding to
17.53 mg L-1, after suspension of lyophilized kit with 3 mL
of distilled and deionized water (dd-water). The standard solution of SnCl2 used for validation assays was prepared at
the same concentration present in the radiopharmaceutical
kit (17 mg L-1), whilst the standard solution of SnCl
4
pentahydrate, due to the lower sensibility of the assay for Sn4+, was prepared in a higher concentration (50 mg L-1).
The samples and the standards were dissolved in oxygen-free dd-water by nitrogen saturation to avoid oxidation. HEPES (1 mol L-1 HEPES, 1 mol L-1 NaF, 1 mol L-1 NaNO
3,
and H2O), 1 mol L-1 KCl, 1 mol L-1 NaOH, 0.1 mol L-1
EDTA, 0.1 mol L-1 KNO
3, PIPES (1 mol L
-1 PIPES,
1 mol L-1 NaF, 1 mol L-1 NaNO
3, and H2O), HCl plus citric
acid (0.2 mol L-1) and HCl (0.2 mol L-1 and 1 mol L-1)
electrolytes were tested. In the protocols to induce the oxidation of Sn2+, 200 µL of 30% H
2O2 were used.
The use of the electrolytes 1 mol L-1 PIPES, 1 mol L-1
NaF, 1 mol L-1 NaNO
3, and H2O were prepared according
to the newsletter of Metrohm (CH4-0381-042002), which was composed of 11 mL of deionized water, 7 mL of NaF,
1 mL of 1 mol L-1 NaNO
3, and 1 mL of 1 mol L-1 PIPES
buffer. The electrolyte 1 mol L-1 HEPES was prepared
citric acid in the vessel, with a final concentration of
0.2 mol L-1. A volume of 10 mL of the electrolytes
PIPES, HEPES, 1 mol L-1 KCl, 0.1 mol L-1 EDTA,
1 mol L-1 NaOH, 0.1 mol L-1 KNO
3, 0.2 mol L -1 HCl,
and 1 mol L-1 HCl were added in the vessel during each
analysis. The electrolytes were initially tested with a Sn2+
concentration of 50 mg L-1 for assessing the current and
reproducibility. The analysis was performed in triplicate in order to determine the most suitable conditions concerning deposition time, concentration, and pH of the electrolyte. Those showing stable and reproducible currents were further tested with a Sn2+ concentration of 17 mg L-1.
The differential pulse voltammetric analysis was performed under the following conditions: –0.2 V deposition time, 90 s pulse time, 10 s equilibration time, –0.2 V starting potential, –0.55 V end potential, 0.004 voltage step, 0.050 V pulse amplitude, 0.04 s pulse time, and 0.1 s voltage step time. These values are defined by the manufacturer. To assess the possible interference of
Cu2+, we have used a potential range varying from 0 to
–0.55 V. Initially, 10 mL of electrolyte were added to the polarographic vessel, and a flow of 1 kgf cm-2 of nitrogen
gas was applied for 5 min. The method of manual standard addition for quantification was adopted. The calibration curve was made by blank determination (electrolyte) and five successive additions of 200 µL (10 mg L-1 of Sn2+)
standard solution into the vessel, in order to record the polarographic concentrations of 0, 10, 20, 30, 40 and 50 mg L-1. For determination of Sn2+ in the MIBI kits,
the samples were resuspended with 3 mL of dd-water and 200 µL of each sample were added into the vessel to obtain the initial voltammogram. Subsequently, two successive additions of 200 µL of standard (17.0 mg L-1)
were carried out. The analyses were performed in triplicate, and 3 separated samples of lyophilized compound were used. The results were expressed as mean ± standard deviation (SD).
Polarographic method validation
The polarographic method was quantitatively evaluated in terms of sensitivity, specificity, precision, accuracy, linearity, recovery and robustness.
Results
Electrolytes for determination of Sn2+
The results for HEPES were not satisfactory, as the electrolyte caused interference in the baseline, and showed no peak in the voltammogram at the potential range
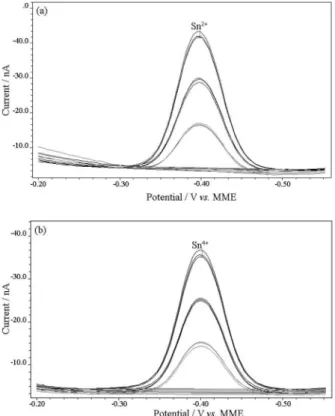
corresponding to Sn2+. For 1 mol L-1 KCl, the same potential
was obtained for SnCl2 and SnCl4, according to assessment
at 50 mg L-1, following separate readings, clearly showing
that is not possible to separate Sn2+ from Sn4+ (Figure 1).
The electrolytes 0.1 mol L-1 EDTA and 1 mol L-1
NaOH, using Sn2+ at 50 mg L-1, generated erroneous
results, due to the decay of the current between the standard additions, as it can be observed in Figures 2a and 2b, respectively.
The recovery with 0.1 mol L-1 KNO
3 and 50 mg L-1 Sn2+
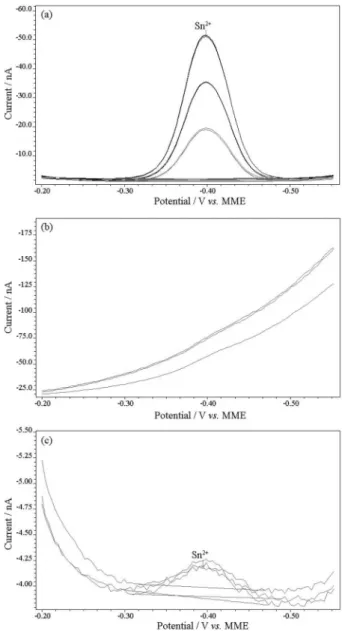
was less than 50%, being also unsatisfactory (Figure 3). For 1 mol L-1PIPES and a concentration of 17 mg L-1
of Sn2+, the obtained result was approximately 13 mg L-1,
giving a recovery of 76%. Similarly, the use of HCl with citric acid provided a reading of approximately 20 mg L-1,
for a standard Sn2+ solution of 17 mg L-1 (recovery of
118%). A decreased recovery was observed by employing
0.2 mol L-1 HCl as electrolyte, showing a reading of
12 mg L-1 (71%) (Figures 4a-c, respectively).
Considering that 1 mol L-1 HCl electrolyte showed the
best reproducibility for determining Sn2+ when compared
to the other solutions, according to assessment of either
concentrations of 50 or 17 mg L-1 (Figure 5), this was
chosen to proceed validation.
Figure 1. Voltammogram for Sn2+ and Sn4+ determination at 1 mol L-1
KCl: (a) Sn2+; (b) Sn4+. The concentration of the elements used in the
polarographic cell in each analysis was 50 mg L-1. The detection of Sn2+
Figure 2. Voltammograms for Sn2+ determinations in EDTA and NaOH: (a)
0.1 mol L-1 EDTA; (b) 1 mol L-1 NaOH. The concentration for Sn2+ used
in the polarographic cell in each analysis was 50 mg L-1. Sn2+ standards
were also added at 50 mg L-1.
Figure 4. Voltammograms for Sn2+ determination in three different
electrolytes: (a) 1 mol L-1 PIPES; (b) 0.2 mol L-1 HCl with citric acid;
(c) 0.2 mol L-1 HCl. The concentration used in the polarographic cell in
each analysis was 17 mg L-1.
Figure 5. Voltammogram for Sn2+ at 1 mol L-1 HCl. The concentration
used in the polarographic cell was 17 mg L-1.
Figure 3. Voltammogram for Sn2+ determinations at 0.1 mol L-1 KNO 3.
The concentration used in the polarographic cell was 50 mg L-1.
Technique validation for determining Sn2+ for differential pulse polarography using 1 mol L-1 HCl as electrolyte
To observe the selectivity of the electrolyte in the solution of SnCl2, a reading using freshly prepared SnCl2 standard
was performed. The fast oxidation of Sn2+ was induced by
adding H2O2, and incubating the solution in water bath at
37 °C for 5 min.13 No current corresponding to Sn2+ was
observed. However, despite the disappearance of the Sn2+
current, we observed an increase in the baseline current. This fact seems to be due to oxidation of the working electrode mercury drop by the action of H2O2 that could be hiding the
Sn2+ current. To exclude this possibility, another Sn2+ standard
was prepared and incubated for 24 h in water bath for 37 °C, without adding H2O2. Figures 6a-c, respectively, show the
disappearance of the current of Sn2+ without any change of
baseline current following this procedure.
These results show that oxidation of Sn2+ and the
formation of Sn4+ do not affect the analysis, at the tested
conditions.
Sensibility, specificity and selectivity
The limit of detection was determined by adding
concentrations of 1 mg L-1 of the Sn2+ standard. The
detection limit of this method was 3 mg L-1. The limit of
quantification was the lowest analyzed amount, which can be measured with defined precision and accuracy and reproducible with a coefficient of variation (CV) up to 20% and accuracy of 80-120%. The limit of quantification values
was 4.57 ± 0.49 mg L-1, with CV of 1.06 % and accuracy
of 114.21%.
For determination of specificity, the excipient of MIBI was tested to assess the interference with voltammetric method. The ability of the method to detect Sn2+, without
interference of excipients in its potential, is depicted in Figure 7.
To assess the interference of copper in the potential
of Sn2+, we obtained voltammograms with (i) Cu2+
standard, (ii) Cu2+ standard with Sn2+ standard and
(iii) radiopharmaceutical MIBI kit under normal conditions, as demonstrated in Figures 8a-c, respectively.
The obtained peaks of copper were detected at a
different potential than Sn2+ (–0.13 V), and all assay
tests were free of interference from this element during determination of Sn2+.
Precision and accuracy (recovery) intra- and inter-assay The intra- and inter-day precision and accuracy data are shown in Table 2. Precision was expressed as the percentage of coefficient of variation (CV), and
Table 1. Decay of the current of Sn2+ 1, 2, 13 and 23 days after preparation
of solution for reading
time / day Current (triplicate) / nA
–11.84
1 –11.75
–11.71
–9.71
2 –9.61
–9.59
–7.90
13 –8.30
–8.14
n.d.
23 n.d.
n.d.
n.d.: not determined.
Figure 6. Voltammograms for Sn2+ at different conditions in 1 mol L-1
HCl: (a) 1 mol L-1 HCl; (b) Sn2+ oxidized with H
2O2 addition and water
bath in 1 mol L-1 HCl; (c) Sn2+ oxidized in water bath in 1 mol L-1 HCl.
Figure 7. Voltammogram showing the specificity of the analysis for Sn2+
at 1 mol L-1 HCl. For this parameter, MIBI radiopharmaceutical kits and
excipients without Sn2+ were analyzed.
Figure 8. Voltammograms for Cu2+, Sn2+ and MIBI radiopharmaceutical at
1 mol L-1 HCl. (a) Cu2+; (b) Cu2+ and Sn2+; (c) MIBI radiopharmaceutical.
The concentration used in the polarographic cell was 5 mg for Cu2+ and
17 mg for Sn2+. The potential readings were initiated at 0.0 V to permit
observing the peak for Cu2+.
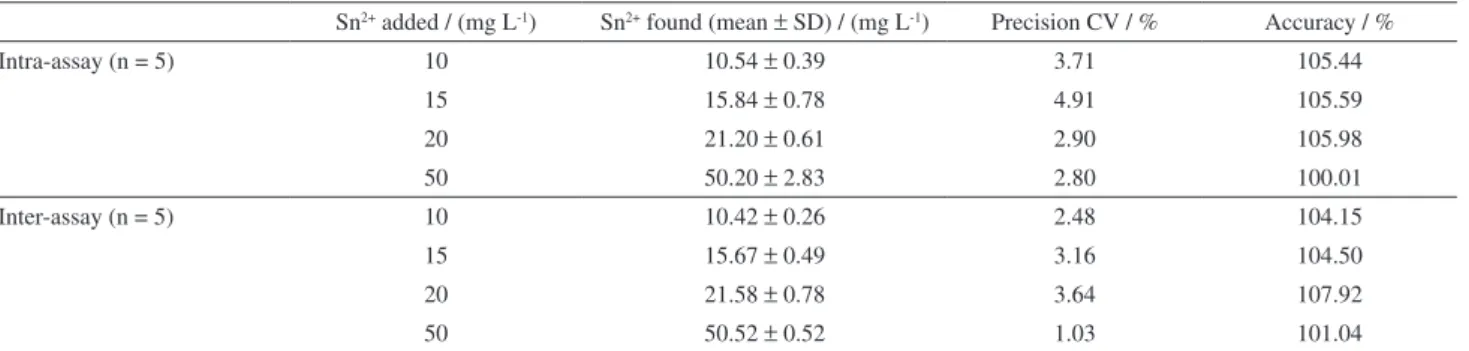
Table 2. Intra and inter-assay accuracy and precision of the method
Sn2+ added / (mg L-1) Sn2+ found (mean ± SD) / (mg L-1) Precision CV / % Accuracy / %
Intra-assay (n = 5) 10 10.54 ± 0.39 3.71 105.44
15 15.84 ± 0.78 4.91 105.59
20 21.20 ± 0.61 2.90 105.98
50 50.20 ± 2.83 2.80 100.01
Inter-assay (n = 5) 10 10.42 ± 0.26 2.48 104.15
15 15.67 ± 0.49 3.16 104.50
20 21.58 ± 0.78 3.64 107.92
50 50.52 ± 0.52 1.03 101.04
accuracy was expressed as the percentage of the added concentration.
Robustness
As shown in Table 3, intentional variations were performed in the concentration of electrolyte, deposition time, use of water without nitrogen, and different operators.
The results indicate that the method is robust in relation to the possible variations that may occur during the execution of the technique, including the small variations in the electrolyte concentration and the execution by different operators. However, some specific parameters, such as the deposition time of 90 seconds, and water nitrogenation must be strictly respected.
Linearity
At least three calibration curves were carried out in the range of 10-50 mg L-1 of Sn2+ (Figure 9).
This experimental set presented a correlation coefficient of 0.9993, revealing the linearity of the method.
Discussion
The determination of Sn2+ concentrations represents
in radiopharmacy, guaranteeing safety and allowing the correct diagnosis.13 In the case of MIBI radiopharmaceutical
kits, the exact concentration of Sn2+ is essential for efficient
cardiac perfusion and adequate scintigraphy.13
Previous studies published methods for tin determination using technologies such as inductive coupled plasma-mass
spectrometry (ICP-MS)14 and gas chromatography coupled
with mass spectrometry (GC/MS).23,24 However, these
techniques do not allow selective determination of tin species, considering that Sn2+ concentrations are calculated
on the basis of total tin concentrations. Tin can also be determined by atomic absorption spectroscopy (AAS), but this technique requires complex extraction procedures.24,25
Currently, voltammetry represents a low-cost technique able to precisely detect small concentrations of this ion, both quantitatively and qualitatively. Nevertheless, there are only few studies for this purpose using the MIBI radiopharmaceutical kit, especially when considering the appropriate electrolyte to be used in the selective analysis
of Sn2+. Thus, we developed and validated a simple
voltammetric method for speciation of Sn2+ in the MIBI
radiopharmaceutical, using 1 mol L-1 HCl.
Hubert et al. developed a simple and rapid method for the separation and determination of Sn2+ and Sn4+ in tin octoate,
a catalyst used in the synthesis of polydimethylsiloxane (PDMS).24 The detection of Sn2+ at the same potential
of Sn4+ is a problem for nuclear medicine, since Sn4+
represents an impurity in lyophilized radiopharmaceutical kits. Several electrolytes have been described for the determination of Sn2+, but there are differences in the
specificities reported. Therefore, many methods used are effective in determining the sum of Sn2+ and Sn4+, but they
fail to provide a selective identification of Sn2+. Decristoforo
et al. described a polarographic method for determination of Sn2+ in technetium cold kits using a mixture of water,
methanol and perchloric acid as electrolyte.10 In addition,
Almeida et al.13 described the selective detection of
Sn2+ (–0.350 to –0.400 V) by using 3 mol L-1 H
2SO4 in
pyrophosphate (PYRO) and methylene diphosphonate (MDP) radiopharmaceutical kits, although the authors have not investigated the effects of Sn2+ oxidation in their
study. Herein, we tested several electrolytes, demonstrating that a series of complicating factors, such as determination of Sn4+ at the same potential of Sn2+, decrease in current
after standard addition, or disproportionate growth of the currents, excluded the use of most options. In our study, among all the electrolytes tested for determining Sn2+, the
only one showing good reproducibility and specificity was 1 mol L-1 HCl. Moreover, this electrolyte is easily prepared
and presented a good stability. The best result obtained among the other electrolytes was achieved with HCl plus citric acid, but this solution presented some problems in the recovery (more than 115%) and linearity. These problems were detected in both determination of standard of Sn2+ in
the excipient and lyophilized radiopharmaceutical kit. This appears to represent a good option for other samples, as described by Pérez-Herranz et al. for tin octoate, although it does not seem to be reliable for MIBI kits.18
To gain further insight on the applicability of 1 mol L-1
HCl, we initially prepared a solution of SnCl2 for reading,
followed by forced oxidation of Sn2+ with H
2O2. The
hydrogen peroxide acts as an oxidizing agent in acid aqueous solution.26 After the reading, we observed a decrease of
the current, which was accompanied by an increased
Table 3. Robustness evaluation of the method
Test (n = 5) Sn
2+ added /
(mg L-1)
Sn2+ found
(mean ± SD) / (mg L-1) Precision CV / % Accuracy / %
Electrolyte concentration 0.9 mol L-1 HCl (pH 0.130) 15 15.98 ± 0.75 4.71 106.53
1.1 mol L-1 HCl (pH 0.010) 15 15.76 ± 1.51 9.61 105.03
Water not nitrogenated 15 18.04 ± 2.42 13.42 120.29
Deposition time 30 s 15 9.46 ± 1.73 18.29 63.09
60 s 15 13.83 ± 2.45 17.74 92.18
Different operators First operator 15 15.82 ± 1.51 9.61 105.03
Second operator 15 15.84 ± 0.77 4.91 105.59
baseline. To rule out the possibility that baseline would hide the Sn2+ peak, we carried out separate experiments
without adding H2O2, which would be responsible for
the increase in baseline, using water bath at 37 °C to oxidize Sn2+. Additionally, a decrease of Sn2+ currents was
observed throughout the three weeks of exposition to room temperature and light. Studies show that the temperature is directly related to the oxidation of Sn2+.10,13 In this case,
Sn4+ formed even at high concentrations of Sn2+, was not
enough to interfere with the analysis and recovery of the analyte. According to this analysis, we might affirm that
our method using 1 mol L-1 HCl was selective for Sn2+
quantification. However, when we performed a reading of Sn4+ using SnCl
4 salt in 1 mol L
-1 HCl we observed a peak
at the same potential of Sn2+. The same does not occur when
we performed the readings using SnCl2, because the results
obtained by us showed that after the oxidation of Sn2+ to
Sn4+ in solution, the current disappears in the potential
where Sn2+ is detected (–0.40 V), indicating the selectivity
of the method for Sn2+. We suppose that this occurs because
the Sn2+ oxidized by oxygen in solution (reaction that is
favored by the presence of 1 mol L-1 HCl)27,28 generates
complex species of Sn4+ which cannot be detected at the
potential of –0.40 V. The formation of Cl–/Sn complex can
display several electrochemical profiles29 and the formed
complex can be responsible for the non-detection of oxidized Sn2+ in solution. This hypothesis is strengthened
by the fact that Sn4+ complexes display completely different
properties in relation to Sn2+ complexes.30,31 Therefore, these
conditions related to the oxidation of Sn2+ were confirmed
by our study because the Sn2+ oxidized was not detected
in the voltammetric analysis.
During the Sn2+ analysis with 1 mol L-1 HCl, considering
all steps to guarantee the quality of SnCl2 (preparation at
the time of use, correct manipulation, ideal storage, and protection against light), it is possible to presume that the
read current of Sn2+ corresponds to the amount weighed
for analysis. Altogether, intra- and inter-assay tests on robustness, accuracy and precision, revealed the method presented by us as a simple, quick, and inexpensive
voltammetric approach to selectively determine Sn2+ in
lyophilized MIBI kits. However, to maintain satisfactory robustness, accuracy, and precision, it is imperative to maintain the methodological parameters, as well as qualified operators.
Conclusion
Validation results provided by us indicated that the
method presented herein shows high specificity for Sn2+
determination, without interference by Sn4+, excipients
from formulation of MIBI or copper. The method presented high sensitivity, and might as well be considered a reliable
parameter for the selective determination of Sn2+ in
radiopharmaceutical MIBI solutions, without interference
of degradation products of Sn2+ using 1 mol L-1 HCl
electrolyte. In summary, the method has advantages, such as the easy and quick preparation of the electrolyte, rapid analyses, reproducibility, and can be applied in a routine laboratory.
Acknowledgments
This work was supported by Fundação de Amparo à Pesquisa do Rio Grande do Sul (FAPERGS) and Conselho Nacional de Desenvolvimento Científico e Tecnológico (CNPq, Brazil). Our laboratory is also supported by FINEP research grant “Implantação, Modernização e Qualificação de Estrutura de Pesquisa da PUCRS” (PUCRSINFRA) #01.11.0014-00. We thank Fábio Ricardo Bento for his excellent technical assistance.
References
1. Sorenson, J. A.; Phelps, M. E.; Physics in Nuclear Medicine, 2nd ed.; Saunders Company: Philadelphia, USA, 1987. 2. Shung, K. K.; Smith, M. B.; Tsui, B.; Principles of Medical
Imaging, 1st ed.; Academic Press: San Diego, California, USA,
1992.
3. Chandra, R.; Introdutory Physics in Nuclear Medicine, 4th ed.; Lea & Febiger: Philadelphia, USA, 1992.
4. Packard, A. B.; Kronauge, J. F.; J. Labelled Compd. Radiopharm.1994, 35,17.
5. Ziegels, P.; Nocaudie, M.; Hugo, D.; Eur. J. Nucl. Med. 1994, 22, 126.
6. Aktolun, C.; Bayhan, H.; Pabuccu, Y.; Bilgic, H.; Acar, H.; Koylu, R.; J. Nucl. Med.1994, 21, 973.
7. Iqbal, T.; Cain Jr., J. H.; Slosky, J. J.; US pat. 4885100 1989. 8. Jones, A. G.; Abrams, M. J.; Davison, A.; Int. J. Nucl. Med.
Biol.1984,11,225.
9. Wackers, F. J.; Berman, D. S.; Maddahi, J.; Watson, D. D.; Beller, G. A.; Strauss, W.; Boucher, C. A.; Picard, M.; Holman, B. L.; Fridrich, R.; Inglese, E.; Delaloye, B.; Camin, L.; McKusick, K.; J. Nucl. Med.1989,30, 301.
10. Decristoforo, C.; Obendorf, D.; Reichart, E.; Stubauer, G.; Riccabona, G.; Nucl. Med. Biol. 1998, 25, 675.
11. Marques, F. L. N.; Okamoto, M. R. Y.; Buchpiguel, C. A.; Radiol. Brasileira2001, 34, 233.
12. Carlos, A. L. F.; Quim. Nova1998, 21, 176.
14. Cardarelli, E.; Talanta1989, 3, 513.
15. Muddukrishna, N.; Appl. Radial. Isot.1994, 45, 293. 16. El-Sayed, A. A.; El-Salen, N. A.; Anal. Sci.2005, 21, 595. 17. Parris, G. E.; Blair, W. R.; Brinckman, F. E.; Anal. Chem.1977,
49, 378.
18. Pérez-Herranz, V. G.; Garcia-Gabaldón, M.; Guiñón, J. L.; Garcia-Antón, J.; Anal. Chim. Acta 2003, 484, 243.
19. http://chemkeys.com/br/2003/03/25/voltametria-conceitos-e-tecnicas/, accessed in June 2014.
20. http://www.metrohm.com/com/Search/index.html?identifier= 80275003&language=en, accessed in June 2014.
21. Rakias, F.; Zolle, I. In Radioactive Isotopes in Clinical Medicine and Research; Bergmann, H.; Kroiss, A.; Sinzinger, H., eds.;
Birkhauser Verlag AG: Basel, Switzerland, 1997, ch. 2. 22. http://www.metrohm.com/com/Support/Technical_Documents/
Instruments.html?identifier=87575003&language=en&na me=87575003, accessed in June 2014.
23. Muñoz, J.; Gallego, M.; Valcárcel, M.; Anal. Chim. Acta2005, 548, 66.
24. Hubert, C.; Ziémons, E.; Rozet, E.; Breuer, A.; Lambert, A.; Jasselette, C.; De Bleye, C.; Lejeune, R.; Hubert, Ph.; Talanta
2010, 80, 1413.
25. Gholivand, M. B.; Babakhanian, A.; Rafiee, E.; Talanta2008, 76, 503.
26. Everse, J.; Everse, K. E.; Grisham, M. B.; Peroxidases in Chemistry and Biology, 2nd ed.; CRC Press: Boca Raton, Florida,
USA, 2000.
27. Chafee, E.; Edwards, J. O. In Progress in Inorganic Chemistry, Inorganic Reaction Mechanisms, 13thed.; Edwards, J. O., ed.;
Interscience Publishers: Providence, Rhode Island, USA, 1970. 28. Wiberg, N.; Holleman, A. F.; Wiberg, E.; Inorganic Chemistry,
1st ed.; Academic Press: San Diego, California, USA, 2001. 29. Kékesi, T.; Acta Metallurgica Slovaca2013, 3, 196.
30. Srivastava, S. C.; Meinken, G.; Smith, T. D.; Richards, P.; Int. J. Appl. Radiat. Isot.1977, 28, 83.
31. Muller, B.; Seward, T. M.; Geochim. Cosmochim. Acta2001, 22, 4187.
Submitted: March 26, 2014