Quim. Nova, Vol. 28, No. 1, 50-53, 2005
Artigo
*e-mail: [email protected]
VALIDATION AND STATISTICAL ANALYSIS OF TWO HIGH PERFORMANCE LIQUID CHROMATOGRAPHY METHODS FOR THE DETERMINATION OF INDINAVIR SULFATE RAW MATERIAL AND CAPSULES
Breno de Carvalho e Silva, Lígia Maria Moreira de Campos, Elzíria Aguiar Nunan, Cristina Duarte Vianna Soares, Gisele Rodrigues Silva, Jóse Antônio de Aquino Ribeiro and Gerson Antônio Pianetti*
Departamento de Produtos Farmacêuticos, Faculdade de Farmácia, Universidade Federal de Minas Gerais, Av. Pres. Antônio Carlos, 6627, 31270-901 Belo Horizonte - MG
Recebido em 27/1/04; aceito em 2/8/04; publicado na web em 12/11/04
Two high performance liquid chromatography (HPLC) methods for the quantitative determination of indinavir sulfate were tested, validated and statistically compared. Assays were carried out using as mobile phases mixtures of dibutylammonium phosphate buffer pH 6.5 and acetonitrile (55:45) at 1 mL/min or citrate buffer pH 5 and acetonitrile (60:40) at 1 mL/min, an octylsilane column (RP-8) and a UV spectrophotometric detector at 260 nm. Both methods showed good sensitivity, linearity, precision and accuracy. The statistical analysis using the t-student test for the determination of indinavir sulfate raw material and capsules indicated no statistically significant difference between the two methods.
Keywords: indinavir sulfate; HPLC; validation.
INTRODUCTION
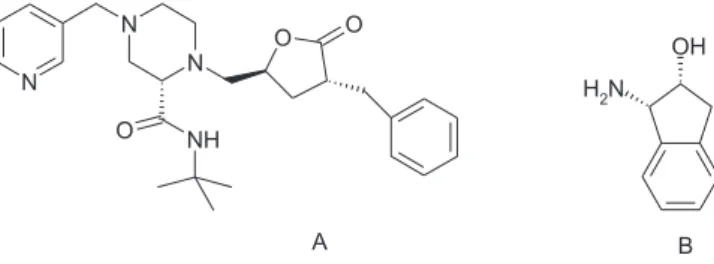
Indinavir sulfate (Figure 1), chemically known as [1(1S,2R),5(S )]-2,3,5-trideoxy-N-2,3-dihydro-2-hydroxy-1H -inden-1-yl)-5-[2-[[(1,1- dimethylethyl)amino]carbonyl]-4-(3-pyridinylmethyl)-1-piperazinyl]-2-phenylmethyl)-D-erythro-pentonamide sulfate (1:1) salt1, is a potent protease inhibitor of Human Immunodeficiency Virus (HIV) widely used in the treatment against the acquired immune deficiency syndrome (AIDS) and prescribed in combination with other protease inhibitors, nucleoside analogues or reverse transcriptase inhibitors2-4. The drug has a molar mass of 613.88 g/mol for the free base and 711.88 g/mol for the sulfate salt and is commercially available as capsules containing the equivalent of 400 mg of indinavir free base.
The estimation of indinavir sulfate should be examined by techniques that discriminate the drug from its degradation products, such as indinavir lactone derivative and cis-aminoindanol5,6 (Figure 2). For this reason ultraviolet spectrophotometric methods should not be applied as long as indinavir and its degradation products absorb the electromagnetic radiation in the same wavelength. Thus, high performance liquid chromatography techniques (HPLC) are advisable for the estimation of indinavir sulfate. Several HPLC methods, using gradient of solvents and mass spectrometric detection, have been
used for the determination of indinavir sulfate in biological samples 7-13, but few methods report its determination in raw material and in
capsules14,15.
The United States Pharmacopeia Forum15 distinguishes the quantitation of the drug adopting two different HPLC methods for the determination of indinavir sulfate in raw material or in capsules. The mobile phase used for the determination of indinavir sulfate in raw material is made of dibutylammonium phosphate buffer and acetonitrile. Meanwhile, the determination of the drug in capsules is accomplished using mixture of citrate buffer and acetonitrile as mo-bile phase. Both methods utilize ultraviolet detection at 260 nm and reverse phase column. Even though the United States Pharmacopeia Forum indicates different methods, in routine quality control is desirable one single assay technique that contemplates the drug quantitation both in raw material and in the pharmaceutical dosage form.
The purposes of this work were validate, through specificity, limit of detection, limit of quantitation, linearity, precision and accuracy, both HPLC methods, presented by the United States Pharmacopeia Forum, and appraise if the methods can be used either for the quantitation of indinavir sulfate in raw material or in capsules. The equivalence between the results of both methods was statistically evaluated by t-student test, indicating if the discrimination of methods, designated by the United States Pharmacopeia Forum, is indispensable or not, for the quantitation of indinavir sulfate in raw material or in capsules.
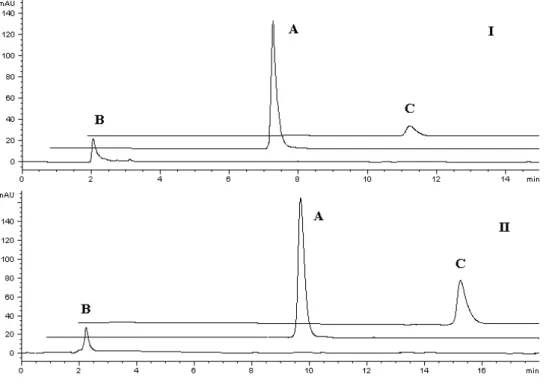
Figure 2. Indinavir lactone derivative (A) and cis-aminoindanol (B)
51 Validation and Statistical Analysis
Vol. 28, No. 1
EXPERIMENTAL PART
Chemicals and solvents
Indinavir sulfate raw material and reference standard and degradation products reference standards, indinavir lactone derivative and cis-aminoindanol, were supplied by Hetero Drugs Limited (Hyderabad, India). Indinavir sulfate capsules containing 400 mg of indinavir, from Merck & Co (Elkton, USA) and NeoQuimica Laboratory Ltd (Anapolis, Brazil), defined as the reference and test products, respectively, were purchased locally. The placebo of capsules was supplied by NeoQuimica Laboratory Ltd (Anapolis, Brazil). All the solvents and reagents used in buffer solutions and mobile phases were HPLC or analytical grade. Water was distilled, deionized and filtered through a 0.22 µm filter (Millipore, USA).
Instrumentation and analytical conditions
A Hewlett Packard 1100 HPLC system equipped with quaternary pump, automatic injector and diode array detector (DAD) module was used in conjunction with Eppendorf CH-500 column oven. ChemStation for LC software Rev. 07.01 (Hewlett Packard, USA) was used for data acquisition. All the standard and sample solutions were filtered through a 0.45 µm filter (Sartorius, Germany). Two chromatographic methods were set.
Method A was performed using a LiChrospher® 100 RP-8 column, 250 mm × 4.0 i.d. and 5 µm particle size (Merck, Germany), maintained at 40 ºC. Diode array detector was set at 260 nm and the automatic injector fitted at 10 µL. The mobile phase consisted of dibutylammonium phosphate buffer and acetonitrile (55:45, v/v) was used at the flow rate of 1.0 mL/min. Dibutylammonium phosphate buffer was prepared by dissolving 1.7 mL of dibutylamine and 3.0 g of phosphoric acid in 900 mL of water and the pH was adjusted to 6.5 ± 0,05 with sodium hydroxide 50% (w/v).
Method B was performed using a LiChrospher® 100 RP-8 column, 250 mm × 4.0 i.d. and 5 µm particle size (Merck, Germany), maintained at 40 ºC. Diode array detector was set at 260 nm and the automatic injector fitted at 50 µL. The mobile phase consisted of citrate buffer and acetonitrile (60:40, v/v) was used at the flow rate of 1.0 mL/min. Citrate buffer was prepared by dissolving 3.7 g of sodium citrate and 1.6 g of citric acid in 1000 mL of water, the pH was adjusted to 5.0 ± 0,1 with sodium hydroxide 4% (w/v).
Methods validation
The methods were validated according to International Conference on Harmonisation guidelines16 for validation of analytical procedures. All the solutions were prepared in the mobile phase using indinavir sulfate reference standard and concentrations expressed as indinavir free base.
Specificity
Specificity, for method A, was evaluated comparing the chromatograms of indinavir 0.5 mg/mL, indinavir lactone derivative 0.1 mg/mL and cis-aminoindanol 0.1 mg/mL reference standard solutions. For method B were employed indinavir 0.3 mg/mL, indinavir lactone derivative 0.1 mg/mL and cis-aminoindanol 0.1 mg/mL reference standard solutions. To achieve the specificity of the method, no peak, with the same retention time of indinavir, is allowed in the chromatogram of indinavir lactone derivative and cis -aminoindanol reference standard solutions.
Limit of detection (LOD) and limit of quantitation (LOQ)
The parameters LOD and LOQ were determined based on the signal to noise method. Indinavir reference standard solutions at 10 µg/mL, 5 µg/mL, 1 µg/mL and 0.5 µg/mL were evaluated for method A and indinavir reference standard solutions at 10 µg/mL, 1 µg/mL and 0.1 µg/mL were evaluated for method B. Each solution was inject five times in the chromatographic system (n = 5). Linearity
The standard calibration curves were obtained with five indinavir reference standard solutions. The concentrations used were 0.3, 0.4, 0.5, 0.6, 0.7 mg/mL for method A and 0.1, 0.2, 0.3, 0.4, 0.5 mg/mL for method B. Linearity was performed within two days and solutions were prepared in triplicate with five injections of each solution (n = 30). The linearity was estimated by linear regression analysis by the least square regression method.
Precision
The precision of the methods was studied for the repeatability (intra-day) and intermediate precision (inter-day). Repeatability was evaluated from the results of peak areas of indinavir reference standard solutions. Solutions were prepared in triplicate with five injections of each solution (n = 15) and the relative standard deviation (RSD) was calculated. Intermediate precision was determined within two days by comparing the results of peak areas of indinavir reference standard solutions. Solutions were prepared in triplicate with five injections of each solution in each day (n = 30) and RSD was calculated. RSD results below 2.0% are recommended for repeatability and intermediate precision. For method A indinavir solutions were prepared at 0.4 mg/mL, 0.5 mg/mL and 0.6 mg/mL and for method B indinavir solutions were prepared at 0.2 mg/mL, 0.3 mg/mL and 0.4 mg/mL.
Accuracy
Accuracy was studied by recovery of known amounts of indinavir reference standard added to placebo of capsules. For method A solutions containing mixture of indinavir at 0.4 mg/mL, 0.5 mg/mL and 0.6 mg/mL and placebo at 0.4 mg/mL were prepared. For method B solutions containing mixture of indinavir at 0.24 mg/mL, 0.3 mg/ mL and 0.36 mg/mL and placebo at 0.4 mg/mL were prepared. A blank solution containing placebo at 0.4 mg/mL was also prepared. Solutions were prepared in duplicate with five injections of each solution (n = 10). The percent recovery of added indinavir was calculated comparing peak areas of the resultant solutions with reference standard indinavir solutions at the same concentration. Percent recovery from 98.0% to 102.0% is recommended for accuracy test.
Statistical analysis
For the statistical analysis of the equivalence between the two chromatographic methods the t-student test was applied for the indinavir sulfate assays results in raw material and in reference and test products capsules.
Method A
52 de Carvalho e Silva et al. Quim. Nova
mobile phase. Eight injections of each solution were done (n = 16). Assays results for raw material and capsules were achieved relating peak area results obtained for reference standard and sample solutions.
Method B
Reference standard indinavir solution was prepared in duplicate. The equivalent to 30 mg of indinavir was accurately weighed, transferred to 100 mL volumetric flask and dissolved in the mobile phase. Eight injections of each reference standard solution were done (n = 16). Sample solutions were prepared in duplicate. The equivalent to 30 mg of indinavir in raw material or in capsules was accurately weighed, transferred to 100 mL volumetric flask and dissolved in the mobile phase. Eight injections of each solution were done (n = 16). Assays results for raw material and capsules were achieved relating peak area results obtained for reference standard and sample solutions.
RESULTS AND DISCUSSION
Methods validation
The peak related to cis-aminoindanol in the degradation product chromatogram, by methods A and B, showed retention time of about 2 min and 2.2 min, respectively. The peak related to indinavir lactone derivative in the degradation product chromatogram, by methods A and B, showed retention time of about 11 min and 16.4 min, respectively. The chromatographic peak related to indinavir, by methods A and B, showed retention time at about 8 min and 10 min, respectively.
In this way, degradation products chromatographic peaks do not inter-fere in indinavir chromatographic peak, indicating that the described chromatographic methods A and B are specific (Figure 3).
The LOD, by methods A and B, was 0.5 µg/mL and 1 µg/mL, respectively. These concentrations displayed a signal-to-noise ratio of 3:1. The LOQ, by methods A and B, was 5 µg/mL and 10 µg/mL, respectively. These concentrations displayed a signal-to-noise ratio of 10:1 and RSD of 1.50% and 1.77%, respectively (n = 5).
Indinavir reference standard calibration curves for methods A and B were constructed by plotting concentration versus peak area and showed good linearity in the 0.3–0.7 mg/mL and 0.1–0.5 mg/mL range, respectively. For both methods the determination coefficient (r2) was over 0.999, indicating highly significant correlation between concentration and peak area (Table 1).
The precision of both methods was expressed as RSD of series of measurements. The chromatographic area results obtained for the repeatability showed RSD below 2% for the concentration range presented. The area results for the intermediate precision from two days of analysis showed RSD below 2% for the concentration range presented (Table 2). All the RSD values indicated good intra-day and inter-day precision.
The accuracy of both methods was expressed as the percent recovery of indinavir reference standard added to placebo of capsules. The results obtained ranged between 99.0% and 102.0% for the concentrations studied (Table 3). All the percent recovery indicated good accuracy and, consequentially, an agreement between the theorical value and the real value of concentration.
Table 1. Methods A and B linear regression analysis results of indinavir reference standard calibration curve
Statistical parameters Method A Method B
Regression equation y = 3166.36x -12.528 y = 7248.01x+102.25
Determination coefficient 0.99982 0.99962
Standard error of slope 24.61 82.56
Standard error of intercept 12.79 27.38
53 Validation and Statistical Analysis
Vol. 28, No. 1
Table 3. Methods A and B results of percent recovery of indinavir reference standard added to placebo of capsules
Method Concentration Percent recovery RSD (%)
(mg/mL) (n = 10)
A 0.4 99.66 0.28
0.5 99.88 1.68
0.6 99.00 0.40
B 0.24 101.78 1.18
0.3 101.59 0.91
0.36 101.98 0.59
Table 2. Methods A and B intra-day and inter-day precision results of indinavir reference standard solutions
Method Concentration RSD (%) RSD (%)
(mg/mL) intra-day inter-day
(n = 15) (n = 30)
A 0.4 0.45 0.96
0.5 0.29 0.97
0.6 0.34 0.88
B 0.2 0.61 1.82
0.3 1.08 1.31
0.4 0.84 1.08
Statistical analysis
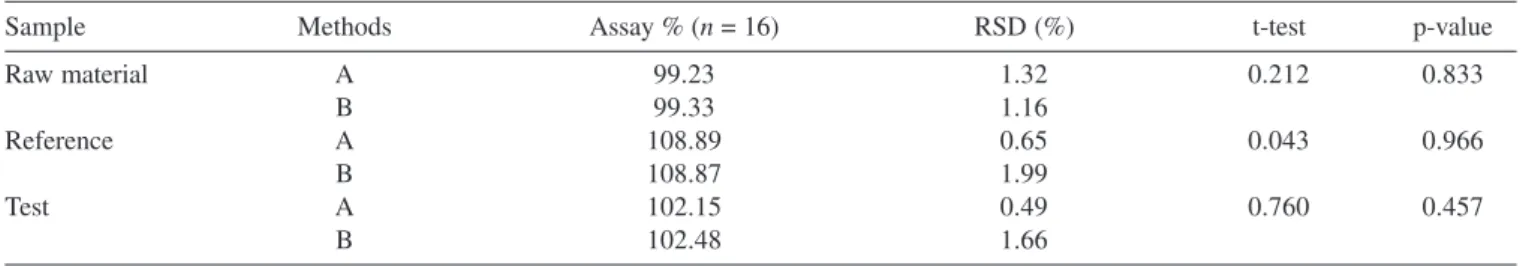
Both chromatographic methods were applied for indinavir sulfate raw material and capsules assays. The results were compared by t-student test for the equivalence evaluation between the methods. The calculated p-value was superior to the significance level (0.05) when the assay results for methods A and B for raw material and reference and test products capsules were compared (Table 4). The performed t-student test did not reveal significant statistical difference between the experimental values in samples assayed by methods A and B, indicating that both methods could be used to quantify indinavir sulfate in raw material and in capsules.
CONCLUSIONS
The HPLC methods for the determination of indinavir sulfate raw material and capsules showed to be specific, precise and accurate. The assay results by both methods were statistically equivalents. The method performed with dibutylammonium phosphate buffer, as a component of the mobile phase, was faster, cheaper and less detrimental for the chromatographic system than the method performed with citrate buffer in the mobile phase. The components of citrate buffer are more expensive and the solution has higher salt concentration, which shortens column and chromatographic system life, than the dibutylammonium phosphate buffer. Despite the United States Pharmacopeial Forum distinguishes different methods for indinavir sulfate assay in raw material and in capsules, the results presented in this work indicated no necessity to apply this distinction. For these reasons, method A is more advantageous for the quantitation of indinavir sulfate either in raw material or in capsules.
Table 4. Methods A and B statistical t-student test results for indinavir sulfate raw material and capsules assay
Sample Methods Assay % (n = 16) RSD (%) t-test p-value
Raw material A 99.23 1.32 0.212 0.833
B 99.33 1.16
Reference A 108.89 0.65 0.043 0.966
B 108.87 1.99
Test A 102.15 0.49 0.760 0.457
B 102.48 1.66
ACKNOWLEDGEMENTS
We would like to thank the Brazilian Pharmacopoeia for financial support.
REFERENCES
1. Merck & Co. Inc.; The Merck Index,12 ed, WhiteHouse Station: New Jersey 1996, p. 850.
2. Vacca, J. P.; Dorsey, B. D.; Schleif, W. A.; Levin, R. B.; McDaniel, S. L.; Darke, P. L.; Zugay, J.; Quintero, J. C.; Blahy, O. M.; Roth, E.; Sardana, V. V.; Schlbach, A. J.; Graham, P. I.; Condra, J. H.; Gotlib, L.; Holloway, M. K.; Lin, J.; Chen, I. W.; Vastag, K.; Ostovic, D.; Anderson, P. S.; Emini, E. A.; Huff, J. F.; Proc. Natl. Acad. Sci. U.S.A. 1994, 91, 4096.
3. Yeh, K. C.; Deustsch, P. J.; Haddix, H.; Hesney, M.; Hoagland, V.; Ju, W. D.; Justice, S. J.; Osbournem B.; Sterrett, A. T.; Stone, J. A.; Woolf, E.; Waldman, S.; Antimicrob. Agents Chemother. 1998, 332.
4. Patrick, A. J.; Potts, K. E.; Clin. Microbiol. Rev. 1998, 11, 614.
5. Kreuz, D. M.; Howard, A. L.; Ip, D.; J. Pharm. Biomed. Anal. 1999, 19, 725.
6. Demir, A. S.; Hamamci, H.; Goganel, F.; Ozgul, E.; J. Mol. Catal. B: Enzim.
2000, 9, 157.
7. Woolf, E.; Haddix, H. M.; Matuszewski, B.; J. Chromatogr., A 1997, 762, 311.
8. Burger, D. M.; de Graaff, M.; Wuis, E. W.; Koopmans, P. P.; Hekster, Y.
A.; J. Chromatogr., B: Biomed. Sci. Appl. 1997, 703, 235.
9. Dailly, E.; Thomas, L.; Kergueris, M. F.; Joillet, P.; Bourin, M.; J.
Chromatogr., B: Biomed. Sci. Appl. 2001, 758, 129.
10. Foisy, M. L.; Sommadossi, J. P.; J. Chromatogr., B: Biomed. Sci. Appl.
1999, 721, 239.
11. Jayewardene, A. L.; Zhu, F.; Aweeka, F. T.; Gambertoglio, J. G.; J.
Chromatogr., B: Biomed. Sci. Appl. 1998, 707, 203.
12. Jayewardene, A. L.; Kearney, B.; Stone, J. A.; Gambertoglio, J. G.; Aweeka, F. T.; J. Pharm. Biomed. Anal. 2001, 25, 309.
13. Rose, M. J.; Merschman, S. A.; Eisenhandler, R.; Woolf, E. J.; Yeh, K. C.; Lin, L.; Fang, W.; Hsieh, J.; Braun, M. P.; Gatto, G. J.; Matuszewski, B.
K.; J. Pharm. Biomed. Anal. 2000, 24, 291.
14. Johnson, B. D.; Howard, A.; Varsolona, R.; McCauley, J.; Ellison, D. K.;
Anal. Prof. Drug Substances 1999, 26, 319.
15. United States Pharmacopeial Convention; Pharmacopeial Forum, Rockville, MD 2000, vol. 26, p. 1638.
16. International Conference on Harmonisation (ICH); Topic Q2B, Validation of Analytical Procedures: Methodology, Proceedings of the Commission