Responsiveness of the domain climbing up and going
down stairs of the Functional Evaluation scale for
Duchenne Muscular Dystrophy: a one-year follow-up
Priscila S. Albuquerque1, Mariana C. Voos1, Mariene S. Simões1, Joyce Martini1, Carlos B. M. Monteiro1, Fatima A. Caromano1
ABSTRACT | Objective: To determine the responsiveness of the domain climbing up and going down stairs of the Functional Evaluation Scale for Duchenne Muscular Dystrophy (FES-DMD-D3) in a one-year follow-up study. Method: The study included 26 patients with DMD. Effect Size (ES) and Standardized Response Mean (SRM) described the scale’s responsiveness. Results: For climbing up stairs, ES showed that responsiveness was low in the three-month assessments (0.26; 0.35; 0.13; 0.17), low to moderate in the six-month assessments (0.58; 0.48; 0.33), moderate in the nine-month assessments (0.70; 0.68), and high in the 12-month assessment (0.88). SRM showed that responsiveness was low in the three-month assessments (0.29; 0.38; 0.18; and 0.19), low to moderate in the six-month assessments (0.59; 0.51; 0.36), moderate in the nine-month assessments (0.74 and 0.70), and high in the 12-month assessment (0.89). For going down stairs, ES showed that responsiveness was low in the three- and six-month assessments (0.16; 0.25; 0.09; 0.08 and 0.48; 0.35; 0.18, respectively), low to moderate in the nine-month assessments (0.59; 0.44), and moderate in the 12-month assessment (0.71). SRM showed that responsiveness was low in the three- and six-month assessments (0.25; 0.35; 0.12; 0.09 and 0.47; 0.38; 0.21, respectively), low to moderate in the nine-month assessment (0.62; 0.49), and moderate in the 12-month assessment (0.74). Conclusion: Climbing up stairs should be assessed at intervals of nine months or longer, when responsiveness is moderate to high. Going down stairs should be assessed annually because moderate responsiveness was observed in this period.
Keywords: Duchenne muscular dystrophy; disability evaluation; physical therapy modalities; motor skills.
BULLET POINTS
• The study describes the responsiveness of the domain climbing up and going down stairs of the FES-DMD-D3 in children with DMD.
• Descriptive indicators of the progression of children with DMD were determined in the 12-month follow-up assessment of climbing stairs.
HOW TO CITE THIS ARTICLE
Albuquerque PS, Voos MC, Simões MS, Martini L, Monteiro CBM, Caromano FA. Responsiveness of the domain climbing up and going down stairs of the Functional Evaluation Scale for Duchenne Muscular Dystrophy: a one-year follow-up. Braz J Phys Ther. 2016 Sept-Oct; 20(5):471-476 . http://dx.doi.org/10.1590/bjpt-rbf.2014.0178
1 Programa de Pós-graduação em Ciências da Reabilitação, Laboratório de Fisioterapia e Comportamento, Faculdade de Medicina, Universidade de São
Paulo (USP), São Paulo, SP, Brazil
Received: Nov. 22, 2015 Revised: Feb. 10, 2016 Accepted: Feb. 23, 2016
Introduction
Duchenne muscular dystrophy (DMD) is a recessive genetic disorder, caused by the alteration of the gene that encodes dystrophin protein, which is essential for maintaining the muscle cell membrane. The affected gene is located on the short arm of chromosome X, locusXp211-3. DMD is characterized by generalized and irreversible progressive deterioration of muscular strength. Symptoms appear when children are three to
ive years old. Lower limbs are affected irst, leading to dificulty climbing steps, running, and getting up
from the loor, frequent falls, and pseudohypertrophy
of the calf muscles. When children are 10 to 12 years old, patients lose gait and show upper limb and respiratory muscle weakness, spine deformities, and heart dysfunction1-3.
Assessment7, and Functional Evaluation Scale for Duchenne Muscular Dystrophy (FES-DMD)8-11.
The FES-DMD is the only functional evaluation scale that describes compensatory movements, which are a consequence of muscular strength loss. It consists of four domains, sitting and rising from the chair (domain 1), walking (domain 2), climbing up and going down stairs (domain 3), and sitting and standing
up from the loor (domain 4). Previous studies have
shown that its intra- and inter-rater reliability ranges from good to excellent8-11.
The evaluation of climbing up stairs is divided into
ive stages. Phase I or preparation in standing position
consists of three subphases. Phase II or propulsion consists of eight subphases. Phase III or pelvic swing consists of seven subphases. Phase IV or lower limb swing consists of three subphases. Phase V or support consists of four subphases10. The evaluation of going down stairs is divided into four phases. Phase I or preparation in standing position is composed of three subphases. Phase II or propulsion is composed
of ive subphases. Phase III or balance comprises
ten subphases. Phase IV or support consists of nine subphases10. This clearly shows that climbing up and going down stairs are complex activities that require muscle synergy and stability; however, research on these activities is limited to the analysis of falls during descent, skill development and learning, or timed performance. The most comprehensive study involving the kinesiological aspects of this activity was conducted in healthy adults by McFadyen and Winter and became a reference for subsequent studies12.
Despite excellent results regarding the reliability of the FES-DMD, appropriate reassessment intervals has not yet been established. Thus, it is necessary to measure the responsiveness of each domain of the FES-DMD. Responsiveness is an index of sensitivity that detects the clinical change over time due to disease progression or clinical intervention13-15. This study speciically analyzed the responsiveness of the domain
climbing up and going down stairs (FES-DMD-D3)
and identiied the appropriate intervals between
evaluations in a one-year follow-up.
Method
Experimental design
Observational, longitudinal, and retrospective study approved by the Research Ethics Committee of Faculdade de Medicina da Universidade de São Paulo (USP), São Paulo, SP, Brazil, process number
435/13. The subjects’ parents or legal guardians signed
an informed consent form prior to participation.
Subjects
The image bank of Laboratório de Miopatias do Instituto de Biociências da USP was used. Twenty-six children with molecular diagnosis of DMD participated in this study. They were taking steroids regularly
and were classiied as 1 to 3 on the Vignos Scale.
Their mean age was 8.1±1.8 years old, mean height 1.39±0.17, and mean weight 40.8±10.4 kg (mean±SD). Each child was evaluated four times in a 12-month period at intervals of three, six, nine, and 12 months. Four patients who did not attend to all assessments were excluded.
Procedures
We evaluated 23 videos of the subjects climbing up stairs and 26 videos of the subjects going down
stairs. FES-DMD-DATA software was used for the assessment.
Responsiveness was assessed at three-month intervals (0 to 3, 3 to 6, 6 to 9, and 9 to 12 months), six-month intervals (0 to 6, 3 to 9, and 6 to 12 months), nine-month intervals (0 to 9 and 3 to 12), and at a 12-month interval (0 to 12 months). This methodology was based on previous responsiveness studies16-22.
Recommendations about the best responsiveness evaluation method are still lacking in the literature. Many approaches have been used but none is considered standard. Responsiveness is assessed using different indicators such as Effect Size (ES) and Standardized Response Mean (SRM)16-22. According to Mehrholz et al.23, the SRM can better relect the individual changes than the ES test. Samsa et al.24 reported that the ES should be interpreted with caution. Other authors have recommended that both should be combined to avoid misinterpretations23,24.
Following these recommendations, ES and SRM were used. ES was calculated using the formula:
ES= Mx - M0/ DPb. Mx was the mean follow-up
assessment score in time x, M0 was the mean evaluation score at time 0 (initial evaluation) and DPb was the standard deviation of the initial evaluation. SRM was
calculated by the formula: SRM = Mx - M0/ DP(Mx - M0).
The denominator was the standard deviation of the difference between Mx and M022.
The analysis considered Cohen’s criteria, which
Results
Climbing up stairs
Table 1 shows the ES of each phase, considering the evaluation intervals and the total score obtained in the domain climbing up stairs of the FES-DMD-D3. Climbing up stairs showed low responsiveness in all four three-month assessments (0.26, 0.35, 0.13 and 0.17). Responsiveness was moderate in one of the six-month assessments (0.58) and low in the other two six-month assessments (0.48 and 0.33). In the nine-month assessments, responsiveness was moderate (0.70 and 0.68). In the 12-month assessment, responsiveness was high (0.88) (Table 1).
Table 2 shows the SRM of each stage, considering the evaluation intervals and the total score obtained in the FES-DMD-D3. Climbing up stairs responsiveness was
classiied as low in the four three-month assessments
(0.29, 0.38, 0.18, and 0.19). At six-month intervals, responsiveness was moderate in two assessments
(0.59 and 0.51) and low in the irst assessment (0.36).
In the nine-month assessments, responsiveness was moderate (0.74 and 0.70). In the 12-month assessment, responsiveness was high (0.89) (Table 2).
Climbing down stairs
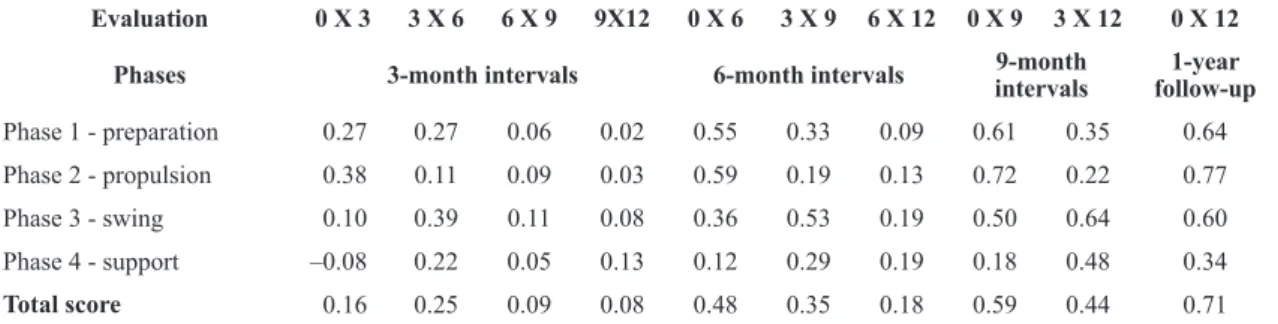
Table 3 shows the ES of each stage, considering the evaluation intervals and the total score obtained in the FES-DMD-D3. For climbing down stairs, the three-month assessments (0.16, 0.25, 0.09, and 0.08) and six-month assessments (0.48, 0.35, and 0.18) showed low responsiveness. In the nine-month assessments, responsiveness was moderate in one assessment (0.59) and low in the other (0.44). In the 12-month assessment, responsiveness was moderate (0.71) (Table 3).
Table 4 shows the SRM of each phase, considering the evaluation intervals and the total score of the FES-DMD-D3. Climbing down stairs showed low responsiveness in the three-month assessments (0.25, 0.35, 0.12, and 0.09) and in the six-month assessments (0.47, 0.38, and 0.21). In the nine-month assessments, responsiveness was moderate (0.62) and low (0.49). In 12-month assessment, responsiveness was moderate (0.74) (Table 4).
Table 5 shows the means and standard deviations of the total scores of climbing up and going down stairs, considering the evaluation intervals in months and the total score at baseline.
Table 1. Responsiveness analysis (Effect Size) of climbing up stairs.
Evaluation 0 X 3 3 X 6 6 X 9 9X12 0 X 6 3 X 9 6 X 12 0 X 9 3 X 12 0 X 12
Phases 3-month intervals 6-month intervals 9-month
intervals
1-year follow-up
Phase 1 - preparation 0.42 0.14 0.02 0.09 0.54 0.17 0.11 0.57 0.28 0.66
Phase 2 - propulsion 0.30 0.38 0.17 0.13 0.74 0.55 0.33 0.93 0.70 1.09
Phase 3 - pelvic balance 0.20 0.14 –0.05 0.14 0.33 0.09 0.10 0.29 0.23 0.41
Phase 4 - swing 0.44 0.20 0.37 0.14 0.11 0.51 0.50 0.44 0.61 0.56
Phase 5 - support 0.04 0.32 0.08 0.16 0.34 0.41 0.24 0.43 0.61 0.61
Total score 0.26 0.35 0.13 0.17 0.58 0.48 0.33 0.70 0.68 0.88
Coeficients >0.20 and <0.50 indicate low responsiveness, coeficients >0.5 and <0.8 indicate moderate responsiveness, and coeficients >0.8
denote high responsiveness.
Table 2. Responsiveness analysis (Standardized Response Mean) of climbing up stairs.
Evaluation 0 X 3 3 X 6 6 X 9 9X12 0 X 6 3 X 9 6 X 12 0 X 9 3 X 12 0 X 12
Phases 3-month intervals 6-month intervals 9-month
intervals
1-year follow-up
Phase 1 - preparation 0.44 0.16 0.03 0.11 0.56 0.17 0.13 0.58 0.28 0.67
Phase 2 - propulsion 0.33 0.39 0.19 0.15 0.75 0.56 0.34 0.96 0.72 1.10
Phase 3 - pelvic balance 0.21 0.15 0.05 0.16 0.32 0.10 0.11 0.31 0.25 0.43
Phase 4 - swing 0.46 0.23 0.39 0.14 0.13 0.53 0.50 0.44 0.62 0.56
Phase 5 - support 0.05 0.35 0.08 0.15 0.35 0.42 0.26 0.42 0.63 0.63
Total score 0.29 0.38 0.18 0.19 0.59 0.51 0.36 0.74 0.70 0.89
Coeficients >0.20 and <0.50 indicate low responsiveness, coeficients >0.5 and <0.8 indicate moderate responsiveness, and coeficients >0.8
Discussion
This study determined the most appropriate evaluation intervals for FES-DMD-D3 (climbing up and going down stairs) by responsiveness analysis. Climbing up stairs, according to ES, ranged from low to moderate in the six-month assessments and
the classiication was found by SRM. Climbing down
stairs showed low to moderate responsiveness in the nine-month assessments.
In addition to the FES-DMD, other scales for patients with DMD have been tested for reliability and responsiveness. One of the most commonly used is the MFM. In a study with 41 patients using SRM analysis, the total score in the MFM showed good responsiveness in the one-year interval26. The similarity between this study and the present study is due to the fact that both included only patients with DMD,
which have signiicant deterioration of motor function
in one year. The MFM was applied to patients with different types of spinal muscular atrophy (SMA) at three-month intervals. The authors showed that although patients had the same disease, responsiveness
relected the distinct progression of the clinical types
of the disease, according to disease severity26. The design and reliability testing of the FES-DMD-D3 showed that the timed performance of climbing up stairs had strong correlation with the total score. This was not true of going down stairs. The authors considered that going down stairs would require less complex movements than climbing up stairs because gravity favored descending movements11. In fact, climbing down stairs requires eccentric control of the extensor muscles of hips and knees, which are compromised by DMD, and as patients show reduced
range of dorsal and plantar ankle lexion, the activity
may become unsafe and dangerous11,27.
Table 3. Responsiveness analysis (Effect Size) of going down stairs.
Evaluation 0 X 3 3 X 6 6 X 9 9X12 0 X 6 3 X 9 6 X 12 0 X 9 3 X 12 0 X 12
Phases 3-month intervals 6-month intervals intervals9-month follow-up1-year
Phase 1 - preparation 0.27 0.27 0.06 0.02 0.55 0.33 0.09 0.61 0.35 0.64
Phase 2 - propulsion 0.38 0.11 0.09 0.03 0.59 0.19 0.13 0.72 0.22 0.77
Phase 3 - swing 0.10 0.39 0.11 0.08 0.36 0.53 0.19 0.50 0.64 0.60
Phase 4 - support –0.08 0.22 0.05 0.13 0.12 0.29 0.19 0.18 0.48 0.34
Total score 0.16 0.25 0.09 0.08 0.48 0.35 0.18 0.59 0.44 0.71
Coeficients >0.20 and <0.50 indicate low responsiveness, coeficients >0.5 and <0.8 indicate moderate responsiveness, and coeficients >0.8
denote high responsiveness.
Table 4. Responsiveness analysis (Standardized Response Mean) of going down stairs.
Evaluation 0 X 3 3 X 6 6 X 9 9X12 0 X 6 3 X 9 6 X 12 0 X 9 3 X 12 0 X 12
Phases 3-month intervals 6-month intervals 9-month intervals follow-up1 year
Phase 1 - preparation 0.31 0.32 0.15 0.04 0.58 0.35 0.11 0.63 0.38 0.66
Phase 2 - propulsion 0.42 0.15 0.12 0.06 0.61 0.21 0.15 0.74 0.24 0.79
Phase 3 - swing 0.20 0.42 0.16 0.12 0.38 0.55 0.20 0.52 0.66 0.63
Phase 4 - support 0.12 0.25 0.07 0.15 0.15 0.31 0.21 0.20 0.50 0.36
Total score 0.25 0.35 0.12 0.09 0.47 0.38 0.21 0.62 0.49 0.74
Coeficients >0.20 and <0.50 indicate low responsiveness, coeficients >0.5 and <0.8 indicate moderate responsiveness, and coeficients >0.8
denote high responsiveness.
Table 5. Mean and standard deviation of the total scores of climbing up and going down stairs. Evaluation intervals are represented in months (0, 3, 6, 9, and 12 months).
Climbing up stairs Going down stairs
FES 0 FES 3 FES 6 FES 9 FES 12 FES 0 FES 3 FES 6 FES 9 FES 12
12.82 14.17 15.82 16.43 17.34 11.84 12.65 14.15 14.69 15.23
Motor strategies observed in going down stairs are more variable. Some patients used gravity to compensate decreased voluntary acceleration in the descending movement, taking a higher risk of falls. The study conducted by Martini et al.27 showed that the variability of compensatory movement strategies during going down stairs affects the time of execution of the activity and described two different coping strategies. Other studies reported that patients increased the number of compensatory movements and time in order to prioritize safety. In the present study, motor
variability is relected by high standard deviations. A major limitation of the present study was the
number of patients in different stages of the disease (Vignos 1-3). Patients who are closer to gait loss may have a faster clinical progression, which can affect the responsiveness of the FES-DMD-D3. Future studies should evaluate and compare the responsiveness of the FES-DMD-D3 in a larger number of patients
grouped by Vignos classiication. Responsiveness
may vary between the groups.
Conclusion
The FES-DMD-D3 (climbing up and going down stairs) showed responsiveness starting with the three-month assessments. Climbing up stairs showed moderate responsiveness at nine-month intervals and high responsiveness in the 12-month follow-up. Climbing down stairs showed moderate responsiveness in the 12-month follow-up.
References
1. Scott E, Mawson SJ. Measurement in Duchenne muscular dystrophy: considerations in the development of a neuromuscular assessment tool. Dev Med Child Neurol. 2006;48:540-4. http://dx.doi.org/10.1017/S0012162206001137. PMid:16700951.
2. Bothwell JE, Dooley JM, Gordon KE, MacAuley A, Camfield PR, MacSween J. Duchenne muscular dystrophy -- Parental perceptions. Clin Pediatr (Phila). 2002;41(2):105-9. http:// dx.doi.org/10.1177/000992280204100206. PMid:11931326. 3. Parreira SLS, Resende MBD, Zanoteli E, Carvalho MS, Marie
SK, Reed UC. Comparison of motor strength and function in patients with Duchenne muscular dystrophy with or without steroid therapy. Arq Neuropsiquiatr. 2010;68(5):683-8. http://dx.doi.org/10.1590/S0004-282X2010000500002. PMid:21049175.
4. Main M, Kairon H, Mercuri E, Muntoni F. The Hammersmith Functional Motor Scale for children with Spinal Muscular Atrophy: a scale to test ability and monitor progress in children with limited ambulation. Eur J Paediatr Neurol.
2003;7(4):155-9. http://dx.doi.org/10.1016/S1090-3798(03)00060-6. PMid:12865054.
5. Iwabe C, Miranda-Pfeilsticker BH, Nucci A. Motor function measure: portuguese version and reliability analysis. Rev Bras Fisioter. 2008;12(5):417-24. http://dx.doi.org/10.1590/ S1413-35552008000500012.
6. Martinez JAB, Brunherotti MA, Assis MR, Sobreira CFR. Validação da escala motora funcional EK para língua portuguesa. Rev Assoc Med Bras. 2006;52(5):347-51. http://dx.doi.org/10.1590/S0104-42302006000500024. PMid:17160311.
7. Scott E, Eagle M, Mayhew A, Freeman J, Main M, Sheehan J, et al. Development of a functional assessment scale for ambulatory boys with Duchenne muscular dystrophy. Physiother Res Int. 2012;17(2):101-9. http://dx.doi.org/10.1002/ pri.520. PMid:21954141.
8. Carvalho EV, Hukuda ME, Escorcio R, Voos MC, Caromano FA. Development and reliability of the functional evaluation scale for duchenne muscular dystrophy, gait domain: a pilot study. Physiother Res Int. 2015;20(3):135-46. http:// dx.doi.org/10.1002/pri.1605. PMid:25521365.
9. Escorcio R, Caromano FA, Hukuda ME, Fernandes LAY. Development of an evaluation scale for sitting and standing from the ground for children with Duchenne muscular dystrophy. J Mot Behav. 2011;43(1):31-6. http://dx.doi.org /10.1080/00222895.2010.530306. PMid:21186460. 10. Fernandes LAY, Caromano FA, Hukuda ME, Escorcio R,
Carvalho EV. Elaboration and reliability of functional evaluation on going up and down steps scale for Duchenne muscular dystrophy. Rev Bras Fisioter. 2010;14(6):518-26. http://dx.doi.org/10.1590/S1413-35552010000600011. PMid:21340247.
11. Hukuda ME, Escorcio R, Fernandes LA, de Carvalho EV, Caromano FA. Evaluation scale development, reliability for sitting and standing from the chair for Duchenne muscular dystrophy. J Mot Behav. 2013;45(2):117-26. http://dx.doi. org/10.1080/00222895.2012.760513. PMid:23488586. 12. McFadyen BJ, Winter DA. An integrated biomechanical
analysis of normal stair ascent and descent. J Biomech. 1988;21(9):733-44. http://dx.doi.org/10.1016/0021-9290(88)90282-5. PMid:3182877.
13. Tuley MR, Mulrow CD, McMahan CA. Estimating and testing an index of responsiveness and the relationship of the index to power. J Clin Epidemiol. 1991;44(4-5):417-21. http:// dx.doi.org/10.1016/0895-4356(91)90080-S. PMid:2010785. 14. Parkerson GR Jr, Willke RJ, Hays RD. An International
comparison of the reliability and responsiveness of the Duke health profile for measuring health-related quality of life of patients treated with Alprostadil for erectile dysfunction. Med Care. 1999;37(1):56-67. http://dx.doi. org/10.1097/00005650-199901000-00009. PMid:10413393. 15. Stucki G, Liang MH, Fossel AH, Katz JN. Relative responsiveness of condition-specific and generic health status measures in degenerative lumbar spinal stenosis. J Clin Epidemiol. 1995;48(11):1369-78. http://dx.doi. org/10.1016/0895-4356(95)00054-2. PMid:7490600. 16. Duncan PW, Duncan PW, Wallace D, Lai SM, Johnson
17. Revicki DA, Gnanasakthy A, Weinfurt K. Documenting the rationale and psychometric characteristics of patient reported outcomes for labeling and promotional claims: the PRO Evidence Dossier. Qual Life Res. 2007;16(4):717-23. http:// dx.doi.org/10.1007/s11136-006-9153-5. PMid:17268927. 18. Liang MH. Longitudinal construct validity. Establishment
of clinical meaning in patient evaluative instruments. Med Care. 2000;9:84-90. PMid:10982093.
19. Mokkink LB, Prinsen CA, Bouter LM, Vet HC, Terwee CB. The Consensus-based Standards for the selection of health Measurement Instruments (COSMIN) and how to select an outcome measurement instrument. Braz J Phys Ther. 2016 [Epub ahead of print]. http://dx.doi.org/10.1590/ bjpt-rbf.2014.0143. PMid:26786084.
20. De Boer MR, Moll AC, De Vet HC, Terwee CB, Volker-Dieben HJ, Van Rens GH. Psychometric properties of vision: related quality of life questionnaires: a systematic review. Ophthal Physiol. 2004;24(4):257-73. http://dx.doi. org/10.1111/j.1475-1313.2004.00187.x. PMid:15228503. 21. Kazis LE, Anderson JJ, Meenan RF. Effect sizes for
interpreting changes in health status. Med Care. 1989;27(3 Suppl):S178-89. http://dx.doi.org/10.1097/00005650-198903001-00015. PMid:2646488.
22. Liang MJ, Fossel AH, Larson MG. Comparisons of five health status instruments for orthopedic evaluation. Med Care. 1990;28(7):632-42. http://dx.doi.org/10.1097/00005650-199007000-00008. PMid:2366602.
23. Mehrholz J, Wagner K, Rutte K, Meißner D, Pohl M. Predictive Validity and Responsiveness of the functional ambulation category in hemiparetic patients after stroke.
Arch Phys Med Rehabil. 2007;88(10):1314-9. http://dx.doi. org/10.1016/j.apmr.2007.06.764. PMid:17908575. 24. Samsa G, Edelman D, Rothman ML, Williams GR, Lipscomb
J, Matchar D. Determining clinically important differences in health status measures: a general approach with illustration to the Health Utilities Index Mark II. Pharmacoeconomics. 1999;15(2):141-55. http://dx.doi.org/10.2165/00019053-199915020-00003. PMid:10351188.
25. Cohen J. Statistical power analysis for the behavioral sciences. 2nd ed. Hillsdale: Lawrence Earlbaum Associates; 1988. 26. Vuillerot C, Girardot F, Payan C, Fermanian J, Iwaz J, De
Lattre C, et al. Monitoring changes and predicting loss of ambulation in Duchenne muscular dystrophy with the motor function measure. Dev Med Child Neurol. 2010;52(1):60-5. http://dx.doi.org/10.1111/j.1469-8749.2009.03316.x. PMid:19453691.
27. Martini J, Hukuda ME, Caromano FA, Favero FM, Fu C, Voos MC. The clinical relevance of timed motor performance in children with Duchenne muscular dystrophy. Physiother Theory Pract. 2015;31(3):173-81. http://dx.doi.org/10.3109 /09593985.2014.989294. PMid:25539097.
Correspondence Fatima A. Caromano
Universidade de São Paulo (USP)
Laboratório de Fisioterapia e Comportamento Rua Cipotânea, 51, Butantã