Article
Printed in Brazil - ©2015 Sociedade Brasileira de Química 0103 - 5053 $6.00+0.00
A
*e-mail: [email protected], [email protected]
Application of Carbon Composite Adsorbents Prepared from Coffee Waste and
Clay for the Removal of Reactive Dyes from Aqueous Solutions
Davis C. dos Santos,a Matthew A. Adebayo,b,c Eder C. Lima,*,b Simone F. P. Pereira,a
Renato Cataluña,b Caroline Saucier,b Pascal S. Thueb,d and Fernando M. Machadoe
aInstitute of Exact and Natural Sciences, Federal University of Para (UFPA), 66075-110 Belem-PA, Brazil
bInstitute of Chemistry, Federal University of Rio Grande do Sul (UFRGS),
Av. Bento Gonçalves 9500, P.O. Box 15003, 91501-970 Porto Alegre-RS, Brazil
cDepartment of Chemical Sciences, Ajayi Crowther University, PMB 1066, 211271 Oyo, Oyo State, Nigeria
dDepartment of Applied Chemistry, University of Ngaoundere, P.O. Box 455,
000237 Ngaoundere, Cameroon
eTechnology Development Center, Federal University of Pelotas (UFPEL), 96010-610 Pelotas-RS, Brazil
A novel carbon composite was prepared from a mixture of coffee waste and clay with inorganic:organic ratio of 1.3 (CC-1.3). The mixture was pyrolysed at 700 °C. Considering the application of this adsorbent for removal of anionic dyes, the CC-1.3 was treated with a 6 mol L−1
HCl for 24 h to obtain ACC-1.3. Fourier transform infrared (FTIR), N2 adsorption/desorption curves, scanning electron microscope (SEM) and powder X-ray diffractometry (XRD) were used for characterisation of CC-1.3 and ACC-1.3 carbon adsorbents. The adsorbents were effectively utilised for removal of reactive blue 19 (RB-19) and reactive violet 5 (RV-5) textile dyes from aqueous solutions. The maximum amounts of RB-19 dye adsorbed at 25 °C are 63.59 (CC-1.3) and 110.6 mg g−1 (ACC-1.3), and 54.34 (CC-1.3) and 94.32 mg g−1 (ACC-1.3) for RV-5 dye. Four
simulated dye-house effluents were used to test the application of the adsorbents for treatment of effluents.
Keywords: adsorption, industrial effluents, carbon composites, general order kinetic model,
nonlinear isotherms
Introduction
Textile industries vastly employed synthetic dyes for fabric coloration. This group of reactive dyes made up ca. 30% of dyes used in the textile industry.1 During manufacturing
process of fabrics, between 10 and 60% of these dyes are lost, leading to generation of colored wastewater.2 The
dye-contaminated wastewater emanating from textile industries is unfriendly to aquatic living organisms; it reduces light penetration in water, thereby lessens photosynthetic rate of aqueous flora.3 Most dyes are carcinogenic, toxic and
mutagenic;4,5 they negatively affect the environment.6
Reactive dyes have complex aromatic molecular-structure, therefore, treatment of effluents containing reactive dyes is a difficult task.7 This feature makes reactive dyes more
stable and non-biodegradable.8 In consequence of global
strict regulations,1 wastewaters coming from the textile
industries must be decolored before they are released into the environment or water bodies.9,10 In this regard, there have
been a search and demand for eco-friendly technologies to remove dyes from wastewater.11
Adsorption process is one of the valuable technologies for removal of synthetic dyes from wastewaters.12,13 Apart
from availability of low cost adsorbents, adsorption is an effective and a simple technology, therefore, preferable to other technologies.14-18 Adsorption is a process in which
pollutants are transferred from the effluent to a solid phase, thereby reducing the bioavailability of the hazardous pollutants to living organisms.15,19
Coffee is one of the beverages widely consumed in the world. It is estimated that about 6.8 billion kg of coffee wastes are generated in the world.20 Accumulation as well
Carbon composites were prepared from coffee waste and inorganic components. The preparation was done to improve the adsorption capacity of the adsorbent for removal of dyes compared to coffee-waste carbonised materials alone21,22 or only clay.23 In a previous paper,24 our
research group proposed preparation of carbon composite adsorbents for adsorption of C.I. Reactive Orange 16 (RO-16) and C.I. Reactive Red 120 (RR-120) dyes from the aqueous effluents. The carbon composite material was prepared from a mixture of inorganic components (71.5% red mud + 21.5% lime + 7.0% KOH) and coffee waste (organic material). The carbon composite materials with inorganic:organic ratio of 1.9 and 2.2 exhibited highest removal of the dyes. The carbon composite material showed higher sorption capacity than only carbonised coffee waste and red mud alone.24 Due to high sorption
capacity and efficiency demonstrated by carbon composite materials, it is interesting to investigate other inorganic compositions, and different inorganic to organic ratios. In the current manuscript, new carbon adsorbent materials with the inorganics (71.5% bentonite (BT) + 21.5% lime + 7.0% KOH) and coffee waste (organic agent) are proposed. Carbon composites with the inorganic to organic ratios ranging from 1.0 to 2.2 were prepared and used as adsorbents in the present study.
In this work, BT was used instead of red mud because BT will not release high contents of iron and titanium when treated with a 6.0 mol L−1 HCl.24 Similarly, BT is resistant
to acidic solutions (HCl treatment).
Preliminary experiments revealed that the carbon composite with inorganic:organic ratio of 1.3 (CC-1.3) gave better adsorption capacity for removal of reactive blue 19 (RB-19) and reactive violet 5 (RV-5) textile dyes from aqueous solutions. CC-1.3 was treated with a 6 mol L−1
HCl to investigate the improvements in the textural characteristics of the carbon composite material. Calcium carbonate in the lime was leached to improve the textural characteristics of the adsorbent (ACC-1.3). The CC-1.3 and ACC-1.3 were used for removal of RB-19 and RV-5 dyes from aqueous solutions. Effect of pH of dye solutions, kinetic study, equilibrium study and thermodynamics of adsorption were carried out on CC-1.3 and ACC-1.3. The adsorbents were also used for treatment of different simulated dye-house effluents.
Experimental
Solutions and reagents
Hydrochloric acid and NaOH were purchased from Vetec (Rio de Janeiro, Brazil) with analytical grade purity and used
without further purification. BT, with the following chemical compositions: SiO2 (66.2%); Al2O3 (21.0%); Fe2O3 (3.46%);
MgO (1.96%); CaO (5.1%); Na2O (0.68%); K2O (0.56%);
TiO2 (0.24%); P2O5 (0.06%); C (0.38%), was provided by
Bentonisa (João Pessoa, PB, Brazil) enterprises. Lime was furnished by Votorantim (Votorantim, SP, Brazil). Coffee waste was supplied by a coffee shop in the University.
Deionised water was used to prepare all solutions. The textile dyes, C.I. Reactive Blue 19 (RB-19; λ
max = 594 nm;
see Figure S1 in the Supplementary Information (SI) section) at 80% purity and C.I. Reactive Violet 5 dye (RV-5,
λmax = 545 nm; see Figure S2) at 85% purity, were supplied
by Sigma-Aldrich (St. Louis, M.O. USA). The preparation of stock solution of the dye (1.00 g L−1) was done by
accurately weighing a calculated amount of the dye and dissolving it in deionised water. The pH of the solutions was adjusted using a 0.10 mol L−1 sodium hydroxide solution
and/or a 0.10 mol L−1 hydrochloric acid solution using
Schott Lab 850 set pH meter.
Preparation and characterisation of carbon composites
The carbon composite adsorbents were prepared as described elsewhere.24 Briefly, a 40.0 g of inorganic matrix
(71.5% BT + 21.5% lime + 7.0% KOH) was added to a 52.0 g of coffee waste, and subsequently mixed with water to form a homogeneous paste. This proportion gave an inorganic:organic weight ratio of 1.3 (CC-1.3). The paste was transferred into a mould disc,24 subsequently dried in
an oven at 120 °C for 10 h. Afterwards, 8 dried discs were placed in a coiled stainless reactor under argon atmosphere at 100 mL min−1. The reactor inside the tubular furnace was
then heated at 20 °C min−1 up to 700 °C, and kept at this
temperature for 30 min. Afterwards, the carbon composite was cooled down to a room temperature under argon. After all these processes, the carbonised discs were milled, sieved and stored until use. This carbon composite adsorbent was labelled as CC-1.3. Other carbon composites with the inorganic:organic ratio of 1.0 (CC-1.0); 1.6 (CC-1.6); 1.9 (CC-1.9); 2.2 (CC-2.2) were prepared using the same procedure. A carbonised reference material without inorganic compounds (C-0) was also prepared while BT material without carbon fraction was named as BT.
In a bid to improve the textural characteristics of carbon composite, a 5.0 g of CC-1.3 was placed in a 500 mL beaker, a 200 mL of a 6 mol L−1 HCl was added and the
the carbon composite. The acid-treated carbon composite (ACC-1.3) was oven-dried at 110 °C for 5 h.
Scanning electron microscopy (SEM), (JEOL microscope, model JSM 6060, Tokyo, Japan) was used for characterisation of the CC-1.3 and ACC-1.3.
The CC-1.3 and ACC-1.3 adsorbents were also characterised using Fourier transform infra-red spectroscopy (FTIR) (Shimadzu Spectrometer, IR Prestige 21, Kyoto, Japan).
The N2 adsorption-desorption isotherms of CC-1.3
and ACC-1.3 were done at liquid nitrogen boiling point (−196 °C) using a surface analyser (Micromeritics
Instrument, TriStar II 3020).25
T h e r m o g r av i m e t r i c ( T G A ) a n d d e r iva t ive thermogravimetric (DTG) curves of CC-1.3 and ACC-1.3 were obtained on a PG Instruments model SDT Q600 with a heating rate of 10 °C min−1 at 100 mL min−1 of a nitrogen
flow. Temperature was varied from 20 °C to 1100 °C.24
The CC-1.3 and ACC-1.3 were also characterised using X-ray diffraction (XRD) (Philips X’pert MPD diffractometer, Amsterdam, Netherlands) operating at 40 kV and 40 mA with Cu Kα radiation (λ = 1.5406 Å).24
For determination of the point of zero charge (pHpzc),
a 20.00 mL of a 0.050 mol L−1 NaCl solution (with a
previously adjusted pH; the pH (pHi) values of the solutions
were adjusted from 1.0 to 14.0 by adding a 0.10 mol L−1
HCl and a 0.10 mol L−1 NaOH) was added to several
50 mL flat-bottom Falcon tubes containing a 50.0 mg of the adsorbent, which were immediately and securely capped. The suspensions were agitated in a thermostated shaker at 25 °C for 48 h for proper equilibration. The adsorbent was separated from the aqueous solution by centrifuging the suspensions at 15,000 rpm for 10 min. The pHi of
the solutions without adsorbent were recorded. The final pH values (pHf) of the supernatant after contact with the
adsorbents were also recorded. The value of pHpzc is the
point where the curve of ∆pH (pHf− pHi) versus pHi crosses
a line equal to zero.9
Batch adsorption studies
The batch adsorption experiments, to quantify the ability of CC-1.3 and ACC-1.3 composites to remove RB-19 and RV-5 dyes from aqueous solutions, were carried out in triplicate as described elsewhere.24
The concentrations of the unadsorbed dyes in the solution were measured using visible spectrophotometer (T90+ UV-VIS spectrophotometer, PG Instruments, London, United Kingdom) using optical quartz cells. Absorbance measurements of RB-19 and RV-5 dyes were made at maximum wavelengths of 594 and 545 nm, respectively.
The amounts of dye removed by CC-1.3 and ACC-1.3 were calculated using equation 1. The percentage of removal was evaluated using equation 2.
(
Co Cf)
q V
m −
= (1)
(
)
% 100 o f
o
C C
Removal
C −
= (2)
where q is the amount of dye removed by the adsorbent in mg g−1, C
o is the initial dye concentration in contact with
the adsorbent (mg L−1), C
f is the final dye concentration
(mg L−1) after the adsorption process, m is the mass of
adsorbent (g) and V is the volume of dye solution (L).
Statistical evaluation of kinetic and isotherm parameters
A nonlinear method, with successive interactions calculated by the Levenberg-Marquardt method, was used to fit the kinetic and equilibrium data. Interactions were also calculated using the Simplex method based on the nonlinear fitting facilities of the Microcal Origin 9.0 software. The models were evaluated using a determination coefficient (R2), an adjusted determination coefficient (R2
adj) and an
standard deviation (SD).26,27 The SD is a measurement of the
difference between the theoretical amount of dye removed by the adsorbent and the actual amount of dye measured experimentally. Equations 3, 4 and 5 are the mathematical expressions of R2, R2
adj and SD, respectively.
(
)
(
)
(
)
2 2
n n
i,exp i,exp i,exp i,model
2 i i
2 n
i,exp i,exp
i
q –q q –q
R =
q – q
∑
∑
∑
(3)(
)
2 2
adj
n- 1
R = 1 – 1 – R .
n-p
(4)
(
)
n 2
i,exp i,model i
1
SD = . q – q
n-p
∑
(5)qi,model is the individual theoretical value of q; qi,exp is the
individual measured value of q; –qexpis the average of q
measuredexperimentally; n is the number of experiments performed, and p is the number of parameters in the fitting model.27,28
Kinetic models
Pseudo-first order (equation 6),29 pseudo second-order
and intra-particle diffusion model (equation 9)32 were
employed to investigate and elucidate the kinetic studies.
(
1)
1 −exp
t e
q =q − ×k t (6)
( )
2e
t e
e q
q q
k q
= −
× +t 1
(7)
( )
(
)
1/11
1 1
e
t e n
n
N e
q
q q
k q t n
− −
= −
× × − +
(8)
t id
q =k t C+ (9)
where qt and qe are the sorption capacities at any time and
at equilibrium (mg g−1), respectively; k
1 is the
pseudo-first order rate constant (h−1); k
2 is the pseudo-second
order rate constant (g mg−1 h−1); k
N is the general order
rate constant [h−1 (g mg−1)n−1]; n is the order of adsorption
kinetics (dimensionless); t is the time of contact between the adsorbent and adsorbate (h); kid is the intra-particle
diffusion rate constant (mg g−1 h−0.5); and C is a constant
related to the thickness of boundary layer (mg g−1).
Equilibrium models
The equilibrium equations used in the present study are Langmuir (equation 10),33 Freundlich (equation 11),34 and
Liu (equation 12).35
max 1
L e
e
L e
Q K C
q
K C
⋅ ⋅
=
+ ⋅ (10)
1nF
e F e
q =K ⋅C (11)
max ( )
1 ( )
L
L
n
g e
e n
g e
Q K C
q
K C
⋅ ⋅
=
+ ⋅
(12)
where Qmax is the maximum adsorption capacity of the
adsorbent (mg g−1); K
L is Langmuir equilibrium constant
(L mg−1); K
F is the Freundlich equilibrium constant
[mg g−1 (mg L−1)-1/nF]; K
g is Liu equilibrium constant
(L mg−1) while n
F and nL are the Freundlich and Liu
exponents (dimensionless), respectively.
Simulated dye-house effluents
Four synthetic dye-house effluents were prepared as depicted in Table 1. Each synthetic dye-house effluent contained six representative textile dyes usually used for coloring fibres, and auxiliary chemicals that are largely used in the textile industries. It is known that about 10-60%1 of synthetic dyes and 100% of the auxiliary
chemicals are left in the spent dye bath, and the composition undergoes between 5-fold and 30-fold dilutions during the subsequent washing and rinsing stages.9-11,24,26,28,31 Table 1
shows the selected dyes and auxiliary chemicals that represent the exhausted dye bath with their corresponding concentrations.9-11,24,26,28,31
Table 1. Chemical composition of the simulated dyehouse effluents
Concentration / (mg L−1)
Effluent A Effluent B Effluent C Effluent D
Dye
Reactive blue 19 (λmax 594 nm) 60 120 5 10
Reactive violet 5 (λmax 545 nm) 5 10 60 120
Reactive orange 16 (λmax 489 nm) 5 10 5 10
Reactive red 120 (λmax 534 nm) 5 10 5 10
Cibacron brilliant yellow 3G-P (λmax 402 nm) 5 10 5 10
Procion blue MX-R (λmax 594 nm) 5 10 5 10
Auxiliary chemical
Na2SO4 80 160 80 160
NaCl 80 160 80 160
Na2CO3 50 100 50 100
CH3COONa 50 100 50 100
CH3COOH 600 600 600 600
pH 2 2 2 2
Results and Discussion
Preparation and characterisation of carbon composites
As earlier reported,24 lime was included to avoid
impregnation of the material with aqueous solution, which occurs in the preparation of chemically modified activated carbon.36,37 Lime gave garter between all the
paste-forming solid components that were put in the discs. Apart from lime, potassium hydroxide and BT formed part of inorganics. Potassium hydroxide has already been used as an activating agent in the production of activated carbons,38 and BT was used as adsorbent.39,40 The carbon
material produced at this step was labelled as CC. In another step, CC was treated with a 6 mol L−1 HCl to
remove calcium compounds in the CC carbon material. The inorganic components incorporated in the carbon material can hydrolysed the organic matrix and mediate the release of some volatile organic gases during the pyrolysis, thus weakening the particle of carbon material, which expands.18,39,40 Contradictorily, the inorganic components
of the carbon material occupy a volume inside the carbon matrix. This occupation inhibits the contraction of the carbon particle during the pyrolysis, thereby prevents the carbon material from being sintered.39,40 After acidic
treatment, part of the inorganic component was leached from the carbon matrix, generating a carbon material with suitable porosity.28,36 Although chemically modified
activated carbons are different from carbon composites, some similarities exist. The major difference is that the majority of the inorganic activating materials are leached from chemically modified activated carbon unlike the carbon composites proposed in this work. The inclusion of clay in our adsorbents is to improve sorption capacities.24
Different adsorbents were tested for the removal of 150.0 mg L−1 of RB-19 and RV-5 dyes from aqueous
solutions (see Figure S3). It was observed that the carbonised coffee waste (C-0) at 700 °C has the lowest percentage removal of dyes (30.60% for RB-19 and 28.84% for RV-5) among all adsorbents used in this study. Non-inclusion of inorganic components in the carbonisation of the coffee waste led to generation of huge amount of tar-oil that blocks the pores of the carbon material. The BT exhibited percentage removal of 40.62%, and 38.31% for RB-19 and RV-5 dyes, respectively. The BT and coffee-waste carbon composites showed minimal percentage removal of 64.32 and 60.74% for RB-19 and RV-5 dyes, respectively. The results showed that different carbonised mixtures of coffee waste and inorganic components have higher sorption capacities than BT and carbonized coffee waste alone. The highest percentage of dye removal was
obtained with CC-1.3. Therefore, CC-1.3 was chosen to continue the rest of the experimental work.
The CC-1.3 carbon composite was treated with a 6.0 mol L−1 HCl to obtain ACC-1.3 adsorbent material;
acidification improves the adsorption efficiency of CC-1.3. Both CC-1.3 and ACC-1.3 were characterised using analytical techniques.
The textural properties of respective CC-1.3 and ACC-1.3 obtained from nitrogen adsorption/desorption curves are superficial area (SBET), 16.8 and 173 m2 g−1;
average pore radius (BJH), 13.91 and 5.12 nm; and total pore volume, 0.0473 and 0.170 cm³ g−1. Figure S4 shows
the graphs of BJH pore diameter distribution. Looking closely at these graphs, it can be seen that CC-1.3 has higher pore diameter than ACC-1.3. However, the two adsorbents possessed mesopores (pores with diameter 2-50 nm) that are capable of dye adsorption.28 Comparison
of the textural properties of CC-1.3 and ACC-1.3 showed that acidification produced an adsorbent (ACC-1.3) with better textural features for adsorption of dye.28 The surface
area and total pore volume of ACC-1.3 were increased by 10.3-fold and 3.6-fold, respectively, compared with CC-1.3. Higher adsorption capacity of ACC-1.3 can be attributed to the improvements in its textural features.28
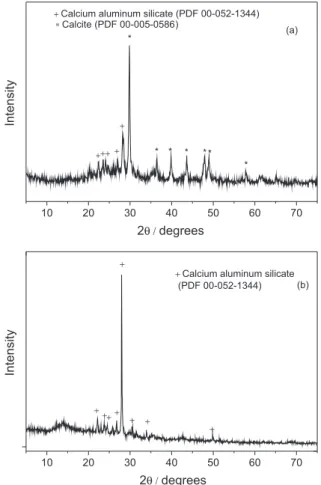
Figures 1a and 1b show the X-ray diffractograms of the CC-1.3 and ACC-1.3, respectively. The prepared powder of CC-1.3 shows three peaks (Figure 1a): 29.83°, 39.83° and 43.59° corresponding to (1 0 4), (1 1 3) and (2 0 2), respectively, reflections of calcite. syn. (Ref. JCPDS Card 00-005-0586; CaCO3). Two major intense peaks of calcium
aluminium silicate phase (JCPDS Card 00-052-1344; Ca0.88S0.12Al1.77Si2.23O8) at 22.17° and 28.01°, which
correspond to (−2 0 2) and (0 0 4) reflections, respectively,
were also detected. The X-ray diffraction spectrum of ACC-1.3 (Figure 1b) shows the presence of the two major intense peaks at 22.18° and 28.01° that correspond to respective (−2 0 2) and (0 0 4) reflections of phase calcium
aluminium silicate phase. It was noticed that the calcite was eliminated in ACC-1.3 due to acidification. These data are in good agreement with the superficial area and total pore volume described above.
Figures 2a and 2b present the thermogravimetric profiles of CC-1.3 and ACC-1.3, respectively. The DTG curve of CC-1.3 shows just a steep decomposition step at 720 °C. Following DTG curves, the TG curves are divided into four parts. The first from 20 °C to 140 °C, a mass loss of 2.5% that is compatible with the loss of water.3 The mass
A residual mass of about 78.2% at 1100 °C, which should be the inorganic fraction of the carbon composite and the other part of undecomposed organic compounds, was observed. Though the thermogravimetric profile of ACC-1.3 is different from that of CC-1.3 (see Figure 2b), the final residual mass of ACC-1.3 is 75.7%. Three decomposition regions (92 °C, 246 °C and 648-723 °C) were observed on DTG curves of ACC-1.3. Following the DTG curves, the TG curves are divided into four parts. From 10 °C to 120 °C, the mass loss of 8.2% is given to water molecule. The humidity of ACC-1.3 is higher than that of CC-1.3. From 120 °C to 270 °C, there is a mass loss of 1.8% that could be attributed to water molecules that were captured in the carbonaceous matrix.28 From
270 °C to 850 °C, the mass loss is only 9.7% that could be attributed to the partial decomposition of carbon skeleton;41
and there is an additional mass loss of 4.6% from 850 °C to 1090 °C. The total mass loss from 270 °C to 1090 °C is 14.3%, however, this mass loss pattern is different from that of CC-1.3. It is observed that the mass loss patterns of ACC-1.3 are gradual and continuous, and different from those of CC-1.3. The useful piece of information obtained from the thermogravimetric analysis is that both CC-1.3 and ACC-1.3 have high content of inorganic matrix.
Taking into account the XRD (Figure 1a) and TGA/DTA of CC-1.3 (Figure 2a), it can be concluded that CC-1.3 and ACC-1.3 are not activated carbons, but carbon composite (inorganic + organic) materials.
The SEM images of CC-1.3 and ACC-1.3 are shown in Figure S5.These images reveal that CC-1.3 and ACC-1.3 have similar textural properties. They lost their fibrous characteristics during pyrolysis.28 The roughness of the
carbon materials are apparent (see Figure S5). The striking differences are that the carbon particles of CC-1.3 are of higher dimensions, and the granules are more aggregated. CC-1.3 is more of a crystal. Contrarily, ACC-1.3 has small pieces of carbon with higher void spaces among the particles.
FTIR technique was employed to investigate the functional groups present in CC-1.3 and ACC-1.3 and identify the groups that are responsible for adsorption of RB-19 and RV-5 dyes. The FTIR spectra of the adsorbents were recorded in the range 4000-400 cm−1 (see Figure S6).
The FTIR spectra of CC-1.3 and ACC-1.3 are somewhat different (see Figure S6) because CC-1.3 has more vibrational bands than ACC-1.3. The main vibrational bands observed for CC-1.3 are: 3411 cm−1 which is
assigned to O−H stretch; 1774 cm−1 which is assigned
10 20 30 40 50 60 70
+ Calcium aluminum silicate (PDF 00-052-1344)
*
∗ Calcite (PDF 00-005-0586)
+ + + + * * * * * Intensit y
2θ / degrees *
+
(a)
10 20 30 40 50 60 70
+ + + + + +
+ Calcium aluminum silicate (PDF 00-052-1344)
+
Intensit
y
2θ / degrees +
(b)
Figure 1. X-ray diffractogram of (a) CC-1.3 and (b) ACC-1.3.
0 200 400 600 800 1000 1200
70 75 80 85 90 95 100 0.0 0.1 0.2 0.3 0.4 0.5 W e ig h t loss / %
Temperature / °C
720° 20° 140° -2.5% 540° 850° -14.0% -2.0% 1100 ° -3.3% 50° -21.8% -17.3% Deriv. weigh t / (% °C -1 ) (a)
0 200 400 600 800 1000 1200
70 75 80 85 90 95 100 0.00 0.05 0.10 0.15 0,20 W e ig h t loss / %
Temperatura / °C
92.0° 246° 723° 648° 10° 120° -8.2% 270° -1.8% 1090 ° 850° -24.3% -10.0% -9.7% -4.6% (b) Deriv. weigh t / (% °C -1 )
Figure 2. TGA and DTG curves of (a) CC-1.3 and (b) ACC-1.3.
0 200 400 600 800 1000 1200
70 75 80 85 90 95 100 0.0 0.1 0.2 0.3 0.4 0.5 W e ig h t loss / %
Temperature / °C
720° 20° 140° -2.5% 540° 850° -14.0% -2.0% 1100 ° -3.3% 50° -21.8% -17.3% Deriv. weigh t / (% °C -1 ) (a)
0 200 400 600 800 1000 1200
70 75 80 85 90 95 100 0.00 0.05 0.10 0.15 0,20 W e ig h t loss / %
Temperatura / °C
to asymmetric stretch of ester or anhydride; 1720 cm−1
that is assigned to C=O stretch of carboxylic acid or anhydride; 1625 and 1538 cm−1 that are assigned to rings
mode of aromatics; 1434 cm−1 is assigned to C−O stretch
of inorganic carbonate; 1376 cm−1 that is assigned to O−H
bending of phenol, alcohol; 1244 cm−1 that is assigned to
C−O stretch of phenols; 1074 and 1004 cm−1 are assigned
to C−O stretch of alcohols or Si−O stretch of silicates; 892 cm−1 is assigned to inorganic carbonate and 662 cm−1
is assigned to C−H out of plane bends of aromatic rings.26-28
For ACC-1.3 carbon adsorbent, the following vibrational bands are observed: 3400 cm−1 that is assigned to O−H
stretch; 1625 and 1530 cm−1 are assigned to ring mode
of aromatics, 1080 cm−1 are assigned to C−O stretch of
alcohols or Si−O stretch of silicates; 813 and 657 cm−1 are
assigned to C−H out of plane bends of aromatic rings.26-28
Effects of pH on adsorption
One of the major factors affecting the adsorption of a dye on an adsorbent is the pH of the adsorbate solution.3,11,15
Dyes have different ranges of suitable pH depending on the type of adsorbent under consideration. The effects of pH on removal of RB-19 and RV-5 from aqueous solutions (150 mg L−1) using CC-1.3 and ACC-1.3 were carried out
in the pH range of 2 and 10 (see Figure S7). The carbon adsorbents behaved differently in relation to pH of dye solutions. The percentage of removal decreases from 80.7% (pH 2.0) to 29.9% (pH 10.0) for RB-19 dye, and from 99.2% (pH 2.0) to 73.2% (pH 10.0) for CC-1.3 and ACC-1.3, respectively. Similarly, the percentage of removal of RV-5 dye decreases from 72.8% (pH 2.0) to 20.9% (pH 10.0) and from 98.2% (pH 2.0) to 70.9% (pH 10.0) for CC-1.3 and ACC-1.3, respectively. These remarkable differences in the behaviour of adsorbents in relation to the pH of the dye solutions could be linked to the pHpzc values of
the adsorbents. The CC-1.3 and ACC-1.3 have pHpzc values
of 12.23 and 2.59, respectively (see Figure S8). Adsorbent with pH value lower than pHpzc value will possess positive
surface charge.9 Both RB-19 and RV-5 dyes have negative
charges in solutions (see Figure S1 and S2). Adsorptions of RB-19 and RV-5 will take place when the surface charge of the adsorbent is positive. For CC-1.3, the electrostatic interaction occurs at pH < 12.23, but this interaction takes place at pH < 2.59 for ACC-1.3. However, the lower the pH value from the pHpzc value, the more positive the surface
of the adsorbent.9 The pH of adsorbate solution was fixed
at 2.0 for the rest of our experimental work.
The pH values of adsorbate solution after the adsorption experiments were measured. For RB-19 and RV-5 using CC-1.3 adsorbent, the final pH varied from 7.0 to 7.8, and
for ACC-1.3, the final pH of adsorbate solution varied from 2.0 to 2.3. These observations agreed with the values of pHpzc. The ∆pH (pHfinal – pHinitial) ranges from 5.0 to 5.8
for CC-1.3 with a basic solid surface (pHpzc 12.23) while
the ∆pH is only 0.3 for ACC-1.3 with acidic solid surface
(pHpzc 2.59). This phenomenon explains the decrease in
percentage removal of RB-19 (−26.0%) and RV-5 (−27.3%)
using ACC-1.3 compared to a decrease in percentage removal of 50.8% (RB-19) and 51.9% (RV-5) for CC-1.3. Based on the observation from pH studies, it is anticipated that the adsorption capacity of ACC-1.3 would be greater than that of CC-1.3.
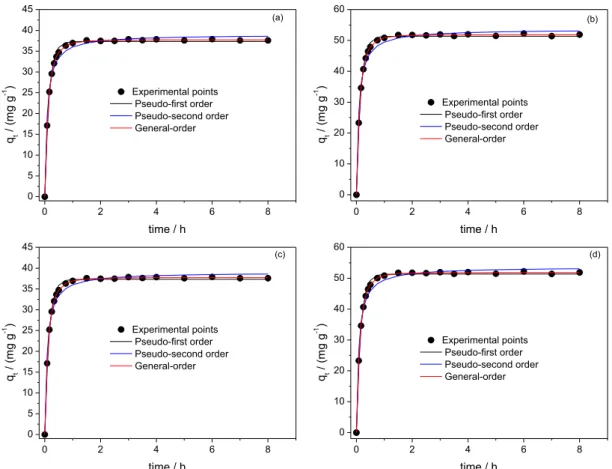
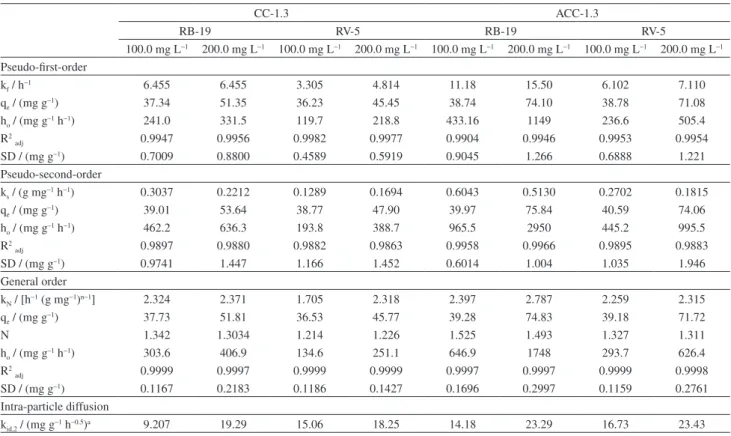
Kinetic studies
The kinetic of adsorption of RB-19 and RV-5 dyes onto CC-1.3 and ACC-1.3 are presented in Figures 3 and 4. Nonlinear pseudo-first order, pseudo-second order and general order kinetic models were used to investigate kinetic of adsorption. Table 2 presents the fitting parameters of the kinetic models. SD was used to evaluate the fit of the experimental data because of the usage of nonlinear kinetic models. The higher the SD value, the higher the difference between the values of theoretical q and experimental q, and vice versa9-11 (see equation 5). It is known42,43 that the
best fit of the results depends on the number of parameters present in nonlinear equations. Because of this established fact, the number of fitting parameters should be taking into consideration while evaluating SD. Therefore, SD used in this work takes into consideration the number of fitting parameters (p term of equation 5). The SD of each model was divided by the SD of the minimum value (SD ratio) to allow comparison of different kinetic models. It was observed that the least SD values were obtained with the general order kinetic model. The SD ratio values of pseudo-first order kinetic model vary from 4.03 to 6.01 (CC-1.3) for the dye RB-19 and from 4.23 to 5.33 (ACC-1.3), while the corresponding values of the pseudo-second order model vary from 6.63 to 8.35 (CC-1.3) and from 3.35 to 3.55 (ACC-1.2). For RV-5 dye, the SD ratio values of pseudo-first order kinetic model vary from 3.87 to 4.15 (CC-1.3) and from 4.42 to 5.94 (ACC-1.3). Correspondingly, the SD ratio values of pseudo-second order model vary from 9.83 to 10.18 (CC-1.3) and from 7.05 to 8.93 (ACC-1.3). Based on the values of SD ratio, the general order kinetic model better explains the adsorption process of RB-19 and RV-5 onto CC-1.3 and ACC-1 than pseudo-first order and pseudo-second order kinetic models.
0 2 4 6 8 0 5 10 15 20 25 30 35 40 45 Experimental points Pseudo-first order Pseudo-second order General-order qt / (m g g -1 )
time / h
(a)
0 2 4 6 8
0 10 20 30 40 50 60 Experimental points Pseudo-first order Pseudo-second order General-order qt / (m g g -1 )
time / h
(b)
0 2 4 6 8
0 5 10 15 20 25 30 35 40 45 Experimental points Pseudo-first order Pseudo-second order General-order qt / (m g g -1 )
time / h
(c)
0 2 4 6 8
0 10 20 30 40 50 60 Experimental points Pseudo-first order Pseudo-second order General-order qt / (m g g -1 )
time / h
(d)
Figure 3. Kinetic isotherm curves of RB-19 dye. (a) 100.0 mg L−1 dye and CC-1.3; (b) 200.0 mg L−1 dye and CC-1.3; (c) 100.0 mg L−1 dye and ACC-1.3;
(d) 200.0 mg L−1 dye and ACC-1.3. Conditions: initial pH 2.0; temperature 25 °C; adsorbent mass 50.0 mg.
0 2 4 6 8
0 5 10 15 20 25 30 35 40 Experimental points Pseudo-first order Pseudo-second order General-order qt / (m g g -1 )
time / h
(a)
0 2 4 6 8
0 10 20 30 40 50 Experimental points Pseudo-first order Pseudo-second order General-order qt / (m g g -1 )
time / h
(b)
0 2 4 6 8
0 10 20 30 40 Experimental points Pseudo-first order Pseudo-second order General-order qt / (m g g -1 )
time / h
(c)
0 2 4 6 8
0 10 20 30 40 50 60 70 80 Experimental points Pseudo-first order Pseudo-second order General-order qt / (m g g -1 )
time / h
(d)
Figure 4. Kinetic isotherm curves of RV-5 dye. (a) 100.0 mg L−1 dye and CC-1.3; (b) 200.0 mg L−1 dye and CC-1.3; (c) 100.0 mg L−1 dye and ACC-1.3;
(d) 200.0 mg L−1 dye and ACC-1.3. Conditions: initial pH 2.0; temperature 25 °C; adsorbent mass 50.0 mg.
0 2 4 6 8
0 5 10 15 20 25 30 35 40 45 Experimental points Pseudo-first order Pseudo-second order General-order qt / (m g g -1 )
time / h
(a)
0 2 4 6 8
0 10 20 30 40 50 60 Experimental points Pseudo-first order Pseudo-second order General-order qt / (m g g -1 )
time / h
(b)
0 2 4 6 8
0 5 10 15 20 25 30 35 40 45 Experimental points Pseudo-first order Pseudo-second order General-order qt / (m g g -1 )
time / h
(c)
0 2 4 6 8
0 10 20 30 40 50 60 Experimental points Pseudo-first order Pseudo-second order General-order qt / (m g g -1 )
time / h
(d)
0 2 4 6 8
0 5 10 15 20 25 30 35 40 Experimental points Pseudo-first order Pseudo-second order General-order qt / (m g g -1 )
time / h
(a)
0 2 4 6 8
0 10 20 30 40 50 Experimental points Pseudo-first order Pseudo-second order General-order qt / (m g g -1 )
time / h
(b)
0 2 4 6 8
0 10 20 30 40 Experimental points Pseudo-first order Pseudo-second order General-order qt / (m g g -1 )
time / h
(c)
0 2 4 6 8
0 10 20 30 40 50 60 70 80 Experimental points Pseudo-first order Pseudo-second order General-order qt / (m g g -1 )
time / h
reaction is experimentally measured9-11,18,24,28,31 instead of
being restrained by a given model.
The kinetic of adsorption of RB-19 dye on CC-1.3 and ACC-1.3 are faster than those of RV-5. The following average rates were obtained when the rate constant of general order (kN) of RB-19 dye was divided by rate
constant of general order of RV-5 dye: 1.19 (CC-1.3) and 1.13 (ACC-1.3). Considering the van der Waals surface area of both dyes (see Figures S1 and S2) and making a ratio; A RV-5/A RB-19 = 1.14 (A represents van der Walls surface area). The dimension of the dye explains part of the explanation why the kinetic of RB-19 is faster than that of RV-5 dye. The lower the molecular dimension (molecular area), the faster the rate of reaction since the number of effective shocks between the dye molecules and the active sites of the adsorbent will be higher.
The intra-particle diffusion model32 was used to verify
the effect of mass transfer resistance on the binding of RB-19 and RV-5 dyes onto the CC-1.3 and ACC-1.3 (Table 2 and Figures S9 and S10). The intra-particle diffusion constant, kid (mg g−1 h−0.5) was obtained from the
slope of the plot of qt vs. t. The plots of qtvs. t are
presented in Figures S9 and S10 with three linear sections for the two dyes onto CC-1.3 and ACC-1.3. These plots revealed that the adsorption processes required more than
one adsorption rate.3,15,24 CC-1.3 and ACC-1.3 showed three
stages of adsorption process, each stage is attributed to each linear portion of the plots as shown in Figures S9 and S10. The first linear section, the fastest sorption stage, can be ascribed to the process in which dye molecules diffuse to the surface of the adsorbents.3,15,24 The second section, a delayed
process, can be attributed to intra-particle diffusion.3,15,24 The
third section may be regarded as diffusion through smaller pores, followed by the establishment of equilibrium.3,15,24
Perusing at the first point of the third portion, the minimum contact time to attain the equilibrium is 1.0 h for RB-19 dye, but 1.5 h for RV-5 dye. The molecular sizes of the dyes support these observations.
The contact time of 2.0 h was used for the rest of our experimental work for the two dyes. The increment in contact time used in this work will ensure attainment of equilibrium by both dyes even at higher dye concentrations.18,19
Equilibrium studies
Adsorption isotherm gives description of the existing relationship between qe, the amount of adsorbate adsorbed
by the adsorbent and Ce, the adsorbate concentration
remaining in solution after equilibrium is reached at a constant temperature. The adsorption parameters of
Table 2. Kinetic parameters for removal of RB-19 and RV-5 by CC-1.3 and ACC-1.3. Conditions: temperature 298 K; pH 2.0; mass of adsorbent 50.0 mg
CC-1.3 ACC-1.3
RB-19 RV-5 RB-19 RV-5
100.0 mg L−1 200.0 mg L−1 100.0 mg L−1 200.0 mg L−1 100.0 mg L−1 200.0 mg L−1 100.0 mg L−1 200.0 mg L−1
Pseudo-first-order
kf / h−1 6.455 6.455 3.305 4.814 11.18 15.50 6.102 7.110
qe / (mg g−1) 37.34 51.35 36.23 45.45 38.74 74.10 38.78 71.08
ho / (mg g–1 h−1) 241.0 331.5 119.7 218.8 433.16 1149 236.6 505.4
R2
adj 0.9947 0.9956 0.9982 0.9977 0.9904 0.9946 0.9953 0.9954
SD/ (mg g−1) 0.7009 0.8800 0.4589 0.5919 0.9045 1.266 0.6888 1.221
Pseudo-second-order
ks / (g mg−1 h−1) 0.3037 0.2212 0.1289 0.1694 0.6043 0.5130 0.2702 0.1815
qe / (mg g−1) 39.01 53.64 38.77 47.90 39.97 75.84 40.59 74.06
ho / (mg g–1 h−1) 462.2 636.3 193.8 388.7 965.5 2950 445.2 995.5
R2
adj 0.9897 0.9880 0.9882 0.9863 0.9958 0.9966 0.9895 0.9883
SD/ (mg g−1) 0.9741 1.447 1.166 1.452 0.6014 1.004 1.035 1.946
General order
kN / [h−1 (g mg−1)n−1] 2.324 2.371 1.705 2.318 2.397 2.787 2.259 2.315
qe / (mg g−1) 37.73 51.81 36.53 45.77 39.28 74.83 39.18 71.72
N 1.342 1.3034 1.214 1.226 1.525 1.493 1.327 1.311
ho / (mg g–1 h−1) 303.6 406.9 134.6 251.1 646.9 1748 293.7 626.4
R2
adj 0.9999 0.9997 0.9999 0.9999 0.9997 0.9997 0.9999 0.9998
SD/ (mg g−1) 0.1167 0.2183 0.1186 0.1427 0.1696 0.2997 0.1159 0.2761
Intra-particle diffusion
kid,2 / (mg g−1 h−0.5)a 9.207 19.29 15.06 18.25 14.18 23.29 16.73 23.43
the equilibrium models provide underlying principles about the adsorption mechanism, surface properties and affinity between adsorbent and the adsorbate. Langmuir,33
Freundlich,34 and Liu35 isotherms were tested in this work.
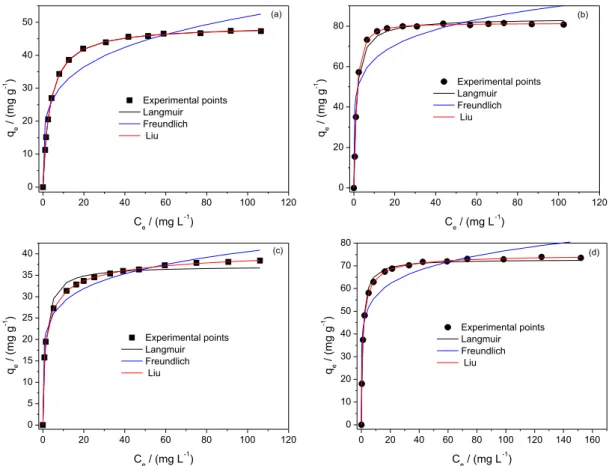
Adsorption isotherms were carried out between 25 °C and 50 °C under the optimum experimental conditions previously discussed above (see Table 3 and Figure 5). The adsorption isotherms of RB-19 and RV-5 dyes onto CC-1.3 and ACC-1.3 at 25 °C are shown inFigure 5. The Liu model best described adsorption of RB-19 and RV-5 dyes onto CC-1.3 and ACC-1.3 at all experimental temperatures based on the SD values presented in Table 3. The lowest SD value of this model is an indication that the experimental q and the theoretical q of the model are closer.
SD ratio was obtained by dividing the SD of each model by the least SD value. This ratio was used to compare the suitability of equilibrium isotherm models used in this study. The Freundlich model has SD ratio values ranging from 15.68 to 26.03 (CC-1.3) and from 9.01 to 46.11 (ACC-1.3) for RB-19 dye. The corresponding values for Langmuir model varied from 1.07 to 24.11 (CC-1.3) and from 1.99 to 28.75 (ACC-1.3). Freundlich model has SD ratio values ranging from 5.57 to 21.44 (CC-1.3) and 4.88 to 36.10 (ACC-1.3) for RV-5 dye. Similarly, Langmuir
model has SD ratio values ranging from 4.14 to 24.86 (CC-1.3) and from 3.97 to 18.43 (ACC-1.3) for RV-5 dye. The SD ratio analyses showed that the Liu isotherm model best described the equilibrium of adsorption of RB-19 and RV-5 dyes on the CC-1.3 and ACC-1.3 (25-50 °C).
The values of Qmax, maximum amounts of RB-19
and RV-5 dyes adsorbed, are 63.59 mg g−1 (CC-1.3) and
110.6 mg g−1 (ACC-1.3) for RB-19 dye, and 54.34 mg g−1
(CC-1.3) and 94.32 mg g−1 (ACC-1.3) for RV-5 dye at
25 °C. Qmax values of RB-19 dye adsorbed on CC-1.3
and ACC-1.3 are on the average of 17.21% (CC-1.3) and 13.04% (ACC-1.3) higher than those of RV-5. Moreover, the kinetic of adsorption of RB-19 are 19.30% (CC-1.3) and 13.25% (ACC-1.3) faster than those of RV-5. The sizes of the dye molecules explain why the kinetic of RB-19 is faster for the CC-1.3 and ACC-1.3. Better adsorption capacity of RB-19 onto CC-1.3 and ACC-1.3 can also be attributed to the sizes of dye molecules. Summarily, the average maximum adsorption capacities of ACC-1.3 are 70.36% (RB-19) and 76.68% (RV-5) higher than those of CC-1.3. Improvements in textural characteristics (superficial area and total pore volume) of the ACC-1.3 after the acidification of CC-1.3 are responsible for better adsorption capacity, as earlier reported.24,28
Experimental points Langmuir Freundlich
Liu
0 20 40 60 80 100 120
0 10 20 30 40 50 qe / (m g g -1 )
Ce/ (mg L-1)
(a)
0 20 40 60 80 100 120
0 20 40 60 80 Experimental points Langmuir Freundlich Liu qe / (m g g -1 )
Ce/ (mg L-1)
(b)
0 20 40 60 80 100 120
0 5 10 15 20 25 30 35 40 Experimental points Langmuir Freundlich Liu qe / (m g g -1 ) C
e/ (mg L -1
)
(c)
0 20 40 60 80 100 120 140 160 0 10 20 30 40 50 60 70 80 Experimental points Langmuir Freundlich Liu qe / (m g g -1 ) C
e/ (mg L -1
)
(d)
Figure 5. Isotherm curves of RB-19 (a, b) and RV-5 (c, d) dyes on CC-1.3 (a, c) and ACC-1.3 (b, d) at 50 °C. Conditions: initial pH 2.0; adsorbent mass
50.0 mg; contact time 2.0 h.
Experimental points Langmuir Freundlich
Liu
0 20 40 60 80 100 120
0 10 20 30 40 50 qe / (m g g -1 )
Ce/ (mg L-1)
(a)
0 20 40 60 80 100 120
0 20 40 60 80 Experimental points Langmuir Freundlich Liu qe / (m g g -1 )
Ce/ (mg L-1)
(b)
0 20 40 60 80 100 120
0 5 10 15 20 25 30 35 40 Experimental points Langmuir Freundlich Liu qe / (m g g -1 )
Ce/ (mg L-1)
(c)
0 20 40 60 80 100 120 140 160
0 10 20 30 40 50 60 70 80 Experimental points Langmuir Freundlich Liu qe / (m g g -1 )
Ce/ (mg L-1)
Thermodynamics studies
The thermodynamic parameters, Gibb’s free energy change (∆G°, kJ mol−1), enthalpy change (∆H°, kJ mol−1)
and entropy change (∆S°, J mol−1 K−1), were computed
using equations 14-16.
∆G ° = ∆H ° − ∆T S (14)
∆G°= −RTln K
( )
(15)Combination of equations 14 and 15 gives equation 16.
1 ln
( )
K = S° H°R R T
∆ ∆
− × (16)
In these equations, R is the universal gas constant (8.314 J K−1 mol−1), T is the absolute temperature (Kelvin),
K represents that adsorption constants of the isotherm fits (Kg, Liu equilibrium constant, which must be converted to
SI units using the molecular mass of the dye) obtained from the isotherm plots. Different isotherm models give different equilibrium constants, K.6,9-11,24,26,28-31,43-45 Thermodynamic
parameters can also be evaluated from the Liu equilibrium constant, Kg.9,10,24,28,29,31
The ∆H°value can be evaluated from the slope of the linear plot of ln(K) versus T−1 while ∆S° value is obtainable
from the intercept of the same plot.
The thermodynamic data are presented inTable 4. The R2 values of the linear fits are closer to unity, indicating
that the calculated values of enthalpy and entropy for both
Table 3. Isotherm parameters for RB-19 and RV-5 adsorption using CC-1.3 and ACC-1.3. Conditions: pH 2.0; adsorbent mass 50.0 mg; contact time 2.0 h
CC-1.3 ACC-1.3
25 °C 30 °C 35 °C 40 °C 45 °C 50 °C 25 °C 30 °C 35 °C 40 °C 45 °C 50 °C
RB-19 Langmuir
Qmax / (mg g−1) 50.91 56.82 49.65 48.31 46.85 49.08 81.44 95.97 87.01 93.43 88.71 83.77
KL / (L mg−1) 2.418 0.7017 0.7648 0.5289 0.4178 0.2910 7.054 1.678 1.593 1.049 0.8937 0.7607
R2
adj 0.9249 0.9874 0.9634 0.9757 0.9872 0.9999 0.9032 0.9800 0.9731 0.9993 0.9996 0.9920
SD / (mg g−1) 4.729 1.922 2.969 2.350 1.824 0.1815 7.735 4.292 4.228 0.6962 0.5288 2.388
Freudlich
KF / [mg g–1 (mg L−1)−1/nF] 29.45 30.53 26.29 23.91 20.45 19.06 57.01 57.18 53.23 58.24 50.04 45.07
nF 7.475 6.926 6.630 6.196 5.284 4.609 9.993 7.202 7.952 8.500 7.087 6.677
R2
adj 0.9682 0.9502 0.9676 0.9590 0.9444 0.9190 0.9905 0.9417 0.9740 0.9066 0.8955 0.8457
SD / (mg g−1) 3.075 3.826 2.798 3.056 3.803 4.432 2.424 7.336 4.156 8.169 8.710 10.51
Liu
Qmax / (mg g−1) 63.59 60.90 58.32 54.27 51.31 48.90 110.6 104.1 98.33 92.67 88.00 81.37
Kg / (L mg−1) 0.7251 0.6052 0.5023 0.4233 0.3510 0.2934 1.592 1.378 1.195 1.036 0.9023 0.7879
nL 0.3929 0.6779 0.4954 0.5834 0.6588 1.017 0.2670 0.6238 0.5097 1.087 1.070 1.359
R2
adj 0.9999 0.9998 0.9999 0.9999 0.9998 0.9999 0.9999 0.9999 0.9999 0.9998 0.9999 0.9999
SD / (mg g−1) 0.1961 0.2211 0.1637 0.1649 0.2009 0.1703 0.2690 0.1591 0.3069 0.3505 0.2149 0.2874
RV-5 Langmuir
Qmax / (mg g−1) 43.86 39.68 47.07 40.14 35.72 37.19 77.77 74.83 87.44 83.96 72.09 72.93
KL / (L mg−1) 1.731 1.919 0.7039 0.7047 1.063 0.7362 1.778 4.060 1.877 1.371 1.311 0.9677
R2
adj 0.9367 0.9588 0.9966 0.9850 0.9566 0.9822 0.9729 0.9263 0.9983 0.9952 0.9769 0.9945
SD / (mg g−1) 3.268 2.263 0.7248 1.284 2.610 1.438 3.412 6.078 1.255 1.739 3.263 1.189
Freudlich
KF / [mg g-1 (mg L−1)−1/nF] 27.66 26.00 30.09 25.39 19.76 20.40 55.69 50.28 54.65 54.01 43.59 42.02
nF 8.172 8.890 9.527 9.046 6.699 6.713 12.07 9.603 8.735 9.567 8.307 7.647
R2
adj 0.9822 0.9926 0.9760 0.9911 0.9704 0.9699 0.9944 0.9775 0.8577 0.8596 0.9600 0.9083
SD / (mg g−1) 1.735 0.9597 1.910 0.9887 2.154 1.867 1.550 3.540 11.40 9.367 4.296 6.865
Liu
Qmax / (mg g−1) 54.34 51.54 48.94 46.47 44.17 42.17 94.32 90.35 86.34 82.55 78.88 75.30
Kg / (L mg−1) 1.006 0.8916 0.7954 0.7189 0.6296 0.5407 2.235 1.864 1.572 1.325 1.119 0.9480
nL 0.3885 0.3365 0.7379 0.4763 0.4132 0.5795 0.3259 0.3734 1.408 1.272 0.5629 0.7865
R2
adj 0.9998 0.9998 0.9998 0.9997 0.9999 0.9999 0.9998 0.9998 0.9999 0.9999 0.9998 0.9999
adsorbents are reliable. The magnitude of enthalpy was also consistent with a physical adsorption for RB-19 and RV-5 dyes onto CC-1.3 and ACC-1.3.40 The magnitude of
enthalpy change can be used to specify type of interaction between adsorbate and adsorbent. The physical sorption is generally < 35 kJ mol−1.46 The values of enthalpy change
(∆H°) show that the adsorption processes of the two dyes onto CC-1.3 and ACC-1.3 are exothermic. Negative values of ∆G° imply that the adsorption process is spontaneous as well as a favourable process. The positive values of ∆S° suggest an increase in the randomness at the solid/liquid interface. The water coordinated molecules are displaced by dye molecules, thereby gaining more translational entropy than what is lost by dye molecules (this takes place during adsorption) leading to an increment in randomness of the dye-adsorbent interaction.47,48
Simulated dye-house effluents
Four simulated dye-house effluents were prepared and used (see Table 1) to investigate the capacities of CC-1.3
and ACC-1.3 to remove dyes from real industrial textile effluents. The UV-Vis spectra of the treated and untreated effluents were recorded from 300 to 800 nm (Figure 6). The percentage of the mixture of dyes removed from the simulated dye effluents is a function of the area under the absorption band from 300 to 800 nm. The ACC-1.3 carbon composite adsorbent show excellent performance for the treatment of simulated effluents unlike CC-1.3.
The percentages of removal for ACC-1.3 are 97.71%, 95.30%, 95.31% and 93.38% for effluents A, B, C, and D, respectively. The corresponding percentages for CC-1.3 are 61.58%, 52.15%, 59.72% and 54.37%. The ACC-1.3 carbon composite shows promising performance in the treatment of simulated dye effluents compared with published data using different adsorbents.9-11,24,26,28,31,43
Based on the simulated effluent data, it is safe to conclude that ACC-1.3 carbon adsorbent can be undoubtedly used for the treatment of industrial or textile effluents. However, CC-1.3 adsorbent showed moderate performance for treatment of simulated dye-house effluents, this performance could be linked to its worse
Table 4. Thermodynamic parameters of the adsorption of RB-19 and RV-5 dyes on CC-1.3 and ACC-1.3. Conditions: mass of adsorbent 50.0 mg; pH 2.0; contact time 2.0 h. The Kgvalue was converted to SI units using the molar mass of each dye
Temperature / K
298 303 308 313 318 323
RB-19 CC-1.3
Kg / (L mol−1) 4.54 × 10⁵ 3.79 × 10⁵ 3.15 × 10⁵ 2.65 × 10⁵ 2.20 × 10⁵ 1.84 × 10⁵
∆G / (kJ mol−1) −32.27 −32.36 −32.42 −32.50 −32.52 −32.55
∆H° / (kJ mol−1) −28.93 − − − − −
∆S° / (J K−1 mol−1) 11.29 − − − − −
R2 0.9994
ACC-1.3
Kg / (L mol−1) 9.98 × 10⁵ 8.63 × 10⁵ 7.48 × 10⁵ 6.49 × 10⁵ 5.65 × 10⁵ 4.94 × 10⁵
∆G / (kJ mol−1) −34.22 −34.43 −34.64 −34.83 −35.02 −35.20
∆H° / (kJ mol−1) −22.55 − − − − −
∆S° / (J K−1 mol−1) 39.20 − − − − −
R2 0.9999
RV-5 CC-1.3
Kg / (L mol−1) 7.40 × 10⁵ 6.56 × 10⁵ 5.85 × 10⁵ 5.29 × 10⁵ 4.63 × 10⁵ 3.98 × 10⁵
∆G / (kJ mol−1) −33.48 −33.74 −34.01 −34.29 −34.49 −34.62
∆H° / (kJ mol−1) −19.41 − − − − −
∆S° / (J K−1 mol−1) 47.33 − − − − −
R2 0.9930
ACC-1.3
Kg / (L mol−1) 1.64 × 10⁶ 1.37 × 10⁶ 1.16 × 10⁶ 9.75 × 10⁵ 8.23 × 10⁵ 6.97 × 10⁵
∆G / (kJ mol−1) −35.46 −35.60 −35.75 −35.89 −36.01 −36.13
∆H° / (kJ mol−1) −27.38 − − − − −
∆S° / (J K−1 mol−1) 27.12 − − − − −
textural characteristics (lower superficial area, lower total pore volume) than ACC-1.3.
Conclusions
A mixture of coffee waste and inorganic components (BT, lime and KOH) were pyrolysed at 700 °C with the inorganic:organic ratios ranging from 1.0 to 2.2 to obtain carbon composites. Adsorbent with the best adsorption capacity was obtained with inorganic:organic ratio of 1.3 (CC-1.3). The CC-1.3 was acidified with a 6 mol L−1
HCl to produce ACC-1.3 that possessed better textural characteristics (the surface area and total pore volume increased by 10.3-fold and 3.6-fold, respectively). CC-1.3 and ACC-1.3 were utilised for removal of RB-19 and RV-5 dyes from aqueous solutions. The carbon composites were characterised using FTIR spectroscopy (presence of OH of phenol, C=O of ester or anhydride, C−O of carbonate,
Si−O of silicate, and aromatics), SEM (showed that the fibrous characteristics of the organic precursor were lost), nitrogen adsorption/desorption curves (surface area, total pore volume and pore size distribution), XRD (a proof that CC-1.3 produced ACC-1.3, a carbon material with lower content of inorganics, when treated with a 6.0 mol L−1
HCl), and TGA analysis (agreed with XRD data). The dyes interacted with CC-1.3 and ACC-1.3 at the solid/liquid interface when suspended in water. The best experimental conditions in term of pH and contact time were established. The general order kinetic model best described the adsorption process. The intra-particle diffusion model gave multiple linear regions, an implication that the adsorption process might follow multiple adsorption rates. The minimum contact time between the dyes and the carbon composites to attain the equilibrium was 1.0 h for RB-19 and 1.5 h for RV-5. Liu isotherm model gave the best fit when compare with Langmuir and Freundlich isotherm models. The maximum amounts of dyes removed at 25 °C were 63.59 (CC-1.3) and 110.6 mg g−1 (ACC-1.3) for RB-19
dye, and 54.34 (CC-1.3) and 94.32 mg g−1 (ACC-1.3) for
RV-5 dye. The kinetic of adsorption of RB-19 dye was faster than that of RV-5 dye. The maximum amounts adsorbed by CC-1.3 and ACC-1.3 were higher for RB-19 dye than RV-5. The lower dimension of RB-19 dye compared to RV-5 dye could be linked to its better adsorption capacity. Thermodynamic parameters of adsorption, ∆G, ∆H° and
∆S°, were evaluated. The magnitudes of the enthalpy of adsorption agreed with a physical interaction of both dyes with the CC-1.3 and ACC-1.3. The ACC-1.3 was efficient
300 400 500 600 700 800
0.0 0.2 0.4 0.6 0.8 1.0
Effluent A before treatment Effluent A after adsorption with CC-1.3 Effluent A after adsorption with ACC-1.3
A b s o rb a n c e
Wavelength / nm
(a)
300 400 500 600 700 800
0.0 0.5 1.0 1.5 2.0
Effluent B before treatment Effluent B after adsorption with CC-1.3 Effluent B after adsorption with ACC-1.3
A b s o rb a n c e
Wavelength / nm
(b)
300 400 500 600 700 800
0 1 2 3
Effluent C diluted 2-fold before treatment Effluent C undiluted after adsorption with CC-1.3 Effluent C undiluted after adsorption with ACC-1.3
A b s o rb a n c e
Wavelength / nm
(c)
300 400 500 600 700 800
0.0 0.5 1.0 1.5 2.0
2.5 Effluent D diluted 4-fold before treatment Effluent D diluted 2-fold after adsorption with CC-1.3 Effluent D undiluted after adsorption with ACC-1.3
A b s o rb a n c e
Wavelength / nm
(d)
Figure 6. UV-Vis spectra of simulated dye effluents before and after treatment with CC-1.3 and ACC-1.3. (a) Effluent A; (b) effluent B; (c) effluent C and
(d) effluent D. See Table 1 for composition of effluents.
300 400 500 600 700 800
0.0 0.2 0.4 0.6 0.8 1.0
Effluent A before treatment Effluent A after adsorption with CC-1.3 Effluent A after adsorption with ACC-1.3
A b s o rb a n c e
Wavelength / nm
(a)
300 400 500 600 700 800 0.0
0.5 1.0 1.5 2.0
Effluent B before treatment Effluent B after adsorption with CC-1.3 Effluent B after adsorption with ACC-1.3
A b s o rb a n c e
Wavelength / nm
(b)
300 400 500 600 700 800 0
1 2 3
Effluent C diluted 2-fold before treatment Effluent C undiluted after adsorption with CC-1.3 Effluent C undiluted after adsorption with ACC-1.3
A b s o rb a n c e
Wavelength / nm
(c)
300 400 500 600 700 800 0.0
0.5 1.0 1.5 2.0
2.5 Effluent D diluted 4-fold before treatment Effluent D diluted 2-fold after adsorption with CC-1.3 Effluent D undiluted after adsorption with ACC-1.3
A b s o rb a n c e
Wavelength / nm
in the treatment of simulated industrial textile effluents, removing not less than 93.38% of mixture of different dyes in highly concentrated saline media.
Supplementary Information
Supplementary information (Figures S1 to S10) is available free of charge at http://jbcs.sbq.org.br as PDF file.
Acknowledgements
The authors are grateful to Conselho Nacional de Desenvolvimento Científico e Tecnológico (CNPq, Brazil), Coordenação de Aperfeiçoamento de Pessoal de Nível Superior (CAPES, Brazil) and The Academy of Sciences for Developing World (TWAS, Italy) for financial support and sponsorship. We are grateful to Centre for Electron Microscopy (CME-UFRGS) for the use of the SEM microscope. We also thank Chemaxon for furnishing an Academic Research license for MarvinSketch software (Version 14.9.22.0, 2014) (http://www.chemaxon.com) that was used for comparisons of the dyes properties.
References
1. Hessel, C.; Allegre, C.; Maisseu, M.; Charbit, F.; Moulin, P.;
J. Environ. Manage.2007, 83, 171.
2. Allègre, C.; Moulin, P.; Maisseu, M.; Charbit, F.; J. Membr. Sci.
2006, 269, 15.
3. Royer, B.; Cardoso, N. F.; Lima, E. C.; Ruiz, V. S. O.; Macedo, T. R.; Airoldi, C.; J. Colloid Interface Sci.2009, 336, 398. 4. Carneiro, P. A.; Umbuzeiro, G. A.; Oliveira, D. P.; Zanoni,
M. V. B.; J. Hazard. Mater.2010, 174, 694.
5. Oplatowska, M.; Donnelly, R. F.; Majithiya, R. J.; Kennedy, D. G.; Elliott, C. T.; Food Chem. Toxicol. 2011, 49, 1870. 6. Dotto, G. L.; Lima, E. C.; Pinto, L. A. A.; Bioresour. Technol.
2012, 103, 123.
7. Habibi, M. H.; Habibi, A. H.; J. Ind. Eng. Chem. 2014, 20, 68. 8. Daâssi, D.; Rodríguez-Couto, S.; Nasri, M.; Mechichi, T.; Int.
Biodeterior. Biodegrad.2014, 90, 71.
9. Prola, L. D. T.; Acayanka, E.; Lima, E. C.; Umpierres, C. S.; Vaghetti, J. C. P.; Santos, W. O.; Laminsi, S.; Njifon, P. T.; Ind.
Crops Prod.2013, 46, 328.
10. Adebayo, M. A.; Prola, L. D. T.; Lima, E. C.; Puchana-Rosero, M. J.; Cataluña, R.; Saucier, C.; Umpierres, C. S.; Vaghetti, J. C. P.; da Silva, L. G.; Ruggiero, R.; J. Hazard. Mater.2014, 268, 43.
11. Prola, L. D. T.; Machado, F. M.; Bergmann, C. P.; de Souza, F. E.; Gally, C. R.; Lima, E. C.; Adebayo, M. A.; Dias, S. L. P.; Calvete, T.; J. Environ. Manage.2013, 130, 166.
12. Liu, J.; Liu, G.; Liu, W.; Chem. Eng. J.2014, 257, 299. 13. Kyzas, G. Z.; Fu, J.; Matis, K. A.; Materials2013, 6, 5131. 14. Kumar, P. S.; Fernando, P. S. A.; Ahmed, R. T.; Srinath, R.;
Priyadharshini, M.; Vignesh, A. M.; Thanjiappan, A.; Chem.
Eng. Commun.2014, 201, 1526.
15. da Silva, L. G.; Ruggiero, R.; Gontijo, P. M.; Pinto, R. B.; Royer, B.; Lima, E. C.; Fernandes, T. H. M.; Calvete, T.; Chem.
Eng. J.2011, 168, 620.
16. Akkaya, G.; Güzel, F.; Chem. Eng. Commun.2014, 201, 557. 17. Foletto, E. L.; Battiston, S.; Mazutti, M. A.; Jahn, S. L.; Chem.
Eng. Commun.2013, 200, 1027.
18. Rovani, S.; Censi, M. T.; Pedrotti-Jr., S. L.; Lima, E. C.; Cataluña, R.; Fernandes, A. N.; J. Hazard. Mater.2014, 271, 311. 19. Pavan, F. A.; Camacho, E. S.; Lima, E. C.; Dotto, G. L.; Branco, V. T. A.; Dias, S. L. P.; J. Environ. Chem. Eng.2014, 2, 230. 20. Ponte, S.; World Dev.2002, 30, 1099.
21. Kyzas, G. Z.; Lazaridis, N. K.; Mitropoulos, A. C.; Chem. Eng. J.2012, 189, 148.
22. Kyzas, G. Z.; Materials2012, 5, 2069.
23. Oladipo, A. A.; Gazi, M.; J. Water Process Eng.2014, 2, 43. 24. dos Santos, D. C.; Adebayo, M. A.; Pereira, S. F. P.; Prola,
L. D. T.; Cataluña, R.; Lima, E. C.; Saucier, C.; Gally, C. R.; Machado, F. M.; Korean J. Chem. Eng.2014, 31, 1470. 25. Vaghetti, J. C. P.; Zat, M.; Bentes, K. R. S.; Ferreira, L. S.;
Benvenutti, E. V.; Lima, E. C.; J. Anal. At. Spectrom.2003, 18, 376.
26. Cardoso, N. F.; Pinto, R. B.; Lima, E. C.; Calvete, T.; Amavisca, C. V.; Royer, B.; Cunha, M. L.; Fernandes, T. H. M.; Pinto, I. S.;
Desalination2011, 269, 92.
27. Calvete, T.; Lima, E. C.; Cardoso, N. F.; Vaghetti, J. C. P.; Dias, S. L. P.; Pavan, F. A.; J. Environ. Manage.2010, 91, 1695. 28. Ribas, M. C.; Adebayo, M. A.; Prola, L. D. T.; Lima, E. C.;
Cataluña, R.; Feris, L. A.; Puchana-Rosero, M. J.; Machado, F. M.; Pavan, F. A.; Calvete, T.; Chem. Eng. J. 2014, 248, 315. 29. Liu, Y.; Liu, Y. J.; Sep. Purif. Technol.2008, 61, 229. 30. Ho, Y. S.; J. Hazard. Mater.2006, 136, 681.
31. Alencar, W. S.; Lima, E. C.; Royer, B.; dos Santos, B. D.; Calvete, T.; da Silva, E. A.; Alves, C. N.; Sep. Sci. Technol.
2012, 47, 513.
32. Weber-Jr., W. J.; Morris, J. C.; J. Sanit. Eng. Div., Am. Soc. Civ. Eng.1963, 89, 31.
33. Langmuir, I.; J. Am. Chem. Soc.1918, 40, 1361. 34. Freundlich, H.; Phys. Chem. Soc. 1906, 40, 1361.
35. Liu, Y.; Xu, H.; Yang, S. F.; Tay, J. H.; J. Biotechnol.2003, 102, 233.
36. Reinoso, F. R.; Escribano, A. S. In Handbook of Surfaces and Interfaces of Materials: Volume 5: Biomolecules, Biointerfaces,
and Applications; Nalwa, H. S., ed.; Academic Press: Oxford,
2001.
38. Ferrera-Lorenzo, N.; Fuente, E.; Suárez-Ruiz, I.; Ruiz, B.; Fuel
Process. Technol.2014, 121, 25.
39. Gupta, V. K.; Ali, I.; Environmental Water: Advances in
Treatment, Remediation and Recycling; Elsevier: Amsterdam,
2013.
40. Toor, M.; Jin, B.; Chem. Eng. J.2012, 87, 79.
41. Gundogdu, A.; Duran, C.; Senturk, H. B.; Soylak, M.; Imamoglu, M.; Onal, Y.; J. Anal. Appl. Pyrolysis2013, 104, 249.
42. El-Khaiary, M. I.; Malash, G. F.; Ho, Y. S.; Desalination2010,
257, 93.
43. Cardoso, N. F.; Lima, E. C.; Royer, B.; Bach, M. V.; Dotto, G. L.; Pinto, L. A. A.; Calvete, T.; J. Hazard. Mater.2012, 241-242, 146.
44. Gupta, V. K.; Nayak, A.; Chem. Eng. J.2012, 180, 81. 45. Suksabye, P.; Thiravetyan, P.; J. Environ. Manage. 2012, 102, 1. 46. Sun, C. L.; Wang, C. S.; J. Mol. Struct.2010, 956, 38. 47. Kyzas, G. Z.; Lazaridis, N. K.; Bikiaris, D. N.; Carbohydr.
Polym. 2013, 91, 198.
48. Travlou, N. A.; Kyzas, G. Z.; Lazaridis, N. K.; Deliyanni, E.
A.; Chem. Eng. J.2013, 217, 256.
Submitted: October 16, 2014
Published online: March 6, 2015