Article
J. Braz. Chem. Soc., Vol. 26, No. 7, 1475-1481, 2015. Printed in Brazil - ©2015 Sociedade Brasileira de Química 0103 - 5053 $6.00+0.00
A
*e-mail: [email protected]
Application of Ultrasound-Assisted Emulsification Microextraction Based on
Applying Low Density Organic Solvents to the Extraction and Determination of
Mononitrotoluenes in Water Samples
Manoochehr Bahmaei,*,a Hossein Ali Mashayekhib and Faezeh Khalilianc
aFaculty of Chemistry, North Tehran Branch, Islamic Azad University, 1913674711 Tehran, Iran
bDepartment of Chemistry, Tonekabon Branch, Islamic Azad University, 4680416167 Tonekabon, Iran
cDepartment of Chemistry, College of Basic Science, Yadegar -e- Imam Khomeini (RAH) Branch,
Islamic Azad University, 18155-144 Tehran, Iran
In this study, simple and efficient ultrasound-assisted emulsification microextraction (USAEME) based on applying low density organic solvents combined with gas chromatography-flame ionization detector (GC-FID) was developed for the preconcentration and determination of mononitrotoluenes (MNTs) in water samples. In this method, the fine droplets of toluene were formed and dispersed in the sample with the help of ultrasonic waves which accelerated the formation of the fine cloudy solution without using disperser solvents. Several factors influencing the extraction efficiency such as the nature and volume of organic solvent, extraction temperature, ionic strength and centrifugation time were investigated and optimized. Using optimum extraction conditions, dynamic
linear ranges of 0.5-500 µg L-1, and limit of detections (LOD) of 0.3 µg L-1 were obtained for
o-nitrotoluene, m-nitrotoluene and p-nitrotoluene. Finally, the method was successfully applied
to the extraction and determination of MNTs in the water samples in the range of micrograms per
liter with relative standard deviations (RSD) < 12%.
Keywords: ultrasound-assisted emulsification microextraction, mononitrotoluenes, water samples, gas chromatography
Introduction
Isomers of mononitrotoluenes (MNTs) are widely presented in the aquatic environmental due to their vast spread of uses in several industrial and chemical manufacturing applications. In toluene nitration, three isomers are produced in a ratio of about 58.8%, o-nitrotoluene, 36.8% p-nitrotoluene, and 4.4% m-nitrotoluene. MNTs are used in the synthesis of intermediates for production of dyes, rubber chemicals, drugs, resin modifiers, optical brighteners, suntan lotions, and photographic developing
agents.1 Nitrotoluenes are highly toxic compounds in low
concentrations. Moreover, the aromatic amines formed by biodegradation are suspected to be carcinogenic. The tolerance limits of m-nitrotoluene, o-nitrotoluene and p-nitrotoluene in water samples are below of 2 microgram
per liter (µg L-1). Consequently, there is increasing interest in
the determination of concentrations of MNTs at low levels
in various matrices.2,3 The most common ways to extract
MNTs are liquid-liquid extraction (LLE),4 solid-phase
extraction (SPE),2 solid-phase microextraction,5 single
drop microextraction (SDME)6 and headspace solvent
microextraction (HSME).7 LLE needs large amounts
of toxic solvents and is a time-consuming procedure. SPE is also time-consuming method in which a solvent evaporation step is required in order to pre-concentrate the
analytes before final analysis.8 SPME has been developed
to extract MNT.5 However, it is expensive, and the fiber
used is fragile and has limited life time. Further, sample
carry-over in this method can be problematic.9 SDME has
been developed as a solvent-reduction sample preparation procedure, and since small amount of solvent is used, there is minimal exposure to toxic organic solvent. However, it is a time-consuming method in which equilibrium could not be attained after a long time.10 Recently, Rezaee et al.,11
technique with high extraction recovery termed dispersive liquid-liquid microextraction (DLLME). In DLLME, the appropriate mixture of extraction solvent and disperser solvent is rapidly injected by syringe into aqueous samples containing analytes. Thereby, cloudy solution forms. In fact, the cloudy state results from the formation of fine droplets of extraction solvent dispersed in the sample solution. This cloudy solution is centrifuged and the fine droplets are sedimented at the bottom of conical test tube. The determination of analytes in the sedimented phase can be performed by instrumental analysis. However, consumption of disperser solvent in DLLME have lead to some disadvantages such as decreasing of partition coefficients of analyte into the extracting solvent and increasing of the cost, as well as, environmental pollution, plus the variety of solvents that can be used in this method is limited.12-15
Ultrasound-assisted emulsification microextraction (USAEME) procedure combines micro-extraction system and ultrasonic radiation in one step. In the USAEME technique, the application of ultrasonic radiation facilitates the emulsification phenomenon and accelerates the mass-transfer process between two immiscible phases. This leads to an increment in the extraction efficiency in a
minimum amount of time.16 In fact, this preconcentration
technique has been developed by Regueiro et al.,17 who
successfully applied it to determine synthetic musk fragrances, phthalate esters and lindane in aqueous samples. Saleh et al.18 applied low-density organic solvent using
home-designed centrifuge glass vials for determination of polycyclic aromatic hydrocarbons (PAHs) in water samples andSobhi et al.19 applied DLLME for the determination of
MNT in water samples.
This work evaluates the suitability of USAEME for the extraction and determination of MNTs in water samples. The factor affecting the microextraction efficiency was investigated in detail and the optimal conditions were then established. The results indicated that the method could be successfully applied to determine MNTs in different water samples.
Experimental
Chemicals and reagents
The studied MNTs including o-MNT, m-MNT and p-MNT were purchased from Merck (Germany). The stock standard solutions (500 mg L-1) were prepared in methanol.
All of the standard solutions were kept in the refrigerator at 4 ºC. Working solutions of standards at suitable concentration were prepared every day from the stock solution. Toluene, 1-octanol, 1-undecanol, 1-dodecanol
and NaCl were obtained from Merck. The water used was purified on a Youngling ultra pure water purification system
Aqua MaxTM fromUltra (Dongan-gu, Korea).
Apparatus
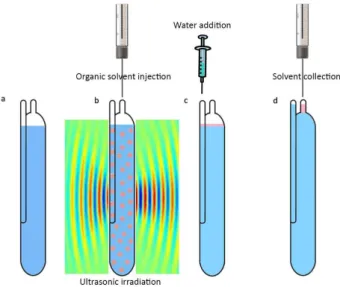
A 40 kHz and 0.138 kW ultrasonic water bath with temperature control (Tecno-Gaz SpA, Parma, Italy) was applied to emulsify the organic solvent. 125 µL Hamilton syringes (Bonaduz, Switzerland) were used to inject the organic solvent into the samples. Twenty milliliters home-designed centrifuge glass vials were used for extraction and collection procedure (Figure 1). A 10.0 µL of a Hamilton gas-tight syringe was applied for the collection of floated organic solvent and injection into the gas chromatograph (GC). A GC (Agilent GC-7890, Santa Clara, USA) equipped with a split/splitless injector system and flame ionization detector was used for separation and determination of target analytes. Ultra pure helium gas (99.999%, Air products, Millennium Gate, UK) was passed through a molecular sieve and oxygen trap (Crs, Louisville, USA) and was used as carrier gas with a flow rate of 2 mL min-1. The injection port was held at 250 ºC and
operated in the splitless mode for 1 min and then split valve was opened and split ratio of 1:5 was applied. Separation was carried out on a DB5, 25 m × 0.32 mm i.d. and 0.25 µm
film thickness from J&W Scientific capillary column. The oven temperature was kept at 100 ºC for 1 min and then
increased to 140 ºC at the rate of 10 ºC min-1 and then
increased to 250 ºC at the rate of 40 ºC min-1, and was held
for 3 min. The flame ionization detector (FID) temperature was maintained at 270 ºC. Hydrogen was generated by hydrogen generator (OPGU-2200S, Shimadzu) for FID at a flow rate of 40 mL min-1. The flow of air (99.999%, Air
products) for FID was 400 mL min-1.
USAEME procedure
vial and collected by a gas-tight syringe (Figure 1d). Two microliters of collected organic solvent was injected into GC-FID instrument.
Results and Discussion
In the proposed method, an ultrasound-assisted emulsification microextraction (USAEME) based on applying low density organic solvents as a new sample preparation technique was used for the extraction of MNTs from water samples. The influences of various parameters such as the kind and the volume of the extraction solvent, ionic strength, extraction temperature and centrifugation time on the extraction efficiency were studied and then the optimum conditions were selected.
Selection of extraction solvent
The selection of a suitable extraction solvent is critical for the USAEME process. In the USAEME, the extraction
solvent should have following characteristics: (i) lower
density than that of water, (ii) low solubility in water, (iii) the ability to extract interest analytes. Based on these requirements, four organic solvent candidates, including toluene, 1-octanol, 1-undecanol and 1-dodecanol were investigated. The results (Table 1) revealed that the extraction recovery obtained for the analytes using toluene were higher than those with the other solvents. Therefore, toluene was selected as the extraction solvent for the study.
Effect of centrifugation time
Centrifugation is essential to separate extraction solvent from aqueous solution in USAEME, because centrifugation time may affect the volume of floated phase. The effect of the centrifugation time on the extraction efficiency was examined from 2 to 20 min at 3500 rpm. Theoretically, a longer centrifuging time would result in more organic drops and higher enrichment factors of the target compounds because a fast separation of solvent extraction from the aqueous solutions would be difficult. Extraction solvent drops were very small when the centrifuging time was too short, and excessing centrifuging time resulted in heat generation, dissolving of part of the extraction solvent and losing sensitivity. Therefore, it is necessary to find suitable centrifuging time. In the presented work, at higher centrifugation times (> 15 min), the volume of collected solvent was decreased. Therefore, considering the extraction efficiency, 10 min was selected as the optimum centrifugal time.
Effect of volume of extraction solvent
The effect of the volume of the extracting solvent on the proposed method of MNTs was also investigated at five levels in the range of 12-50 µL. Volumes smaller than 10 µL were dissolved in aqueous bulk. The minimum collectable volume of organic solvent in the designed system was 2 µL (12 µL of emulsified toluene). Preconcentration factor (PF) was calculated using the equation 1:
collected
initial
C
C
PF= (1)
In the equation 1, Ccollected are the concentrations of
the analytes in the collected organic phase and Cinitial the
initial concentrations of the analytes in the sample solution. Figure 2 shows the preconcentration factor of the analytes
versus different volumes of toluene. As shown in Figure 2,
Figure 1. Schematic representation of the proposed method (a) sample solution in the home-designed emulsification glass vial without salt addition; (b) simultaneous injection and dispersion of 14.0 µL toluene into sample; (c) addition of a few µL of doubly distilled water into the vial and (d) collection of toluene transferred into the capillary tube at the top of the vial (about 6 µL).
Table 1. Extraction efficiency (%) of different extraction solvents evaluated for the extraction of the target analytesa
Compound Extraction efficiency / %
1-Octanol 1-Undecanol Toluene 1-Dodecanol
o-MNT 44 22 68 27
m-MNT 38 18 66 24
p-MNT 34 11 64 19
aExtraction conditions: extraction solvent volumes: 20.0 µL (1-octanol),
the concentration of the analytes in the organic phase decreased by increasing of the volume of the organic phase due to the dilution effect. Results showed that maximum preconcentration factor was achieved by using 12 µL of toluene for the extraction procedure. But, due to the difficulty of the collection of 2 µL of the floated toluene that produced poorer precision, the volume of 14 µL was chosen as the optimum volume of the organic solvent.
Salt addition
The influence of ionic strength was evaluated at 0-8% (m/v) of NaCl levels while other parameters were kept constant. The experimental results showed that salt addition had no significant effect on the extraction efficiency of the analytes. This is possibly because of two opposite effects of addition of salt. One is to increase the volume of the collected organic phase and decrease the dispersion efficiency, which reduces the extraction efficiency; another is the salting-out effect, which increases the extraction efficiency. It is mentioned that by increasing the salt concentration, the volume of the collected organic phase increases, because of the decrease of solubility of the extraction solvent in the presence of salt. Therefore, all the following experiments were carried out without adding salt.
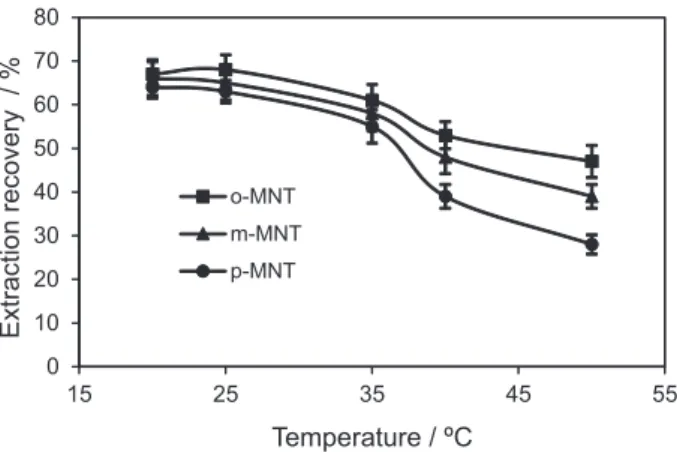
Effect of emulsification-extraction temperature
Temperature affects organic solvent solubility in water as well as the emulsification phenomenon. Thus, this affects the mass-transfer process and the extraction efficiency. To determine the influence of the extraction temperature, extraction producers were done in different temperatures such as 20, 25, 35, 40 and 50 ºC. The results are shown
in Figure 3. It was observed that the highest extraction efficiency was obtained at the range of 20-25 ºC, but in higher temperature (35-50 ºC), extraction recoveries decrease. This event is possible because of the decrease in distribution coefficient (KD) in higher temperature. Hence,
25 °C was used for further experiments.
Influence of extraction time and ultrasound time
The extraction time is defined as the interval time started after dispersion and ended just before centrifugation. The results show that extraction time has no significant effect on the extraction efficiency of the analytes. It was revealed that the contact surface between extracting solvent and aqueous sample was infinitely larger and equilibrium state was achieved during a few second. Therefore, in further experiments the centrifugation was carried out just after dispersion process. The effect of ultrasound time on the extraction efficiency was examined in the range of 0-180 s. The results (Figure 4) show that in the less than 30 s, extraction efficiency is low, because of the ultrasound
0 200 400 600 800 1000 1200 1400
12 14 34 40 50
Preconcentration factor
Volume of extraction solvent / µL o-MNT
m-MNT
p-MNT
Figure 2. Effect of extracting solvent volume on the preconcentration factor. Conditions: sample solution: 10 mL of 100 µg L-1 of the analytes;
solution temperature: 25 ± 3 ºC; dispersion time: 30 s; centrifugation time: 10 min.
o-MNT
m-MNT
p-MNT
0 10 20 30 40 50 60 70 80
0 30 60 90 120 150 180 210
Extraction recovery / %
Ultrasound time / s
Figure 4. Effect of ultrasound time on the extraction efficiency. Conditions: sample solution: 10 mL of 100 µg L-1 of the analytes; volume
of organic phase: 14.0 µL; solution temperature: 25 ± 3 ºC; dispersion time: 0, 15, 30, 60, 90, 150 and 180 s; centrifugation time: 10 min.
0 10 20 30 40 50 60 70 80
15 25 35 45 55
Extraction recovery / %
Temperature / ºC
o-MNT m-MNT p-MNT
Figure 3. Effect of extraction temperature on the extraction efficiency. Conditions: sample solution: 10 mL of 100 µg L-1 of the analytes;
time is not enough for dispersion phenomenon and after 30 s the extraction efficiency do not changed significantly, because of equilibrium state was achieved a few second. Therefore, 30 s was selected as the optimum value for further experiments.
Method performance
Analytical performance
To evaluate the practical applicability of the USAEME method, analytical quality parameters (i.e., linearity, repeatability, limit of detection (LOD) and limit of quantification (LOQ)) were investigated. The performance of the method under the optimum conditions is shown in Table 2. The linear dynamic ranges were from 0.5 to
500 µg L-1 for o-MNT, p-MNT and m-MNT in water samples.
Good LODs (0.3 µg L-1) were obtained, based on S/N = 3
and also, LOQs 1.0 µg L-1 were obtained, based on S/N = 10.
The preconcentration factors (PF) were in the ranges of 1066 to 1132 in water samples. The relative standard deviation (RSD%) for extraction and determination of the analytes were obtained at three different concentration levels and the results was shown in Table 3.
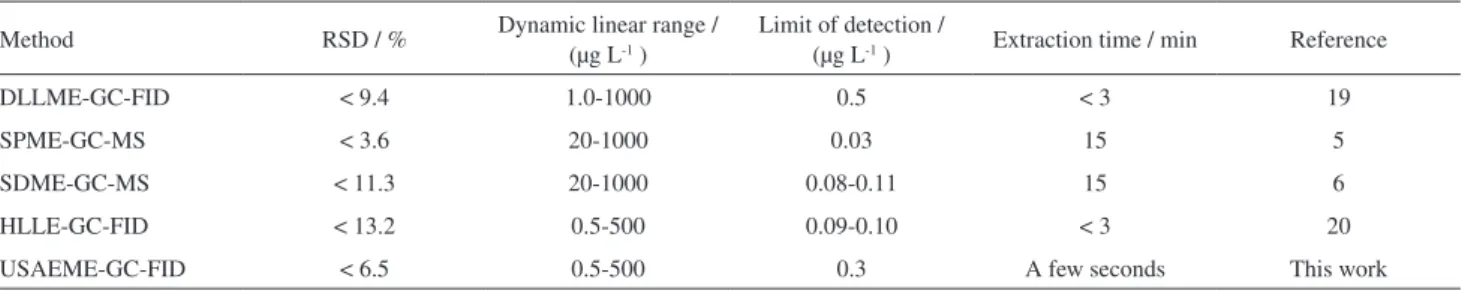
Table 4 compares proposed method with other extraction methods for the determination of the target analytes in water samples. The comparison of extraction time of the proposed method with solid-phase microextraction (SPME)5 and single drop microextraction (SDME)6 for the
extraction of the target analytes indicates that this novel method has a very short equilibrium time comparing to the mentioned methods and the extraction time needed
for the proposed method is a few seconds. Quantitative results of proposed method are better than SPME and SDME without using sensitive detector such as mass spectrometer (MS). Quantitative results of the proposed method are comparable with homogeneous liquid-liquid
extraction (HLLE)20 method and better than of dispersive
liquid-liquid microextraction (DLLME) method.19 The
RSD of the proposed method are better than of DLLME and HLLE methods. Also, consumption of disperser and homogeneous solvents in DLLME and HLLE have lead to some disadvantages such as decreasing of partition coefficients of the analytes into the extracting solvent and increasing of the cost as well as environmental pollution, plus the variety of solvents that can be used in this method is limited. Finally, it can be concluded that, the broad linear dynamic range combined with the low detection limit suggests a high potential for monitoring MNTs in water samples by applying the USAEME-GC-FID method.
Analysis of real samples
In order to test the applicability of the proposed method, four different water samples (tap, well, river and sea water)
Table 2. Quantitative results of USAEME and GC-FID method for MNTs compounds
Analyte Linear range /
(µg L-1) LOD / (µg L-1)a LOQ / (µg L-1)b PFc ER / %d R2e
o-MNT 0.5-500 0.3 1.0 1132 68 0.9983
m-MNT 0.5-500 0.3 1.0 1099 66 0.9978
p-MNT 0.5-500 0.3 1.0 1066 64 0.9972
aLOD: limit of detection for S/N = 3; bLOQ: limit of quantification for S/N = 10; cpreconcentration factor at the concentration analytes of 100 µg L-1; dextraction recovery; ecoefficient of determination.
Table 3. Relative standard deviation for MNTs compounds at three different concentration levels by using the proposed method
Analyte Relative standard deviation (RSD%), n = 4 5.0 µg L-1 10.0 µg L-1 100 µg L-1
o-MNT 8.6 7.2 5.1
m-MNT 10.1 9.1 6.3
p-MNT 7.3 6.6 4.7
Table 4. Comparison of the proposed method with other extraction methods for the determination of MNTs compounds in water samples
Method RSD / % Dynamic linear range / (µg L-1 )
Limit of detection /
(µg L-1 ) Extraction time / min Reference
DLLME-GC-FID < 9.4 1.0-1000 0.5 < 3 19
SPME-GC-MS < 3.6 20-1000 0.03 15 5
SDME-GC-MS < 11.3 20-1000 0.08-0.11 15 6
HLLE-GC-FID < 13.2 0.5-500 0.09-0.10 < 3 20
were extracted and analyzed. The results are recorded in Table 5. All the water samples were spiked with MNTs standard solution at three different concentration levels (2.0, 5.0 and 10.0 µg L-1 concentration levels) to assess
the matrix effects. The obtained relative recoveries were between 82.5 and 99% (Table 5). The results show that matrix has negligible effect on USAEME of MNTs. Figure S1 shows GC-FID chromatograms of river water prior (Figure S1a) and after (Figure S1b) spiking with MNTs at 2.0 µg L-1 level.
Conclusions
In the present study, USAEME combined with GC-FID was applied to determine MNTs at trace levels concentrations in water samples. The present USAEME technique reduced sample extraction time and organic solvent consumption. Under the optimized conditions, good recovery, linearity and reproducibility were obtained. The proposed method was simple, rapid and cheap and possessed great potential in the analysis of MNTs in real water samples and can be used to monitor MNTs in real water samples.
Supplementary Information
Supplementary data (USAEME-GC-FID chromatogram of MNTs) are available free of charge at http://jbcs.sbq.org.br as PDF file.
Acknowledgements
Financial support by North Tehran Branch, Islamic Azad University (Tehran, Iran) for the support during the period of this research is gratefully acknowledged.
References
1. Groggins, P. H.; Unite Process in Organic Synthesis, 5th ed.; McGraw Hill: New York, 1958.
2. Walsh, M. E.; Raney, T. A.; Determination of Nitroaromatic, Nitramine, and Nitrate Ester Explosives in Water using SPE
and GC/ECD; Comparison with HPLC, Special Report 98-2,
United States Army Cold Regions Research and Engineering laboratory: Hanover, 1998.
3. United States Environmental Protection Agency (USEPA),
Drinking Water Standards and Health Advisories, EPA
822-B-00-001, United States Environmental Protection Agency: Washington, 2000.
4. United States Environmental Protection Agency (USEPA), SW-846, Method 8330; Nitroaromatics & Nitramines by High
Performance Liquid Chromatography (HPLC), United States
Environmental Protection Agency: Washington, 1994. 5. Psillakis, E.; Kalogerakis, N.; J. Chromatogr. A2001, 938, 113.
6. Psillakis, E.; Kalogerakis, N.; J. Chromatogr. A2001, 907, 211. 7. Ebrahimzadeh, H.; Yamini, Y.; Kamarei, F.; Khalili-Zanjani, M.;
Talanta2007, 72, 193.
8. Darrach, M. R.; Chutjian, A.; Plett, G. A.; Environ. Sci. Technol.
1998, 32, 1354.
9. Helena, P.; Locita, I. K.; Trends Anal. Chem. 1999, 18, 272.
Table 5. Determination of MNTs compounds in tap, well, river and sea water and relative recovery of MNTs compounds in them
Sample
Concentration of o, m and p-MNTs / (µg L-1) ± SD, n = 3
Added o, m and p-MNTs / (µg L-1)
Found o, m and p-MNTs /
(µg L-1) ± SD, n = 3 Relative recovery / %
o m p o m p o m p o m p
Tap watera nde nde nde
2.0 2.0 2.0 1.91 ± 0.1 1.90 ± 0.2 1.88 ± 0.1 95.5 95 94
5.0 5.0 5.0 4.9 ± 0.4 4.8 ± 0.4 4.8 ± 0.3 98 96 96
10.0 10.0 10.0 9.9 ± 0.7 9.7 ± 0.8 9.8 ± 0.7 99 97 98
Well waterb nde nde nde
2.0 2.0 2.0 1.85 ± 0.2 1.75 ± 0.2 1.80 ± 0.2 92.5 87.5 90
5.0 5.0 5.0 4.7 ± 0.3 4.5 ± 0.4 4.6 ± 0.3 94 90 92
10.0 10.0 10.0 9.5 ± 0.6 9.3 ± 0.8 9.4 ± 0.5 95 93 94
River waterc nde nde nde
2.0 2.0 2.0 1.84 ± 0.2 1.70 ± 0.2 1.75 ± 0.2 92 85 87.5
5.0 5.0 5.0 4.7 ± 0.3 4.4 ± 0.4 4.5 ± 0.4 94 88 90
10.0 10.0 10.0 9.5 ± 0.7 9.0 ± 0.8 9.2 ± 0.7 95 90 92
Sea waterd n.de n.de n.de
2.0 2.0 2.0 1.75 ± 0.2 1.65 ± 0.2 1.67 ± 0.2 87.5 82.5 83.5
5.0 5.0 5.0 4.5 ± 0.4 4.3 ± 0.5 4.4 ± 0.5 90 86 88
10.0 10.0 10.0 9.2 ± 0.7 9.0 ± 1.0 9.1 ± 0.9 92 90 91
10. Ahmadi, F.; Assadi, Y.; Milani Hosseini, S. M. R.; Rezaee, M.;
J. Chromatogr. A2006, 1101, 307.
11. Rezaee, M.; Assadi, Y.; Milani Hosseini, M. R.; Aghaee, E.; Ahmadi, F.; Berijani, S.; J.Chromatogr. A2006, 1116, 1. 12. Rezaee, M.; Yamini, Y.; Faraji, M.; J. Chromatogr. A2010, 1217,
2342.
13. Rezaee, M.; Yamini, Y.; Shariati, S.; Esrafili, A.; Shamsipur, M.;
J. Chromatogr A2009, 1216, 1511.
14. Mashayekhi, H. A.; Abroomand-Azar, P.; Saber-Tehrani, M.; Waqif, S. H.; Chromatographia 2010,71, 517.
15. Mashayekhi, H. A.; Abroomand-Azar, P.; Saber-Tehrani, M.; Waqif, S. H.; Int. J. Environ.Anal. Chem.2011, 91, 516.
16. Castro, M. D. L.; Priego-Capote, F.; Talanta2007, 72, 321. 17. Regueiro, J.; Llompart, M.; Garcia-Jares, C.; Garcia-Monteagudo,
J. C.; Cela, R.; J. Chromatogr. A2008, 1190, 27.
18. Saleh, A.; Yamini, Y.; Faraji, M.; Rezaee, M.; Ghambarian, M.;
J. Chromatogr. A2009, 1216, 6673.
19. Sobhi, H. R.; Kashtiaray, A.; Farahani, H.; Javaheri, M.; Ganjali, M. R.; J. Hazard. Mat.2010, 175, 279.
20. Ebrahimzadeh, H.; Yamini, Y.; Kamarei, F.; Shariati, S.; Anal.
Chim. Acta2007, 594, 93.
Submitted: February 19, 2015