Article
Printed in Brazil - ©2015 Sociedade Brasileira de Química0103 - 5053 $6.00+0.00A
*e-mail: [email protected]
Chemometric Study of the Antiproliferative Activity of Some New Hydantoin
Derivatives: Assessment of Activity and Chromatographic Lipophilicity Data
Tatjana Lj. Djaković Sekulić,*,a Adam Smoliński,b Nemanja P. Trišović,c Gordana S. Ušćumlićc and Biljana Dj. Božićd
aDepartment of Chemistry, Biochemistry and Environmental Protection, Faculty of Sciences,
University of Novi Sad, 21000 Novi Sad, Republic of Serbia
bDepartment of Energy Saving and Air Protection, Central Mining Institute,
40-166 Katowice, Poland
cFaculty of Technology and Metallurgy and dFaculty of Biology, University of Belgrade,
11000 Belgrade, Republic of Serbia
Cancer is the major health problem affecting the mankind of today. Most of the drugs used in traditional chemotherapy are very limited and the discovery of novel, more active, more selective and less toxic ones is still very intensive. A chemometric approach was applied in the study of antiproliferative activity against human colon cancer and breast cancer as well as in the study of lipophilicity of 3-(4-substituted 5-ethyl-5-phenyl- and 3-(4-substituted benzyl)-5,5-diphenylhydantoins. Hierarchical clustering analysis (HCA) shows that the investigated hydantoins have higher antiproliferative activity against human breast cancer cells than against human colon cancer cells. However, some hydantoins at the highest applied concentration reverse antiproliferative effect, higher against the human colon cancer cells and lower against human breast cancer cells. Principal component analysis (PCA) gives better insight into the activity of hydantoins related to their structural changes. It distinguishes more active compounds from the less active ones according to various criteria. Generally, more lipophilic 5,5-diphenylhydantoins exhibit a higher antiproliferative activity comparing to less lipophilic 5-ethyl-5-phenylhydantoins. Also, a substituent attached to benzyl moieties affects the activity additionally. The activity is particularly pronounced for compounds with cyano, methyl, chloro and bromo group. Halogen substituent were superior in antiproliferative capacity particularly in the series of 5,5-diphenylhydantoins.
Keywords: 3-(4-substituted benzyl)-5-phenylhydantoins, antiproliferative activity, lipophilicity, hierarchical clustering analysis, principal component analysis
Introduction
The major health problem affecting the mankind of today is cancer. Several types of cancers have been identified that attack major organs such as lungs, brain, kidneys, colon, breasts and stomach. Regardless of major advances in many areas of modern medicine over the past 100 years, a successful treatment of cancer still remains a significant challenge. Most of the drugs used in traditional chemotherapy are very limited because the discovery of novel agents that can kill tumor cells selectively or inhibit their proliferation without general toxicity is very difficult. Hence, the search for new, more active, more selective
and less toxic compounds is still very intense. One of the approaches is promotion of the structural diversity, which can be achieved by the attachment of pharmacophoric groups to the significant molecular scaffold. Such examples are di- and tri-substituted hydantoins, which have been widely used in biological screening resulting in numerous pharmaceutical applications.1-3 Until today, hydantoin
derivatives (imidazolidine-2,4-dione) have been identified as anticonvulsants,4 antiarrhythmics,5 antimuscarinics,6
antidiabetics,7 and antitumor agents.8-11
principal component analysis (PCA) and hierarchical clustering analysis (HCA). Besides antiproliferative activity against cell lines MDA-MB-231 (human breast adenocarcinoma) and HCT-116 (human colon cancer), the compounds were chromatographically characterized. The partition retention parameters were determined, i.e., lipophilicity of the compounds. Lipophilicity is closely correlated with adsorption, distribution, metabolism and excretion (ADME).
Experimental
Investigated compounds and their antiproliferative activity
The investigated hydantoin derivatives (Figure 1) were synthesized according to the procedure published earlier.12
The solutions of the investigated compounds were prepared by dissolving 0.02 g of each compound in 2 mL of ethanol.
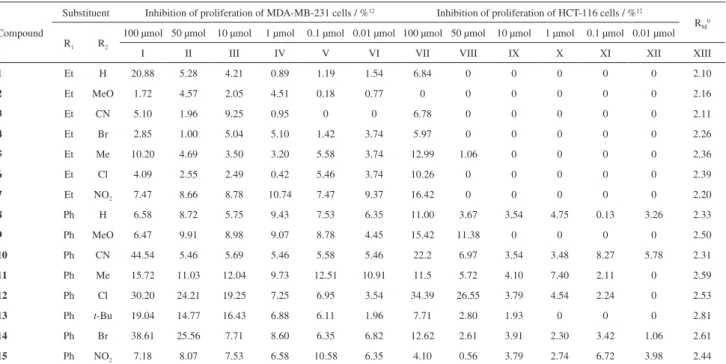
The antiproliferative activity of the investigated compounds (Table 1) was taken from reference 12.
Chromatographic lipophilicity data
Chromatography was performed on 10 × 10 cm high-performance thin-layer chromatographic (HPTLC) plates of silica gel 60 RP-18 F254s (Merck, Darmstadt, Germany). Mobile phase used was acetonitrile-water (with increasing acetonitrile content from 55% to 75%, v/v); increments of 5% v/v. Acetonitrile (Acros organics, Geel, Belgium) of p.a. purity was used. Chromatograms were developed by the ascending technique at room temperature (22 ± 2 °C) without previous saturation of the chamber (Camag, Muttenz, Switzerland) with mobile phase vapor. The developing distance was 4.5 cm. After development, the plates were dried at room temperature, and individual chromatographic zones were detected under UV illumination at 254 nm.
The RM values were calculated according to Bate-Smith and Westall equation: RM = log ((1/RF) − 1),13
where RF is the retardation factor defined as the distance travelled by the centre of the spot divided by the distance
simultaneously travelled by the mobile phase. The RF values
were arithmetic mean of at least three measurements for each solute-stationary-mobile phase combination. The RM
value of each compound was examined as a function of mobile phase composition:
RM = RM0− S·φ (1)
In equation 1, φ is the volume fraction of organic solvent in the mobile phase, RM0 is the intercept, and S is
the slope of equation 1. RM0 describes the overall effect of
the intermolecular interaction of the compound with the stationary and mobile phases. It is often used as a measure of lipophilicity.14-16 Values of R
M0 for the investigated
compounds are given in Table 1.
Chemometric analysis
HCA and PCA were carried out using MATLAB software, version 6.1.0.450.17 For HCA, the studied data
were organized in data matrix X (15 × 12), where rows correspond to 15 studied compounds (hydantoins), whereas columns represent antiproliferative activity evaluated against human breast cancer MDA-MB-231 (activity I-VI) and human colon cancer HCT116 (activity VII-XII) cell lines, respectively. A slightly modified data matrix X1
(15 × 13) was used for PCA. The additional column in data matrix is for chromatographic lipophilicity parameters (XIII).
A chemometric analysis of the studied compounds was performed for centred and standardized data Xc (15 × 12) and Xc1(15 × 13).
Results and Discussion
The previous investigation shows that hydantoins 1-15
(see Figure 1 and Table 1) exhibit a considerable antiproliferative activity.12 The presence of different
substituents on both hydantoin (substituent R1) and benzyl
moieties (substituent R2) affects the antiproliferative activity. Activity is particularly pronounced for compounds 1, 10-12
and 14 (with R2 = cyano (CN), methyl (Me), chloro (Cl)
and bromo (Br)).
Understanding the relationship between the activity, structure and the physicochemical properties of the examined compound enables identification of potentially bioactive compounds. Thorough classification and comparison of various hydantoins on the basis of their activity is objectively possible only by application of appropriate chemometric methods. Interpretation and discussion of results presented by tables or/and graphics are
O
N
R2
HN
O R1
extremely subjective. In order to avoid subjective analysis, we used the chemometric methods, PCA and HCA. Finally, since all active hydantoins are lipophilic, a further objective of our work was to determine their lipophilicity.
Hierarchical clustering analysis
Hierarchical clustering analysis (HCA) is a convenient method for studies of similarities (or dissimilarities) between objects in the variables space, or similarities (dissimilarities) between variables in the objects space.18-21
HCA is characterized by the similarity measure applied, and the way the resulting sub-clusters are merged (linked). Different clustering methods are available. Their choice depends on the data studied and the particular purpose of the method applied. In the present study, the Ward linkage method based on the Euclidean distance was used.22,23 The
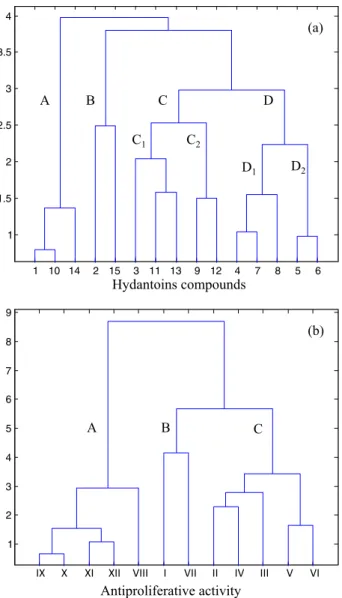
results of HCA presented as dendrograms, reveal data structure, i.e., the sub-groups of objects in the variables space or the sub-groups of variables in the objects space. The dendrogram presented in Figure 2a groups the hydantoins into four main clusters: (i) cluster A contains compounds 1, 10 and 14; (ii) cluster B is constituted by hydantions 2 and 15; (iii) cluster C is composed of hydantions 3, 9 and 11-13;
(iv) cluster D contains hydantions 4-8.
The most active compounds are collected in cluster A, while the least active, mostly 5-ethyl-5-phenylhydantoins, in cluster D.
In the main clusters, C and D, the following sub-structures can be distinguished: cluster C contains two subgroups: C1 (compounds 3, 11 and 13) and C2
(compounds 9 and 12) whereas cluster D is divided
into two subgroups: D1 (compounds 4, 7 and 8) and D2
(compounds 5 and 6).
The dendrogram constructed for the antiproliferative activity in the samples space (see Figure 2b) reveals three main classes: (i) Class A, containing the variables VIII-XII (antiproliferative activity against the human colon cancer cells HCT-116 at the concentration levels of 50, 10, 1, 0.1 and 0.01 µmol dm−3); (ii) Class B, constituted by variables I
and VII (inhibition of proliferation at the concentration level of 100 µmol dm−3) and (iii) Class C, containing variables
II-VI (inhibition of proliferation of human breast cancer cells MDA-MB-231 at the concentration levels of 50, 10, 1, 0.1 and 0.01 µmol dm−3).
The classes in Figure 2b show that antiproliferative activity of the investigated compounds against MDA-MB-231 (human breast cancer) is superior to that against HCT-116 cell lines (human colon cancer). The highest concentration level of 100 µmol dm−3 is specific
and differes from lower concentrations. This is due to the opposite activity effect of compounds 3-9 and 12, which
exhibit higher antiproliferative activity against the human colon cancer cells HCT-116 compared to the inhibition of cells in MDA-MB-231. Figure 2a does not give any obvious classification of the investigated compounds. The Table 1. Antiproliferative effects of the investigated compounds on two cell lines and chromatographic retention data
Compound
Substituent Inhibition of proliferation of MDA-MB-231 cells / %12 Inhibition of proliferation of HCT-116 cells / %12
RM0 R1 R2
100 µmol 50 µmol 10 µmol 1 µmol 0.1 µmol 0.01 µmol 100 µmol 50 µmol 10 µmol 1 µmol 0.1 µmol 0.01 µmol
I II III IV V VI VII VIII IX X XI XII XIII
1 Et H 20.88 5.28 4.21 0.89 1.19 1.54 6.84 0 0 0 0 0 2.10
2 Et MeO 1.72 4.57 2.05 4.51 0.18 0.77 0 0 0 0 0 0 2.16
3 Et CN 5.10 1.96 9.25 0.95 0 0 6.78 0 0 0 0 0 2.11
4 Et Br 2.85 1.00 5.04 5.10 1.42 3.74 5.97 0 0 0 0 0 2.26
5 Et Me 10.20 4.69 3.50 3.20 5.58 3.74 12.99 1.06 0 0 0 0 2.36
6 Et Cl 4.09 2.55 2.49 0.42 5.46 3.74 10.26 0 0 0 0 0 2.39
7 Et NO2 7.47 8.66 8.78 10.74 7.47 9.37 16.42 0 0 0 0 0 2.20
8 Ph H 6.58 8.72 5.75 9.43 7.53 6.35 11.00 3.67 3.54 4.75 0.13 3.26 2.33
9 Ph MeO 6.47 9.91 8.98 9.07 8.78 4.45 15.42 11.38 0 0 0 0 2.50
10 Ph CN 44.54 5.46 5.69 5.46 5.58 5.46 22.2 6.97 3.54 3.48 8.27 5.78 2.31
11 Ph Me 15.72 11.03 12.04 9.73 12.51 10.91 11.5 5.72 4.10 7.40 2.11 0 2.59
12 Ph Cl 30.20 24.21 19.25 7.25 6.95 3.54 34.39 26.55 3.79 4.54 2.24 0 2.53
13 Ph t-Bu 19.04 14.77 16.43 6.88 6.11 1.96 7.71 2.80 1.93 0 0 0 2.81
14 Ph Br 38.61 25.56 7.71 8.60 6.35 6.82 12.62 2.61 3.91 2.30 3.42 1.06 2.61
15 Ph NO2 7.18 8.07 7.53 6.58 10.58 6.35 4.10 0.56 3.79 2.74 6.72 3.98 2.44
color map is more informative, though. It complements the dendrogram of the studied antiproliferative activity in the hydantoins compounds space of the studied data sorted according to the Ward linkage method (see Figure 3).
Hydantoins 1, 10 and 14 belonging to cluster A
exhibit the highest antiproliferative activity against human breast cancer cells MDA-MB-231 at the concentration of 100 µmol dm−3 (antiproliferative activity I).
Hydantoins 2 and 15, collected in cluster B, stand out
from the rest of the tested compounds due to the relatively high inhibition of proliferation of human breast cancer cells MDA-MB-231 at the concentration levels of 50 and 1 µmol dm−3 (antiproliferative activities II and IV).
Moreover, compound 2 is characterized by the highest
antiproliferative activities II and IV whereas compound 15
is additionally characterized by the highest antiproliferative activity V. Cluster C, containing hydantions 3, 9 and 11-13,
is unique due to high antiproliferative activities I-IV and VII. Additionally, compound 11 is characterized by the
lowest antiproliferative activity XII among all the studied compounds. Cluster D, which contains hydantions 4-8, is
characterized by the highest antiproliferative activity VII (the highest concentration level of 100 µmol dm−3 applied
to human colon cancer cell lines).
To sum up, the dendrograms in Figure 2 reveal the data structure but do not enable interpretation of the relationships between the studied compounds and activity data. These limitations of the HCA were overcome by adding a color map of the studied data (see Figure 3) sorted according to the order of compounds and the order of antiproliferative activity observed on their respective dendrograms (as previously shown in Figure 2). Parallel interpretation of the dendrogram of antiproliferative activity and the color map of the data leads to conclusion that the highest antiproliferative activity of the investigated compounds is obtained at the concentration of 100 µmol dm−3 for both
cell lines. At the concentrations below 100 µmol dm−3,
antiproliferative activity against the human colon cancer
1 10 14 2 15 3 11 13 9 12 4 7 8 5 6 1
1.5 2 2.5 3 3.5 4
B
A C D
C1 C2
D1 D2
Hydantoins compounds
(a)
1 2 3 4 5 6 7 8 9
A B C
Antiproliferative activity
(b)
I VII II IV III V VI VIII
XII XI X IX
Figure 2. Dendrogram of the studied (a) hydantoins in the space of antiproliferative activity evaluated against human breast cancer MDA-MB-231 and human colon cancer HCT116 cell lines and (b) antiproliferative activity in the samples space by the Ward linkage method using Euclidean distance as the similarity measure.
Figure 3. Dendrogram of studied antiproliferative activity in hydantoin compounds space with the color map of the studied data sorted according to the Ward linkage method.
1 10 14 2 15 3 11 13 9 12 4 7 8 5 6
1 1.5 2 2.5 3 3.5 4
B
A C D
C1 C2
D1 D2
Hydantoins compounds
(a)
1 2 3 4 5 6 7 8 9
A B C
Antiproliferative activity
(b)
I VII II IV III V VI
cells is lower comparing to inhibition of proliferation of human breast cancer cells. The previous investigations show that the investigated compounds are non-toxic to normal rat peritoneal cells.12 Therefore, the pronounced
antiproliferative activity against MDA-MB-231 indicates their significant anticancer potential in the treatment of breast cancer.
Principal component analysis
The principal components analysis, PCA, is one of the most popular methods used in reduction of data dimensionality.24-26 If the reduction of data dimensionality is
effective, it enables data visualization and partial reduction of experimental error. PCA results in a decomposition of a data matrix X (m × n), into matrices S (m × k) and D (k × n), where k denotes the number of significant factors:
X (m × n) = S (m × k) ×D (k × n) + E (m × n) (2)
Matrix S is called a score matrix and, in the case of
the data set concerned, it includes information on the studied compounds. Matrix D, also called a loading matrix,
describes antiproliferative activity and chromatographic data of the investigated compounds. Columns of matrix S
and rows of matrix D are called principal components
(PCs) or eigenvectors and are constructed to maximize the description of the data variance. The way of construction of consecutive PCs is enforced by their ortogonality and their arrangement according to decreasing data variance they describe. Since the PCs provide information not only on the data structure but also on the experimental error, the optimal number of the principal components (k) needs to be selected, enabling effective data modeling and simultaneously, partial elimination of experimental error. Matrix E includes the part of data which are not modelled
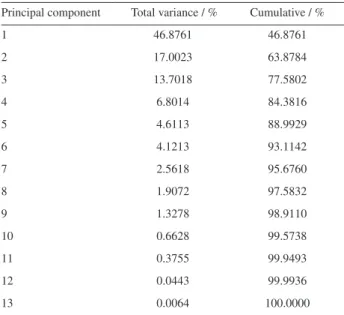
by the constructed model with k PCs. To determine the number of significant components (PCs) of the studied data organized in matrix Xc1(15 × 13), the percent of modelled variance was used (Table 2).
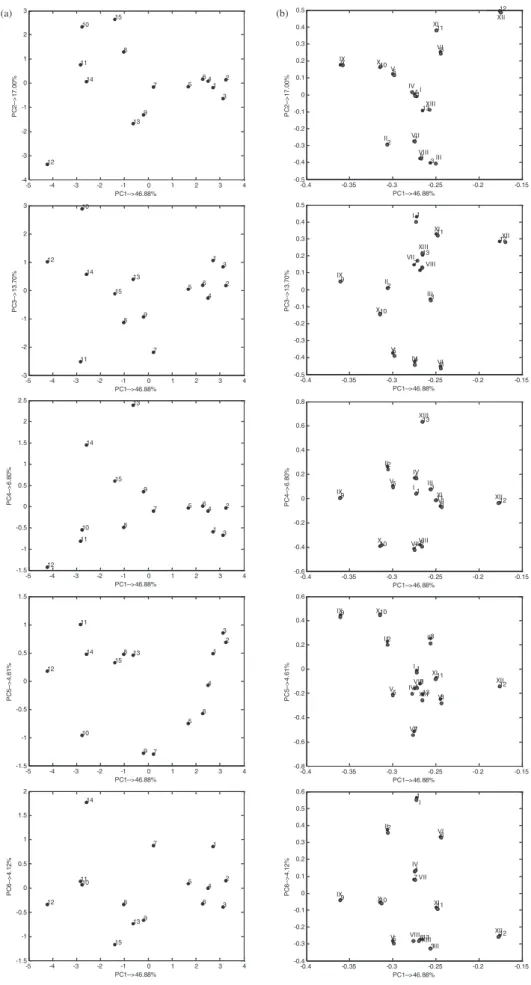
The PCA model with six significant PCs, describes 93.11% of data variance (Table 2). Score plots and loading plots obtained as a result of this analysis are presented in Figure 4.
PC1 (describing 46.88% of the total data variance) reflects the difference between compound 12 and all the
remaining compounds. The largest difference is observed between compound 12 and compounds 2 and 3 (see score
plots, Figure 4a). Compound 12 differs from compounds 2
and 3 not only in activity but also in lipophilicity. Moreover,
three groups of compounds can be distinguished along
PC1. The first one collects the most active compounds 10, 11 and 14, the second contains samples 7-9, 13 and 15,
and the third contains compounds 1-6 (all with the same
R1 (Et)). Based on the loading plots (see Figure 4b), a conclusion may be drawn that compounds 7-9, 13 and 15,
compounds 10, 11 and 14 and, in particular, compound 12
differ from the remaining samples by their relatively high antiproliferative activities.
PC2, describing 17.00% of the total variance, shows the difference between sample 12 and samples 10 and 15.
Based on the loading plots, these differences were attributed to relatively high antiproliferative activity of compounds 10
and 15 and low antiproliferative activity of compound 12 observed for the concentration of 0.01 µmol dm−3 for
HCT-116 cells (parameter XII). Compound 12 has R2 of
lower polarity (Me) than 10 and 15 (CN and NO2).
PC3 describes 13.70% of the total variance and reflects the differences between compounds 7 and 11 and
compound 10. The latter is unique mainly because of
relatively high antiproliferative activity at the concentration of 100 µmol dm−3 for MDA-MB-231 cells (parameter I).
Compounds 7 and 11 are characterized by relatively high
antiproliferative activity obtained at concentrations of 1, 0.1 and 0.01 µmol dm−3 for MDA-MB-231 cells (parameters
IV, V and VI, respectively). PC4 (describing 6.80% of data variance) displays the highest difference between compounds 13 and 14 and all the remaining samples.
Compound 14 and in particular, compound 13 are unique
due to a high value of RM0 (parameter XIII). PC5, describing
4.61% of the total variance, reveals the singularity of compounds 7 and 9.PC6, describing 4.12% of the total
Table 2. Percentage of data variance described by consecutive principal components
Principal component Total variance / % Cumulative / %
1 46.8761 46.8761
2 17.0023 63.8784
3 13.7018 77.5802
4 6.8014 84.3816
5 4.6113 88.9929
6 4.1213 93.1142
7 2.5618 95.6760
8 1.9072 97.5832
9 1.3278 98.9110
10 0.6628 99.5738
11 0.3755 99.9493
12 0.0443 99.9936
-5 -4 -3 -2 -1 0 1 2 3 4 -4 -3 -2 -1 0 1 2 3 1 2 3 4 5 6 7 8 9 10 11 12 13 14 15 PC1-->46.88% P C 2 --> 1 7 .0 0 %
-0.4 -0.35 -0.3 -0.25 -0.2 -0.15 -0.5 -0.4 -0.3 -0.2 -0.1 0 0.1 0.2 0.3 0.4 0.5 PC1-->46.88% P C 2 -->1 7 .0 0 % 1 2 3 4 5 6 7 8 9 10 11 12 13 (a) (b) IX V II VI VII XI XII X XIII I IV III VIII
-5 -4 -3 -2 -1 0 1 2 3 4
-3 -2 -1 0 1 2 3 PC1-->46.88% P C 3 --> 1 3 .7 0 % 1 2 3 4 5 6 7 8 9 10 11 12 13 14 15
-0.4 -0.35 -0.3 -0.25 -0.2 -0.15 -0.5 -0.4 -0.3 -0.2 -0.1 0 0.1 0.2 0.3 0.4 0.5 PC1-->46.88% P C 3 --> 1 3 .7 0 % 1 2 3 4 5 6 7 8 9 10 11 12 13 IX X V IV I III II VI XI XII XIII VIII VII
-5 -4 -3 -2 -1 0 1 2 3 4
-1.5 -1 -0.5 0 0.5 1 1.5 2 2.5 PC1-->46.88% P C 4 --> 6 .8 0 % 1 2 3 4 5 6 7 8 9 10 11 12 13 14 15
-0.4 -0.35 -0.3 -0.25 -0.2 -0.15 -0.6 -0.4 -0.2 0 0.2 0.4 0.6 0.8 PC1-->46.88% P C 4 --> 6 .8 0 % 1 2 3 4 5 6 78 9 10 11 12 13 IX X V I III II VI VIIVIII XII XIII XI IV
-5 -4 -3 -2 -1 0 1 2 3 4
-1.5 -1 -0.5 0 0.5 1 1.5 PC1-->46.88% P C 5 --> 4 .6 1 % 1 2 3 4 5 6 7 8 9 10 11 12 13 14 15
-0.4 -0.35 -0.3 -0.25 -0.2 -0.15 -0.8 -0.6 -0.4 -0.2 0 0.2 0.4 0.6 PC1-->46.88% P C 5 --> 4 .6 1 % 1 2 3 4 5 6 7 8 9 10 11 12 13 IX X V III II VI VII XI XII VIII IV XIII I
-5 -4 -3 -2 -1 0 1 2 3 4
-1.5 -1 -0.5 0 0.5 1 1.5 2 PC1-->46.88% P C 6 --> 4 .1 2 % 1 2 3 4 5 6 7 8 9 10 11 12 13 14 15
-0.4 -0.35 -0.3 -0.25 -0.2 -0.15 -0.4 -0.3 -0.2 -0.1 0 0.1 0.2 0.3 0.4 0.5 0.6 PC1-->46.88% P C 6 --> 4 .1 2 % 1 2 3 4 5 6 7 8 9 10 11 12 13 IX X V IV I III II VI VII XI XII VIII XIII
variance, shows the difference between compound 14 and
all the remaining compounds. Compounds 7 and 9 are
characterized by high antiproliferative activity observed at the concentration of 100 µmol dm−3 for HCT-116 cells
(parameter VII). The differences between compound 14
and all the remaining compounds were attributed to high antiproliferative activity reported at the concentration of 100 µmol dm−3 for MDA-MB 231 cells (parameter I).
Concerning the compounds with an alkyl group at the benzyl substituent, compound 11 with the methyl group
shows better inhibition of MDAMB-231 cell proliferation at the lowest concentration compared to compound 13 with
the tert-butyl group. Compounds with a halogen substituent as R2 (12 and 14) have a superior antiproliferative capacity
to the other compounds in series of 5,5-diphenylhydantoins. The antiproliferative activity of 5,5-diphenylhydantoins 8
(R2 = OH), 9 (R2 = OCH3) and 12 (R2 = Cl) has previously
been reported against the renal cancer cell lines A498 and UO-31 at the concentration of 10 µmol dm−3.27 A significant
inhibition was observed; for example, maximal inhibition of 58.66% and 35.82% for A498 and UO-31, respectively, was achieved for compound 12. The replacement of the benzyl
moiety with 2-oxo-2-(4-(piperidin-1-yl)phenyl)ethyl group results in the increase of antitumor activity to 68.14% and 53.43% against A498 and UO-31 cell, respectively. It is assumed that this derivative of hydantoin is located well in the biological target. Molecular docking studies in the same paper show the structural features essential for the antitumor activity of hydantoins. Those fetures are: the presence of two aromatic rings separated by an average distance, a hydrophobic moiety, and an H-bonding acceptor. All those features are present in the structure of the hydantoins examined in our study.
Conclusions
Most of the investigated compounds show superior antiproliferative activity against MDA-MB-231 to that against HCT-116 cell line. HCA differentiates the activity of hydantoins at high and low concentrations of the investigated compounds. Only in the highest investigated concentration (100 µmol dm−3) antiproliferatve activity is
reverse for compounds 3-9 and 12.
PCA makes it possible to distinguish active compounds at different concentration levels. PC4 is an exception because it differentiates two most lipophilic compounds: 13 and 14
(with R2 = tBu and Br) from all the remaining samples. In
general, compounds from of 5,5-diphenylhydantoins (8-15)
exhibit higher antiproliferative activity compared to 5-ethyl-5-phenylhydantoins (1-7). This might be attributed to the
introduction of the additional phenyl group in position 5,
which contributes to the formation of a strong lipophilic shield around the hydantoin moiety. Hence, the lipophilicity of the investigated compounds may be an indication for their activity. A substituent attached to benzyl moieties (substituent R2) has an additional impact on the activity.
Hydantoins with the strong donating and electron-withdrawing R2 groups, such as NO2, CN or OCH3, decrease
lipophilicity. Conversely, the introduction of an alkyl or halogen substituent yields the highest values of lipophilicity. As expected, the replacement of one of the phenyl groups in position 5 with an ethyl group results in a decreased lipophilicity of 5-ethyl-5-phenylhydantoins (1-7) compared
to the corresponding derivatives of 5,5-diphenylhydantoins (8-15). It might be concluded that the higher the lipophilicity
of the compounds (11, 12, and 14), the higher the inhibition.
Supplementary Information
Supplementary data is available free of charge at http://jbcs.sbq.org.br as PDF file.
Acknowledgements
The presented results are part of the research project 172013 supported by the Ministry of Education, Science and Technological Development of the Republic of Serbia.
References
1. K a r o l a k - Wo j c i e c h ow s k a , J . ; K w i a t k ow s k i , W. ; Kiec-Kononowicz, K.; Pharmazie 1995, 50, 114.
2. Brouillette, W. J.; Brown, G. B.; Delorey, T. M.; Liang, G.; J. Pharm. Sci. 1990, 79, 871.
3. Brouillette, W. J.; Jestkov, V. P.; Brown, M. L.; Akhtar, M. S.; DeLorey, T. M.; Brown, G. B.; J. Med. Chem.1994, 37, 3289. 4. Thenmozhiyal, J. C.; Wong, P. T.-H.; Chui, W.-K.; J. Med.
Chem. 2004, 47, 1527.
5. Knabe, J.; Baldauf, J.; Ahlhem, A.; Pharmazie1997, 52, 912. 6. Luer, M. S.; Neurol. Res.1998, 20, 178.
7. Somsak, L.; Kovacs, L.; Toth, M.; Osz, E.; Szilagyi, L.; Gyorgydeak, Z.; Dinya, Z.; Docsa, T.; Toth, B.; Gergely, P.; J. Med. Chem.2001, 44, 2843.
8. Kassouf, W.; Tanguay, S.; Aprikian, A. G.; J. Urol. 2003, 169, 1742.
9. Khanfar, M. A.; El Sayed, K. A.; Eur. J. Med. Chem. 2010, 45, 5397.
10. Abadi, A. H.; Gary, B. D.; Tinsley, H. N.; Piazza, G. A.; Abdel-Halim, M.; Eur. J. Med. Chem.2010, 45, 1278.
12. Hmuda, S.; Trisović, N.; Rogan, J.; Poleti, D.; Vitnik, Ž.; Vitnik, V.; Valentić, N.; Bozić, B.; Ušćumlić, G.; Monatsh. Chem. 2014, 145, 821.
13. Bate-Smith, E. C.; Westall, R. G.; Biochim. Biophys. Acta1950,
4, 427.
14. Giaginis, C.; Tsantili-Kakoulidou, A.; J. Liq. Chromatogr. Rel. Technol. 2008, 31, 79.
15. Rutkowska, E.; Pajak, K.; Jozwiak, K.; Acta Pol. Pharm. Drug Research, 2013, 70, 3.
16. Vastag, G.; Apostolov, S. Lj.;Matijević, B. M.; Marinković, A. D.; J. Braz. Chem. Soc. 2014, 25, 1948.
17. MATLAB 6.1.0.450 release 12.1; The MathWorks: Natick, MA, 2001.
18. Massart, D. L.; Kaufman, L.; The Interpretation of Analytical Data by the Use of Cluster Analysis, Wiley: New York, 1983. 19. Vogt, W.; Nagel, D.; Sator, H.; Cluster Analysis in Clinical
Chemistry: A Model, Wiley: New York, 1987.
20. Kaufman, L.; Rousseeuw, P. J.; Finding Groups in Data: An Introduction to Cluster Analysis, Wiley: New York, 1990. 21. Romesburg, H. C.; Cluster Analysis for Researchers, Lifetime
Learning Publications CA: Belmont, 1984. 22. Ward Jr., J. H.; J. Am. Stat. Assoc.1963, 58, 236.
23. Takeda, Y.; Kajikawa, Y.; Sakata, I.; Matsushima, K.; Technovation2008, 28, 531.
24. Joliffe, T.; Principal Components Analysis, Springer: New York, 1986.
25. Howaniec, N.; Smoliński, A.; Energy2014, 128, 442. 26. Wold, S.; Chemom. Int. Lab. Syst.1987, 2, 37.
27. Alanazi, A.M.; El-Azab, A. S.; Al-Swaidan, I. A.; Maarouf, A. R.; El-Bendary, E. R.; Abu El-Enin, M. A.; Abdel-Aziz, A. A. M.; Med. Chem. Res. 2013, 22, 6129.
Submitted: March 16, 2015