Wear and Corrosion Study of Plasma Nitriding F53 Super duplex Stainless Steel
Joaquim Olímpio Pereira Netoa, Raphael Oliveira da Silvaa, Edilaine Honório da Silvab, Jeferson Apa-recido Moretoc,d, Rafael Marinho Bandeirae, Marcos Dorigão Manfrinatoa, Luciana Sgarbi Rossinoa,f*
Received: October 29, 2015; Revised: July 06, 2016; Accepted: August 20, 2016
Super duplex stainless steels (SDSS) have high corrosion resistance because of their high contents of chromium, nickel, molybdenum and nitrogen but low wear resistance. To improve the wear resistance of these steels without afecting their corrosion resistance, samples of SDSS were treated by plasma ion nitriding at temperatures ranging from 350 °C to 570 °C for two hours. This thermochemical treatment resulted in the formation of diferent types of nitrides that afected the microhardness, the microwear behaviour and the corrosion resistance of the metal surface. The microwear resistance decreased at 400 °C because diferent nitrides formed on the surface, thereby increasing the hardness and volume wear resistance of the steel. The test results showed that the alloys that were nitrided at 400 °C and 450 °C exhibited the highest corrosion resistance to a solution medium containing chloride ions.
Keywords: Microwear, tribological, Corrosion, Expanded austenite.
* e-mail: [email protected]
1. Introduction
The demand for wear- and corrosion-resistant components has stimulated growing interest in surface engineering as a means of enhancing the tribological and tribochemical properties of surfaces1.
Surface and thermochemical treatments are used to improve the wear resistance of metals. Plasma ionic nitriding, which was initially developed for ferrous alloys, is widely used for this purpose. In this treatment, nitrogen atoms are dissociated, ionised and transported at high velocities up to the surface of the metal part. A characteristic layer is created via the difusion of nitrogen on the metal surface, and the properties of this surface layer can be modiied by varying the process parameters2.
Plasma ion nitriding produces hard and wear-resistant surfaces via the formation of precipitates on the metal surface. Manfrinato3 has reported that this technique does not affect the metallic structure of the material and is efficient and not harmful to the environment because gases that are usually present in the atmosphere are used in the process.
The plasma ion nitriding process is generally used to improve the surface hardness and wear resistance of a material. This process improves the corrosion resistance of a metal, as has been veriied for SDSS ASTM A182. However, Liang4 has reported that relatively high temperatures increase the surface hardness and reduce the corrosion resistance of a metal because of the formation of chromium nitride (CrN). CrN is a phase that is fairly stable, brittle and less resistant to corrosion than the substrate4.
Super duplex stainless steel ASTM A182 has an austenitic/ ferritic structure with phases that are formed in exact proportion due to their chemical composition and thermal treatment. In addition to a high %Cr content, these alloys are characterised by a low carbon content “< 0.03% in weight” and contain alloy elements such as molybdenum, tungsten, copper and nitrogen5.These steels are called special alloys and are used in locations with aggressive atmospheres that require high corrosion resistance, in oil platforms, for ofshore activities, such as oil exploration, in piping systems, in evaporators, in distillers, and in storage tanks, among others6.
The objective of this study was to investigate the wear and corrosion resistance of SDSS ASTM A182 with and without surface treatment. The surface treatment that was used in the study was plasma ion nitriding at diferent temperatures. aSorocaba Technological College - FATEC, Av. Engenheiro Carlos Reinaldo Mendes, 2015, Alto da Boa
Vista, Zip code 18013-280, Sorocaba, SP, Brazil
bBelgian Nuclear Research Centre – SCK-CEN, Boeretang 200, 2400, Mol, Belgium
cFederal Institute Goiano – IF Goiano, Rodovia Sul Goiana Km 01, Zona Rural, Zip code 75.901-970,
Rio Verde, GO, Brazil
dInstitute of Exact Sciences, Naturals and Education, Federal University of Triângulo Mineiro (UFTM),
Avenida Doutor Randolfo Borges Júnior, Univerdecidade, Zip code 38.064-200, Uberaba, MG, Brazil.
eDepartment of Physical Chemistry, São Carlos Institute of Chemistry, São Paulo University, Avenida
Trabalhador São-carlense, 400, Zip code 13566-590, São Carlos, SP, Brazil
fFederal University of São Carlos - UFSCar, Rodovia João Leme dos Santos, Km 110, Bairro do Itinga,
2. Materials & Methods
The material used in this work was SDSS ASTM 182-10 (which is also known as F-53). Table 1 shows the actual (wt%) and nominal chemical compositions. Chemical analyses were performed in an optical emission spectrometer (Amtek, model Spectromax).
The specimens that were used in this study had dimensions of 30 x 20 x 10 mm. The plasma ion nitriding process was conducted at the Physics Department of the Federal University of São Carlos (Universidade Federal de São Carlos - UFSCar). The following initial parameters were used: a total pressure of 300 Pa, a gas mixture of 80% H2 and 20% N2, constant voltage of 350-400 V and duration of two hours. The treatment temperatures were 350 °C, 400 °C, 450 °C, 500 °C, 550 °C and 570 °C, in the order presented. The proiles of the nitrided layer at diferent temperatures were characterised using an Oxford Instruments scanning electron microscope (SEM), model Incax-Sight. X-ray dispersive energy spectroscopy (XDES) was used to verify the percentage of nitrogen in the nitrided layer.
The X-ray difraction analyses were performed at the University of São Paulo (Universidade de São Paulo) – Lorena Campus using a LabXShimadizu, model XRD-600 instrument. The time of analysis was 30 minutes for each nitrided sample at the diferent aforementioned temperatures, with a source voltage and an amperage of 40 kV and 30 mA, respectively, using a grazing incidence angle and a molybdenum ilter.
Two kind of test system can be used to analyses the microwear of the material behavior. They can be carried out with either the ixed ball type of system or the free ball test system7. The ixed ball coniguration is used to promote high normal contact load and consequently high stress in the contact. On the other hand, the free ball coniguration result in low normal load in the test. By enabling a wide adjust range, the ixed ball test system is broadly used to study the microwear in a variety of materials.
The microwear tests were carried out using a fixed ball microwear device, as can be seen in Figure 18. In this technique, a ball often of bearing steel, is pressed against the test sample in the presence or not of an abrasive slurry. The ball is clamped between coaxial shafts and driven by an electric motor. A flat specimen was mounted horizontally on the ball and is loaded against the ball by a dead weight. This microwear test produces a circular depression in the sample that can be measured (Figure 2) to determine the wear rate of the coating, and under some conditions the substrate material. After wear testing the wear scars was observed by optical microscopy (OM) to identify the dominant wear mechanism.
In this work a 52100 steel ball with 25.4 mm of diameter was used under a controlled contact load. The ixed frequency used in this test was 744 rpm. The normal loads used in the wear tests of the base material were 16 and 8.3 N, and the tests time were 2, 5, 10, 15, 20, 30 and 40 minutes. For the samples that received a surface treatment, the normal load used was 16 N and the test time 10 minutes. The tests were performed without any type of abrasive or lubricant liquid. After the tests were completed, the samples were analysed by OM using an OLYMPUS stereoscope, model SZ61, with a 6 Megapixel camera and Software analysis 2.0, which was used to measure the diameters and the crater radio generated in a coated system by rotation of the ball.
The wear volume (V) was deined by equation (2.1), where (C) represents the sliding distance and (K) the wear rate, determined by equation (2.2) and (2.3) respectively. The depth of the crater penetration was determined using equation (2.4)9:
( . )
V
r
b
b
r
64
<<<<
2 1
4
r
=
(
) . (
) . ( )
( . )
C
=
2
r
r
RPM
t
2 2
( . )
K
NC
V
2 3
=
( . )
H
r
V
2 4
r
=
where “b” denotes the diameter of the wear crater, “r” the radius of the standard ball that was used in the test, “t” is the test time, and N represents the normal load applied in the wear test.
Open circuit potential tests were performed to characterise the thermodynamic tendency of the F-53 steel to corrosion. The corrosion potential (Ecorr) was monitored for 4000 seconds before the potentiodynamic polarisation tests was performed.
Table 1: Chemical composition (wt%) and nominal chemical composition of F-53 steel
Element %C %Si %Mn %P %S %Cr %Mo %Ni N Fe
Exp. .029 .46 .99 .0032 .0005 24.6 3.6 7.3 0.245 62.6
Nom. .03 .8 1.2 0.5 0.02 24-26 3-5 6-8 .24-.32
-Figure 1: Microwear device.
Figure 2: Circular depression geometry (wear scar) produced in microwear test.
3. Results & Discussion
3.1. Base Material Metallography
Figure 3 shows the biphasic microstructure of the base material, which consisted of a matrix of austenite “CFC” (γ) and ferrite “CCC” (α). The black spots were most likely inclusions that were created in the steel production process.
3.2 Wear tests on the base material
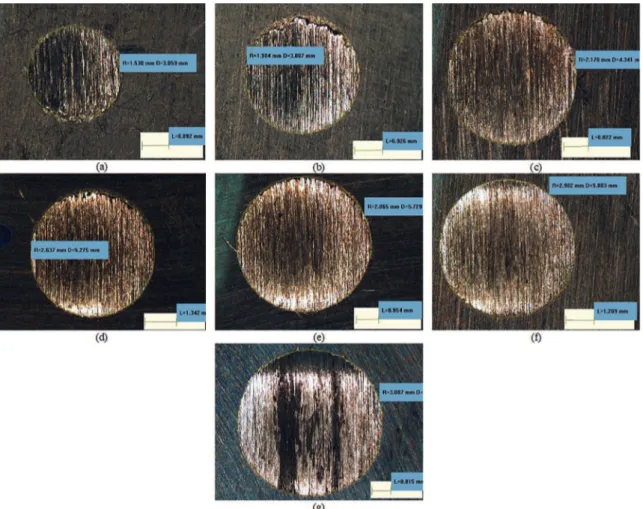
Figure 4 shows the caps that were produced in the microwear test for diferent sliding distances (under a 16-N load). The cap diameter was observed to increase with the sliding distance. However, the increase in the diameter was not linearly proportional to the sliding distance, that is, doubling the wear time did not double the diameter of the printed cap, even though continuous progressive wear was observed as the diameter increased.
Figure 3: SEM micrograph of F-53 steel; Beraha reagent was used for chemical attack.
The volume of wear has a linear relation with the product of the sliding distance, normal force and wear coeicient9,10.
The wear coeicient is constant with the time when the constant regime of wear is reached. In other hands, the analysis of the volume of wear in function of slide distance can be used to determine when the constant regime is reached. In fact, the constant regime was reached if it presents a linear variation with the sliding distance11.
The combination of the application of high loads under insuicient lubrication can cause severe adhesive wear on the surface of sliding metallic components. This damage is characterised by the presence of macroscopically visible fragments that adhere onto the two contact surfaces12. In our case, metal particles adhered to the respective sphere, which increased the severity of the wear on the material and left a wear track on the sphere. Abrasive wear between two bodies was the predominant wear mechanism that was observed in the tests that were performed in the present study, which resulted in macroscopic parallel lines that are called grooves13.
Figure 5 shows the caps resulting from the analysis of the test that was performed under an 8.3-N load, demonstrating that the samples sufered abrasive wear between two bodies.
Figure 4: Caps produced in the microwear test for diferent sliding distances under a 16-N load at (A) 2 minutes, (B) 5 minutes, (C) 10
minutes, (D) 15 minutes, (E) 20 minutes, (F) 30 minutes and (G) 40 minutes.
The formation of an oxide layer was observed in the print of the cap in Figure 5 (F). The presence of this oxide inhibited damage from wear and protected the surface during abrasion. However, increasing the test time (or the sliding distance) resulted in the removal of the oxide (Figure 5(G)).
The presence of the oxide layer was much more evident in the test under the 8.3-N load than under the 16-N load because ilm formation was facilitated at low loads. A protective ilm was formed in the 16-N test; however, this test was twice as severe as the 8.3-N test, and the ilm was removed before it could attain the structure that was observed in the 8.3-N test.
The formation of the oxide layer can be explained in terms of the efects of factors such as the temperature and the ease of passivation of the steel. Faria14 reported that
the oxidation ilm that is involved in the contact between two sliding metallic surfaces forms at high temperatures or ambient temperature and occurs at the contact between points of roughness.
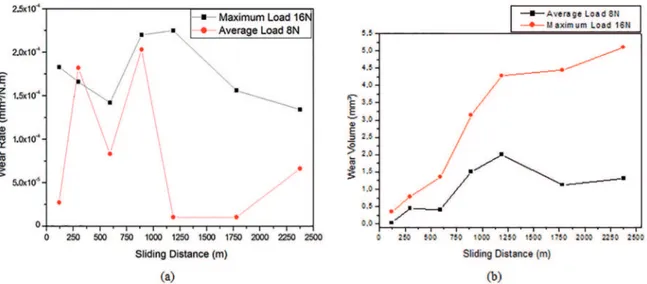
Figure 6 (A) shows that the test that was performed under a 16-N load was more severe and had a lower rate of variation in the wear than the test that was performed under an 8.3-N load. This latter result was obtained
because the less severe test under an 8.3-N load did not prevent the protective oxide layer from forming on the material surface. This phenomenon was only observed at low loads.
We consider that the formation and detachment of the oxide caused the large variation in the wear rate for different sliding distances under the 8.3-N normal load. The low observed wear rates for long sliding distances facilitated oxide formation because of the temperature of the tested surface. Increasing the severity of the test, i.e., increasing extrinsic parameters, such as the applied load, resulted in the rapid removal of the oxide layer that formed on the surface of the material. However, a more detailed study must be conducted to confirm this effect.
Figure 5: Caps produced in the microwear test for diferent sliding distances under an 8.3-N load at (A) 2 minutes, (B) 5 minutes, (C) 10
minutes, (D) 15 minutes, (E) 20 minutes, (F) 30 minutes and (G) 40 minutes.
The diminution of the wear volume and the consequent increase in the material wear resistance of the material under an 8.3-N load for sliding distances above 1250 m may be related to the formation of an oxide layer under the test conditions, as previously discussed.
Quinn15,16reported on studies in which a reduction of wear in steels was observed because of the formation of Fe2O3 oxide, which protects the surface against damage. The presence of oxides in the wear products has been observed in both dry and lubricated sliding.
The efect of oxidative wear in the test under the 8.3-N load in this study could be conirmed by constructing curves of the wear rate under the contact load to illustrate the wear transition that has been described by Cozza [12]. Further tests under diferent loads should be performed in a future study for this purpose.
3.3. Microhardness of the nitrided surface
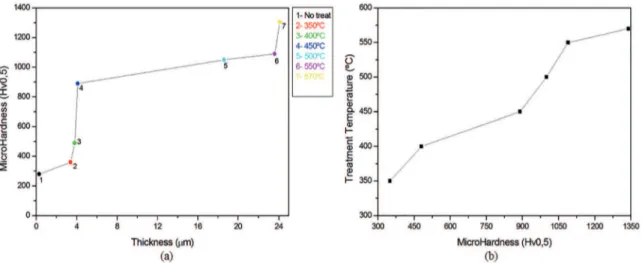
Figure 7 (A) shows the microhardness as a function of the thickness of the nitrogen layer that was formed on the material under study by the nitriding treatment. The microhardness increased with the thickness. Points 2, 3, 4, 5, 6 and 7 show the microhardness values for the nitrided materials, and point 1 shows that of the untreated material. The material surface hardness increased signiicantly with the thickness of the nitrogen layer; the hardness of point “7” (for nitriding at 570 °C) was almost 3.7 times higher than that of point “2” (for nitriding at 350 °C). Thus, the nitrogen saturation on the material surface increased with the nitriding temperature, which promoted the formation of the hardening phases. Therefore, the difusion of nitrogen increased with the surface hardness of the material.
Figure 7 (B) is a plot of the plasma ion nitriding process temperature as a function of the microhardness, which supports the previous explanation that the microhardness increased with the thickness of the nitrogen layer. The hardness did not increase in linear proportion to the temperature because
Figure 7: Microhardness as a function of (A) the layer thickness and (B) the treatment temperature.
the thickness of the difusion nitrogen layer was not linearly proportional to the treatment temperature. However, increasing any one of the three parameters of the hardness, the temperature and the nitrogen layer caused the other two parameters to increase.
3.4. Wear tests on the nitrided material
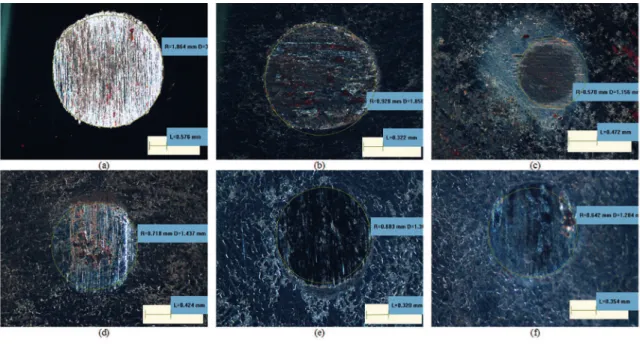
Figure 8 shows the results of the abrasive wear tests on the nitrided material. Figure 8 (A) shows that a very intense scratching process occurred along with the grooving phenomenon. The wear resistance of the material that was nitrided at 350 °C remained low compared to that obtained at the other treatment temperatures because of the thinness of the nitrogen layer that was produced at 350 °C. However, Figure 8 (B) shows that the wear resistance of the material that was nitrided at 400 °C increased because of the difusion nitrogen layer.
Figure 8 (C) clearly shows that the lowest wear rate was obtained by nitriding at 450 °C. The printed cap was very small with a 0.57-mm diameter. This phenomenon occurred because the increased temperature of the plasma ion nitriding process afected the formation of the hardening phases. But, with the temperature high to 500 oC, 550 oC and 570 oC (Figure 8d, 8e and 8f, respectively), the printed cap high determining the high of the volume of wear.
Figure 9(A) shows that the material had the lowest wear rate for the 450°C treatment. The wear rate reached a maximum for the 500 °C treatment and then began to decrease. Figure 9(B) was used to analyse the wear resistance of the material. The wear resistance increased such that the highest tribological resistance was observed for the 400 °C treatment. There was a 99.9998% increase in the wear resistance at this treatment temperature.
Figure 8: Caps produced in wear tests of nitrided materials under a maximum load of 16 N at (A) 350 ºC, (B) 400 ºC, (C) 450 ºC, (D) 500 ºC, (E) 550 ºC and (F) 570°C.
Figure 9: (A) Wear rate and (B) wear resistance of the material as a function of the nitriding temperature.
microhardness of 1300 HV, and as reported by Dalibon17, this extremely hard surface behaves in a brittle manner when it sufers abrasive wear under compression, where the breakage negatively afects the wear resistance.
In addition to the reduction in the wear resistance, some researchers have observed a decrease in the corrosion resistance of stainless steel as the nitriding temperature is increased. This result is obtained because of Cr impoverishing in a solid solution and the formation of hardening phases of nitrides6.
3.5. Composition of the nitrided layer
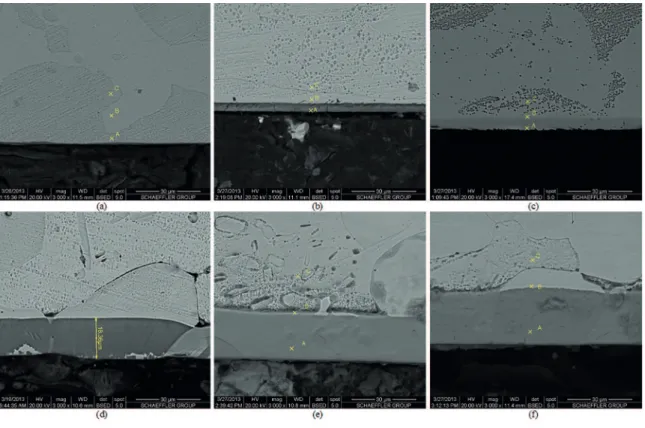
Figure 10 shows the metallography of the layers that were formed by the ion nitriding treatment. The clearer part
represents the substrate. The layer originated in the bakelite/ substrate interface. Table 2 shows the quantity of nitrogen (by wt%) at the interface points. At each treatment temperature, points A and B had higher nitrogen concentrations than point C, showing the eiciency of the plasma nitriding process.
Layer formation occurred by nitrogen difusion on the material surface, which explained the increase in the layer thickness after the difusion coeicient increased exponentially with temperature18. Figure 11 clearly shows that the thickness of the nitrogen difusion layer increased with the treatment temperature.
Table 2: Chemical composition along the layer at points A, B and C
Element Points 350°C 400°C 450°C 500°C 550°C 570°C
A 1.34% 2.06% 7.83% 10.37% 7.83% 11.96%
Nitrogen B 1.03% 2.54% 5.27% 1.65% 6.09% 5.60%
C 0.39% 0.91% 2.15% 1.11% 1.70% 1.82%
Figure 10: Micrography of the nitrided layers at diferent nitriding temperatures: (A) 350 °C, (B) 400 °C, (C) 450 °C, (D) 500 °C, (E)
550 °C and (F) 570 °C.
Figure 11: Thickness of the nitrided layer as a function of the treatment temperature.
increased. The thickness of the nitrided layer increased with the temperature, but this phenomenon was not always observed. Reis19 has shown that increasing the nitriding
temperature of a 316L steel to 750 ºC, 850 ºC and 1150 ºC decreased the thickness of the difused layer to 264.2 µm, 181.6 µm and 12.8 µm, respectively.
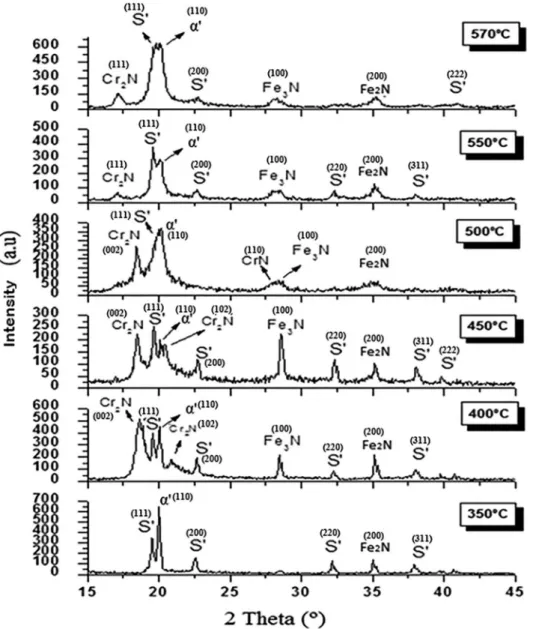
3.6. X-ray difraction analysis
Figure 12: X-ray difractograms for various nitriding conditions.
However, the formation of the S’ phase or expanded austenite results in high mechanical resistance and compressive strength with high hardness because of the insertion of nitrogen as an interstitial solid solution in the crystal lattice. The resulting distortions in the lattice impede defect motion, thus providing good wear resistance. The α’ phase, or expanded ferrite, exhibits the same characteristics as the S’ phase but has less capability to solubilise nitrogen in the interstices because of the lower lattice parameter of the α’ phase20.
The formation the S’ phase was preferred, and only Fe2N nitrides were formed at the treatment temperature of the plasma ion nitriding process (350 °C). However, the thin difusion layer that formed was able to increase the wear resistance of the material by ive thousand times over that of the base material.
In addition to the formation of the S’ phase, the formation of hardening phases, such as Cr2N, Fe3N and Fe2N, was also initiated at 400 °C. Both nitrides exhibited high hardnesses. Pinedo1 has reported that chromium nitride is harder than
iron nitride. The S’ and α’ phases were also present, which contributed to the reduction in the wear rate.
Figure 12 shows that the difractogram that was obtained at 450 °C was very similar to that obtained at 400 °C, with very intense peaks in the 19 to 21° range that corresponded to the formation of Cr2N, S’, α’ and other substances, such as Fe3N and Fe2N, along the DR-x angles. At this temperature, higher amount of diferent types of S’ phases were observed, although the layer was not very thick, being only 59.32% thicker than that obtained at 400 °C.
S’ phase and diferent types of nitrides, such as CrN, Cr2N, Fe2N and Fe3N, which resulted in a very high hardness and an increase in the wear rate of the material surface. Nitrides are very hard and cannot withstand compressive abrasive wear, breakage and increases in the wear rate.
The layer thickness at 570 °C was 2.85% thicker than that at 550 °C, which in turn resulted in a lower wear rate than that at 500 °C.
The wear resistance of the nitrided material increased because of the presence of diferent types of S’ phases that produced the tribological properties of the formed layer. This phase was created by nitrogen supersaturation in the austenitic matrix, where the phase remained as a solid solution that occupied the octahedral voids of the face-centred cubic crystal lattice. The interstitial element was present in much higher quantities than the solubility limit, which resulted in an elastically distorted and thermodynamically metastable structure. This structure promoted a state of residual compressive stresses, which resulted in a high hardening efect from the phases that formed during the nitriding process. However, the elastic modulus of expanded austenite remained unchanged21, which enhanced the material wear
resistance. Nie, Leyland and Matthews22 and Tschiptschin and Pinedo23 have reported that the stresses in the substrate/ coating interface can be minimised by matching the elastic modulus of the coating to that of the substrate, which enhances the system performance. Thus, the formation of expanded austenite should enhance the tribological properties of steel because expanded austenite has a hardening efect and its elasticity modulus is near that of the substrate23.
3.7. Corrosion tests
Figure 13 shows the open circuit potential curves of F-53 steel at diferent nitriding temperatures over a 4000-second period before the potentiodynamic polarisation tests were performed. Note that all of the tests were repeated three times and showed good reproducibility. The results of the F-53 steel potentiodynamic polarisations at diferent nitriding temperatures are shown in Figure 14.
The open circuit potential curves showed that F-53 steel had a higher corrosion resistance at 400 °C and 450 °C (see the Ecorr values). The results of the open circuit potential tests showed that the steel that was nitrided at 400 °C stabilised within a few minutes.
The potentiodynamic polarisation curves of the material showed diferent behaviours for diferent nitriding temperatures. F-53 steel that was treated at 400 °C and 450 °C exhibited superior resistance to corrosion and very similar corrosion current densities (icorr), which indicated that almost the same area was occupied by the cathodic sites at both temperatures. These results corroborated the results of the X-ray difraction analyses, that is, almost the same phases, Cr2N, S’ and α’, formed in the material at both temperatures. Note that a much larger passive region formed at 400°C and 450 °C than at the other temperatures.
Figure 13: F-53 steel open circuit potential measurements at diferent
nitriding temperatures for an immersion period of 4000 seconds.
Figure 14: F-53 steel potentiodynamic polarisation curve at diferent
nitriding temperatures for a 0.6 M NaCl solution and a 0.5 mV. s-1 rate.
Regarding the other temperatures, the corrosion resistance is thought to diminish as the Cr2N content of the material increases. However, we did not verify whether this precipitate actually controlled the Ecorr values that were found in the tests in this study.
Silva24 reported that nitride nucleation occurs in defects, inclusions, grain contours and interfaces. In duplex steels, Cr2N rods or CrN platelets precipitate from ferrite. Modenesi25 reported that under thermal treatment, Cr2N precipitation occurs in the δ/δ or δ/γ grain contours. Secondary austenite is one of the products of Cr2N formation, which leads to Cr-impoverishment and deteriorates the corrosion resistance of the alloy.
4. Conclusions
F-53 steel without surface treatment exhibited a low wear resistance compared to the material with plasma thermochemical treatment.
More material was removed under a 16-N load than under an 8.3-N load because the more severe test resulted in a highly intense interaction between the surfaces in contact. The test under the 8.3-N load resulted in the formation of a thin oxide ilm that interfered with the result and drastically reduced the volume of the substrate that was removed at longer sliding distances.
The material that was treated at 350 °C had a low wear resistance because the nitrogen layer produced in the test was very thin and S’ and α’ phases and iron nitride formed without the formation of chromium nitrides.
The material that was treated at 400 °C exhibited the highest wear resistance of the samples investigated, along with the formation of chromium and iron nitrides and S’ and α’ phases with a nitrogen layer that was twice as thick as the layer that formed at other treatment temperatures.
The formation of chromium and iron nitrides and S’ and α’ phases was observed at 450 °C. However, the layer thickness was similar to that at 400 °C, although the percentage of nitrogen was more uniform throughout the layer.
The layer that was produced at 500 °C was much harder and thicker than the layers that formed at other treatment temperatures but had a lower wear resistance. This result was obtained because of the formation of diferent types of nitrides, such as CrN, Cr2N, Fe3N and Fe2N, which provided high hardness and low wear resistance.
There was a reduction in the wear resistance at 550 °C and 570 °C because of the formation of diferent types of S’ phases that were in equilibrium with the nitride phase.
The alloys that were nitrided at 400 °C and 450 °C exhibited the highest corrosion resistance to the solution medium containing chloride ions. The corrosion resistance is thought to diminish as the Cr2N content in the material increases. Thus, other electrochemical techniques, such as electrochemical impedance spectroscopy (EIS), the scanning vibrating electrode technique (SVET) and the scanning Kelvin probe (SKP), could be used to better characterise the corrosion process.
5. Acknowledgements
The authors would like to thank the scientists at the Federal University of São Carlos (Universidade Federal de São Carlos – UFSCar) for performing the plasma ion nitriding thermochemical treatment, the scientists at the University of São Paulo/ Lorena (Universidade de São Paulo – USP/Lorena) for collaborating with us in the X-ray difraction analyses, the National Council for Scientiic and Technological.
Development (Conselho Nacional de Desenvolvimento Cientíico e Tecnológico – CNPq) for providing a scholarship and Federal Institute Goiano (IF Goiano) for inancial support.
6. References
1. CE Pinedo. Tratamento supericial para aplicações tribológicas. [Surface treatment for tribological applications]. Metalurgia & Materiais. 2004;60:162-169.
2. Alves Jr CA, Rodrigues JA. Nitretação dos aços assistida por plasma - variabilidade de uso para as indústrias nacional. [Plasma-aided steel nitriding - use variability for the national industry]. Metalurgia - ABM. 1991;47(398):354-355.
3. Manfrinato MD. Inluência da nitretação a plasma no comportamento
em fadiga dos aços inoxidáveis austeníticos AISI-SAE 304 e
316 [Efect of Plasma Nitriding on the Fatigue Behaviour of
Austenitic Stainless Steels AISI-SAE 304 and 316]. [Dissertation]. São Carlos: Universidade de São Paulo; 2006.
4. Liang W, Bin X, Zhiwei Y, Yaqin S. The wear and corrosion properties of stainless steel nitrided by low-pressure plasma-arc source ion nitriding at low temperatures. Surface and Coatings Technology. 2000;130(2-3):304-308. doi: 10.1016/
S0257-8972(00)00713-1.
5. Solomon HD, Devine TM.Duplex stainless steels: a tale of two phases. Metals Park: American Society for Metals; 1982. 64 p.
6. O’Brien 1991; Larsson 1993. Apud Baldin GCA. Caracterização
frenteà corrosão dos aços inoxidáveis super duplex endurecidos
supericialmente por nitretação a plasma [Corrosion characterisation of superduplex stainless steels with surface hardening by plasma nitriding]. [Final paper]. Porto Alegre: Universidade Federal do Rio Grande do Sul (UFRGS); 2010.
7. Gee MG, Gant AJ, Hutchings IM, Kusano Y, Schifman K, van Acker K, et al. Results from an interlaboratory exercise to validate the micro-scale abrasion test. Wear. 2005;259(1-6):27-35. doi: 10.1016/j.wear.2005.02.092.
8. Santos WC, Pereira Neto JO, Silva RO, Rodrigues G, Moreto JA, Manfrinato MD, et al. Apparatus development and study of abrasive microwear behaviour of quenched and tempered AISI 420 steel. Matéria (Rio J). 2015;20(2):304-315. doi: 10.1590/
S1517-707620150002.0031.
9. Rutherford KL, Hutchings IM. A micro-abrasive wear test, with particular application to coated systems. Surface and Coatings Technology. 1996;79(1-3):231-239. doi:
10.1016/0257-8972(95)02461-1.
10. Hutchings IM. Abrasive and erosive wear tests for thin costings: a uniied approach. Tribology International. 1998;31(1-3):5-15.
11. Trezona RI, Allsopp DN, Hutchings IM. Transitions between two-body and three-two-body abrasive wear: inluence of test conditions in the microscale abrasive wear test. Wear. 1999;225-229(Part 1):205-214. doi:10.1016/S0043-1648(98)00358-5.
12. Cozza RC. Estudo do comportamento do coeiciente de desgaste
e dos modos de desgaste abrasivo em ensaios de desgaste micro-abrasivo [Wear coeicient and wear mode transition study in
13. Tedesco NR. Caracterização do comportamento de desgaste de
cerâmicas de alumina densa: efeitos de parâmetros do ensaio do tipo pino no disco [Characterisation of the Wear Behaviour
of Dense Aluminum Ceramics: Efects of the Pin Type on Disk Test Parameters]. [Masters Thesis]. São Carlos: Universidade Federal de São Carlos (UFSCar); 2010.
14. Moré Farias MC. Inluência da velocidade de deslizamento da
carga normal e da transformação martensítica induzida por deformação plástica na resistência ao desgaste por deslizamento dos aços inoxidáveis austeníticos [Inluence of sliding velocity, applied load and strain-induced martensitic transformation on the sliding wear resistance of the austenitic stainless steels]. [PhD Thesis]. São Paulo: Escola Politécnica da Universidade de São Paulo; 2004.
15. Quinn TFJ. Review of oxidational wear: Part I: the origins of oxidational wear. Tribology International. 1983;16(5):257-271.
doi: 10.1016/0301-679X(83)90086-5.
16. Quinn TFJ. Oxidational wear modelling: I. Wear. 1992;153(1):179-200. doi: 10.1016/0043-1648(92)90269-E.
17. Dalibon EL, Lasorsa C, Cabo A, Cimetta J, Garc’a N, Brühl SP. Tribological properties of SiNx ilms on PH stainless steel with and without nitriding as a pre-treatment. Procedia Materials Science. 2012;1:313-320.
18. Callister WD Jr., Rethwisch DG. Ciência e Engenharia de Materiais – Uma Introdução [Materials Science and Engineering]. Rio de Janeiro: Livros Técnicos e Cientíicos Editora; 2008. 19. Reis RF, Schreiner WH, Borges PC. Nitretação do aço inoxidável
AISI 316L a altas temperaturas: Inluência na camada nitretada [High-temperature nitriding of AISI 316L stainless steel: Efect on the nitrided layer]. Revista Brasileira de Aplicações de
Vácuo. 2006;25(3):183-187.
20. Oliveira AM. Nitretação e carbonitretação por plasma em aços
inoxidáveis e suas inluências nas resistências à corrosão e ao
desgaste [Plasma nitriding and carbonitriding in stainless steels
and their inluences in the corrosion and wear resistances]. [PhD Thesis] São Carlos: Universidade de São Paulo; 2005.
21. Christiansen T, Somers MAJ. On the crystallographic structure of S-phase. Scripta Materialia. 2004;50(1):35-37. doi: 10.1016/j.
scriptamat.2003.09.042.
22. Nie X, Leyland A, Mattheus A. Low temperature deposition of Cr(N)/TiO2coatings using a duplex process of unbalanced
magnetron sputtering and micro-arc oxidation. Surface and Coatings Technology. 2000;133-134:331-337. doi: 10.1016/
S0257-8972(00)00953-1.
23. Tschiptschin AP, Pinedo CE. Structure and properties of an austenitic stainless steel AISI 316L grade ASTM F138 after low temperature plasma nitriding. Rem: Revista Escola de Minas. 2010;63(1):137-141. doi:
10.1590/S0370-44672010000100023.
24. Silva ILA. Efeito da Temperatura na Microestrutura e Oxidação
de Um Aço Inoxidável Superduplex [Efect of Temperature on the
Microstructure and Oxidation of a Superduplex Stainless Steel]. [Masters Dissertation]. Campos dos Goytacazes: Universidade Estadual do Norte Fluminense Darcy Ribeiro; 2010.
25. Modenesi PJ. Soldabilidade dos aços inoxidáveis [Weldability of stainless steels]. Coleção Tecnologia da Soldagem 1. São Paulo: SENAI-SP; 2001. 100 p.
26. Weiss B, Stickler R. Phase instabilities during high temperature exposure of 316 austenitic stainless steel. Metallurgical Transactions. 1972;3(4):851-866. doi: 10.1007/BF02647659.
27. Southwick PD, Honeycombe RWK. Decomposition of ferrite to austenite in 26%Cr-5%Ni stainless steel. Metal Science. 1980;14(7):253-261. doi: 10.1179/030634580790426418. 28. Brandi SD, Padilha AF. Weldability of duplex stainless steel
UNS S31803. In: Proceedings of 73rd American Welding
Society Annual Meeting; 1992 Mar 22-27; Miami, FL,
USA. p. 22-23.
29. Hertzman S, Roberts W, Lindenmo M. Microstructure and properties of nitrogen alloyed duplex stainless steel after welding treatments. In: Proceedings of Duplex Stainless Steel 86 International Conference; 1986 Oct 26-28; The Hague,
Netherlands. p. 257-267.
30. Ramirez AJ, Lippold JC, Brandi SD. The relationship between chromium nitride and secondary austenite precipitation in duplex stainless steels. Metallurgical and Materials Transactions A. 2003;34(8):1575-1597. doi: 10.1007/
s11661-003-0304-9.
31. Brandi SD, Lippold JC, Lin W. Efect of preheat temperature on multipass HAZ performance of duplex stainless steels. In:
Proceedings of 76th American Welding Society Annual Meeting; 1995 Apr 2-7; Cleveland, OH, USA. p. 32.