ABSTRACT: In this work, an interface tracking method is employed to simulate the ablative process in the region near the stagnation point of the VSB-30 sounding rocket Thermal Protection System (TPS). The ablation model considers the presence of two-fronts, the char-melting and the pyrolysis fronts. The results for the proposed model are compared to the ones obtained from the traditional one-front model, which supposes a constant ablation temperature. Results show that the one-front model overestimates the ablation period, mass loss and the internal temperature after the light. The increase in the accuracy with this model shall provide a better dimensioning of the TPS, reducing its weight and cost.
KEYWORDS: TPS, ablation, moving boundary, computational simulation, sounding rocket.
Simulation of Ablation in a Sounding Rocket
Thermal Protection System Via an Interface
Tracking Method with Two Moving Fronts
Humberto Araujo Machado1
INTRODUCTION
Sounding rockets are extensively used to provide microgravity environments for scientific experiments. The Institute of Aeronautics and Space (Instituto de Aeronáutica e Espaço – IAE) of Brazil has designed, built and launched hundreds of rockets along the past 40 years. he VSB-30 sounding rocket is a two-stage unguided solid propellant rocket used by the Brazilian Space Agency (AEB) and European Space Agency (ESA).
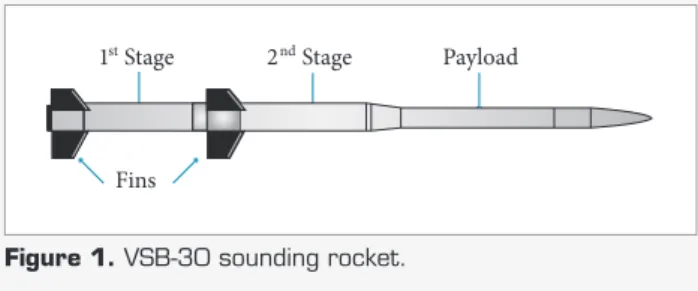
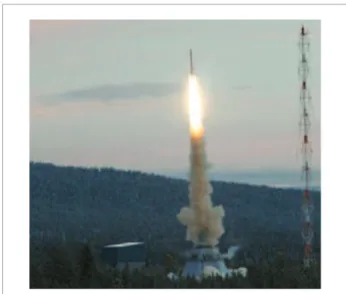
Figure 1 shows a schematic representation of VSB-30. It has a total length of 13 m and a diameter of 0.6 m. It is equipped with two solid propellant motors, namely S31 and S30. S31 acts as a booster during its 15 s burning time, whereas S30 burns for about 30 s, reaching an apogee of 250 km, for a payload mass of 400 kg. VSB-30 was developed by IAE in cooperation with the German Space Agency (DLR). So far, several VSB-30 successful lights occurred, from Alcântara Launch Center (CLA), in Brazil, and from Esrange, Sweden (Garcia et al., 2011), Fig. 2. During its light, VSB-30 provides 6 minutes of microgravity environment. It is worth mentioning that an S30 motor developed and fabricated by IAE equipped the VS-30-Orion rocket used by Sharp Edge Flight Experiment (SHEFEX) (Turner et al., 2005).
Figure 3 presents the nominal altitude-velocity map for a VSB-30 atmospheric flight. According to Fig. 3, VSB-30
1.Instituto de Aeronáutica e Espaço – São José dos Campos/SP – Brazil
Author for correspondence: Humberto Araujo Machado | Praça Marechal Eduardo Gomes, 50 – Vila das Acácias | CEP 12.228-904 São José dos Campos/SP – Brazil | Email: [email protected]
Received: 27/06/13 | Accepted: 23/10/13
1st Stage 2nd Stage Payload
Fins
o
0 100 200 300 400 500 0
40 80 120 160 200 240 280
0 100 200 300 400 500
0 500 1000 1500 2000 2500
Altitude, km Velocity, m/s
Figure 3. VSB-30 altitude-velocity maps.
reaches the speed of 7,500 km/h (2,100 m/s) while still lying within the atmosphere. For practical purposes the dense part of the atmosphere is assumed to be 90 km thick. Beyond 90 km, vacuum conditions are assumed.
As a result of such very high speeds, aerodynamic heating arises as a major problem in the VSB-30 design. his problem is larger near the stagnation regions, such as those existing at the nose cap and the ins leading edges, where temperature surpasses 2,100°C (Machado and Pessoa-Filho, 2007). Indeed, it is mandatory to obtain an accurate evaluation of the reached heat lux and the temperatures, in order to correct size the thermal protection. Along the years ablative materials have been efectively used as TPS of space vehicles. his is the case of the nose cap of VSB-30, where a composite material, like Si-phenolic resin, is used (Da Costa et al., 1996; Tick et al., 1965), Fig. 4.
Figure 2. VSB-30 takes off from Esrange, Sweden.
R 10.0
41.2
63.6
36º
he conventional ablation model considers one front and treats ablation as single phase change process at constant temperature. In this work a model for the ablative process with two moving fronts (char-melting and pyrolysis) is applied in the computational simulation of the ablation in the thermal shield (TPS) of the VSB-30 sounding rocket, in the vicinity of the stagnation point. he objective is to compare the results of the two models, in order to evaluate the diference in design parameters, like external temperature and surface variation.
his work is an extension of the previous work of Machado (2012a), in which the validation of the two-fronts model and the numerical method for ablation can be found. In that work, the two-fronts model has been already compared with some experimental results, presenting a much better agreement than the one-front model. Such procedure will allow a more accurate dimensioning of the rocket thermal protection system, contributing for project optimization.
The interface tracking method proposed by Unverdi and Tryggvason (1992) was employed to solve the moving front problem. his method is based in a hybrid Eulerian-Lagragean approach that presents the advantage of using a regular homogenous mesh and represents the interface as accurate as more points are added to the grid. he equations of mass and energy conservation in their diferential form are used to represent the thermal and ablative behavior of the heat shield with the time related to local temperature and thickness variations and solved through the inite volume method.
In the following sections, the physical problem and the method of solution are described, and the final results for the ablation are presented.
PHYSICAL PROBLEM AND
MATHEMATICAL MODEL
AERODYNAMIC HEATING
To predict the heat transfer on VSB-30, it is necessary to know the pressure, temperature and velocity ields around the rocket. That can be accomplished by numerically solving the boundary layer equations. However, such a procedure is expensive and time consuming. In the present work a simpler, but reliable, engineering approach is used, which allows to obtain the convective heat transfer coeicient and the representative environment temperature for heat exchange without needing
of a numerical solution of the boundary layer equations. he following simplifying assumptions are made:
• zero angle of attack;
• the rotation around its longitudinal axis is neglected;
• atmospheric air is considered to behave as a calorically and thermally perfect gas (no chemical reactions).
Although those hypotheses are not exact, they provide a good approximation to the real situation for the case of a ballistic reentry and for VSB-30 light in particular, as shown by Machado (2012b). Such hypotheses should be revised in the case of planetary reentry.
The free stream conditions ahead of the nose cap are those given by v∞, T∞, p∞, corresponding, respectively, to velocity, temperature and pressure. By knowing v∞ and altitude, as function of time, together with an atmospheric model (U.S. Standard Atmosphere, 1976), it is possible to evaluate the free stream properties. For supersonic flow (M∞>1), a bow shock wave appears ahead of the nose. By using the normal shock relationships (Anderson Jr., 1989), it is possible to calculate
v1, T1 and p1 ater the shock, in the centerline.
he heat lux over the external surface was calculated through the Zoby’s method (Zoby et al., 1981; Miranda and Mayall, 2001). his method employs the heat lux calculation at the stagnation point, obtained through the method of Cohen, as a starting point to integrate the temperature distribution inside the thermal boundary layer over the external surface. hat distribution is computed by relating heat transfer to a skin-friction relation based on the momentum thickness through a modiied Reynolds analogy form. Corrections for the compressibility (using the Eckert’s reference enthalpy relation) and turbulence are added to the calculation. The velocity, temperature and pressure outside the boundary layer are assumed to be that estimated ater the shock. he method can be employed in constant and variable entropy-edge conditions and both, reacting and non-reacting gas mixtures. Details of the solution can be found in the work of Machado (2008). Using the Zoby’s method, the convective heat transfer coeicient, H, is calculated along the y-coordinate that is measured along the body’s surface: y = 0 corresponds to the stagnation point, and R is a geometric parameter shown in Fig. 5, in which the red line represents the nose cap surface.
o
temperature (Taw), also called recovery temperature (Tr), at stagnation point are shown in Fig. 6. An energy balance at the surface, accounting the radiative heat transfer, provides the heat absorbed by the wall.
HEAT CONDUCTION AND ABLATION
Once the convection heat transfer and the adiabatic wall temperature are known, wall temperature distributions can be determined solving the heat transfer equations. VSB-30 nose cap is covered with a composite material (Si-Phenolic resin), which works as an ablative TPS. Until the ablation temperature is reached, a transient heat conduction process
y
R
y = 0 r
z
Figure 5. Coordinate system.
0 100 200 300
H - Convective heat transfer coefficient Tr - Recovery temperature
400 500
0 400 800 1200 1600 2000
H, W/m
2 K and Tr, K
time, s 2400
Figure 6. Recovery temperature and convective heat transfer coefi cient at stagnation point, obtained through the Zoby’s Method, during VSB-30 trajectory.
occurs. Once the TPS surface reaches the ablation temperature, its thickness is reduced; therefore, a transient, coupled conduction, moving boundary problem appears. In this work, the ablation model proposed for a composite material will consider the presence of two layers: the virgin material and the char layer that appears after the pyrolysis front. Two moving fronts will be accounted for: the pyrolysis front and the ablation front of the char layer, both starting at constant temperatures.
h e set of equations used to represent the physical problem is written according to the interface tracking method (Juric, 1996). h e nose cap and the surrounding airl ow are represented as parts of a continuous domain of calculation. h e application of the energy conservation principle to an ini nitesimal volume element in the mathematical domain leads to a partial dif erential equation for the temperature, namely:
(1)
where ρ is the density, Cp is the specii c heat, T is the temperature,
t is the time, K is the thermal conductivity and Q is a source term that accounts for the net heat exchange at the fronts, which will be mathematically represented as interfaces:
(2)
where x is the position in the coordinate system, xF is the interface position, A is the area, and q is the source term of energy per unit of surface of the interface and must be adapted to the physical model used to represent the behavior of each interface. h e following hypothesis will be assumed to build the mathematical model for the ablative and heat conduction processes in the structure:
• solid materials are considered isotropic with constant properties;
• the pyrolisis zone is considered a zero thickness front. Pyrolisis enthalpy and temperature are considered constant;
• the char layer recession occurs through oxidation or sublimation, at constant temperature. h e aerodynamic removing of material is neglected;
• absence of melting layer;
• full reaction of the gases and perfect mixing with the air in the boundary layer around the external surface, with negligible inl uence over the air physical properties;
• the l ow i eld around the surface is not af ected by the change in the surface geometry and gas injection;
• radiation is absorbed or emitted for surface, but not transmitted.
All these assumptions have being used in previous studies (Machado, 2012a), with successful results in representing the physical process. h e second assumption, in particular, was studied by Sias (2009), which has concluded it was accurate enough, when compared to more complex models for ablation. All the chemistry occurring in the ablative process is implicit and is included in the ablation parameters (heat and temperature of pyrolysis). Although the hypothesis of perfect gas behavior for air might yield inaccurate results for the recovery temperature, it occurs in altitudes where the convective heat transfer coei cient approaches to zero, resulting in a negligible heat l ux over the surface, and should not af ect the ablation. According to these hypothesis, the heat balance in the external surface yields:
(3)
where Vis the interface velocity, L is the heat of ablation of
the char layer, H is the convection heat transfer coei cient,
TF is the interface temperature and Taw is the adiabatic wall temperature, also called recovery temperature of the air, ε is the emissivity and σ is the Boltzman constant. One should note that this term might exist in every moving interface. In the pyrolisis front it is simplii ed, once there is no convection to or from the external l ow and the radiative heat transfer is supposed to not occur between the layers (since there is no transmission):
(4)
In this case, Lp is the heat of pyrolisis. h e l ux of injection gases is also neglected due its low specii c mass, when compared to the solid material. It is remarkable that the specii c mass that appears in Eqs. 3 and 4 is the interface specii c mass.
Although the airflow is included in the domain, its effects are implicit in the convection coefficient H. As a consequence, this region is considered adiabatic, and the heat capacity and thermal conductivity are assumed to be null. Once ablation temperature (TA) is reached, the interface condition becomes:
(5)
A similar jump condition appears in the pyrolisis front (the pyrolisis temperature, Tp,replacing TA).
METHOD OF SOLUTION
h e moving boundary problem was solved by the Interface Tracking Method, introduced by Unverdi and Tryggvason (1992), and employed by Juric (1996) in the solution of phase change problems. In this method, a i xed uniform Eulerian grid is generated, where the conservation laws are applied over the complete domain. h e interface acts as a Lagragean referential, where a moving grid is applied. h e instantaneous placement of the interface occurs through the constant remeshing of the moving grid, and each region of the domain is characterized by the Indicator Function, which identii es the properties of the wall and the air around it.
h is method allows for the representation of any geometry used in the TPS, and also the characterization of every layer separately. It is accomplished without a high increase in the computational cost and does not need any pre-processing (construction of unstructured grid or coordinate transformation). In this work, this method is employed to estimate the ablative performance of the TPS, considering a two-dimensional approach in both, the heat conduction and the moving boundary problem. Although here an axisymmetric simulation is performed, the method can be applied to any 2-D geometry. h e method is detailed described in the previous work of Machado (2012a), and will be briel y summarized as follows.
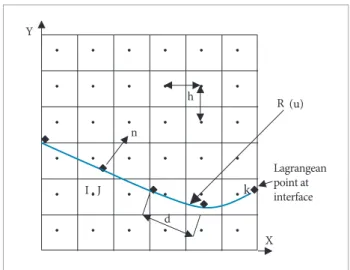
h e interface is represented as a parametric curve, R(u), where the normal and tangent vectors and curvature are extracted from. h e interface points are interpolated by a 4th
order Lagrange polynomial that uses two points before and two at er the point to be interpolated, which allows one to analytically obtain the geometric parameters and remeshes the curve, keeping the distance d between curve points within the interval 0.9 < d/h < 1.1, where h is the distance among the i xed grid points, as shown in Fig. 7.
o
(6)
where n is the normal unitary vector, and the term δ(x - xf) should be zero, except over the interface, as represented by the Dirac delta function, δ. However, such a representation is not convenient for a discrete number of points, since the Lagrangian points, xk, do not necessarily coincide with the Eulerian grid points, xi,j. h e Distribution Function is used to represent the interface discontinuity as a continuous and smooth function. Such a function is similar to a Gaussian distribution function and its value depends on the distance |xij - xk| between the Lagrangean and Eulerian points:
(7)
where Dijis the Distribution Function for a point k in the Lagrangean mesh with respect to a Eulerian point (xi,yj). One should note that increasing h results in a thicker interface. h e function f is the probability distribution related to the distance h as:
< < =
2 x if
2 x 1 if x 2 1/2
1 x if
1 1
0
) ( f ) x ( f
) x (
f (8a)
(8b)
h e divergence of the gradient i eld is found by numerical derivation of Poison’s equation:
(9) Despite being considered constants in each phase, the properties inside the domain must be treated as variable in the formulation. A generic property φ (ρ, Cp or K) is expressed as:
(10)
where f0andf1 are the property values for phases 0 and 1 (according to their values of indicator function), respectively.
h e coupling between the moving mesh and the i xed grid is done at each time step, through the Distribution Function, used to represent the source terms in the balance equations and to interpolate the ini nitesimal discontinuities into a i nite
thick region at the interface. In a similar manner, this function is used to interpolate the i eld variables from the Eulerian grid to the interface. h e equations used to distribute the source term in the i eld and interpolate variables to the interface are:
(11)
(12)
where Dskis the average of the straight line distances from the point k to the two points on either side of xk, and corresponds to the area concerned to the point xk in the interface surface. Equation 11 is the dicretized form of Eq. 2, where the Dirac delta function was replaced by the distribution function, Di,j, which is also done in Eq. 6.
The initial interface shape, R(u), is first specified and then the Indicator Function is constructed. From the initial conditions, the property and temperature i elds are determined. Out of the ablative period, the interface temperature keeps bellow the ablation temperature, and the energy equation is solved as a pure heat conduction problem, via the Finite Volume Method, employing the well-known FTCS discretization in an explicit time marching schedule (Patankar, 1980).
As the interface reaches the ablation temperature at a given point, an iterative process starts up, in order to determine the interface velocity at each time step, which must satisfy the temperature condition, Eq. 5, at that interface point. h e process goes on as far as the point temperature is equal to ablation temperature. h e steps to be followed are:
n
Lagrangean point at interface I , J
X Y
k
d h
R (u)
1. using the current value of interface velocity, V n (result from
the previous time step), the interface points are transported to a new position, calculated explicitly through the equation
V n= (dx
f/dt).n, where n is normal unitary vector;
2. density and specii c heat are calculated at the new interface position;
3. V n+1is estimated via Newton iterations, using a numerical
relaxation schedule, Eq. 13;
4. heat l ux q crossing the interface is calculated through Eqs. 3 or 4, depending on the interface, and distributed into the i xed grid through Eq. 11;
5. according to the boundary conditions, energy equation, Eq. 1, is used to obtain the temperature at time step n +1;
6. temperature is interpolated to i nd TF at the interface, using Eq. 12;
7. the temperature jump condition is tested and if it is lower than the reached tolerance, the i elds of viscosity and conductivity are updated for the new position, and one step in time is advanced. If that is not the case, a new estimate for V n+1 is calculated and the process returns to step 5.
h e convergence criterion used in step 7 is the residual in Eq. 5. Once it has reached the desired tolerance, convergence for interface velocity is assumed. Otherwise, the velocity is corrected via Newton Iterations, given as:
V n+1
= V n - ω.R(T) (13)
where ω is a relaxation factor and R(T) is the residual for the temperature jump condition at the interface. Iterations are repeated until R(T) in every point become smaller than the prescribed tolerance. The optimum value for ω is found by numerical experimentation, at the beginning of the calculation. h e method was compared with the analytical solution for a simple phase change problem resulting in an excellent agreement (Ruperti Jr., 1991).
In the case of more than one interface, an Indicator Function,
Im, is created for each interface, in order to characterize every region concerned to the interfaces individually. h erefore, in a region m (that corresponds to a specii c phase or material), a generic property is estimated as:
(14)
where NFC is the number of interfaces. h e Lagrangean grids for all interfaces have the same values for the parameters h
and d, shown in Fig. 1, and are constructed from a particular parametric curve Rm(u). Igi is the Global Indicator Function for a region m, obtained from the Indicator Function of each interface (calculated as described before). It is given as:
(15a)
(15b)
If there are more than one moving interface, the source term Qm
for every interface has to be extracted from a modii ed form of Eq. 2:
(16)
Actually, according to the numerical method, Eq. 11 will be used to calculate the source term in every interface. h e total amount of heat generated will be the summation of the heat sources of all interfaces:
(17)
h e convergence criterion and velocity correction are the same as those for the case of one interface, but they are extended to all interfaces at each time step.
RESULTS
h e results were obtained for the region near the stagnation point of VSB-30, Fig. 8, which corresponds to a circular semi-sphere with radius of 280 mm. Note that the Y-coordinate has a dif erent meaning of y-coordinate shown in Fig. 3 (y). Since the l ight is considered with zero angle of attack, the problem is considered to be axy-symmetric, and only the half of that region has to be simulated. A 20x20 points grid over a domain of 12x12 mm was employed to simulate the heat transfer and moving boundary problem, with a tolerance of 10-6 for the
residual in Eq. 5. A resulting 26 points Lagrangean mesh was obtained for the interface used to represent the external surface.
o
he more points are added to the mesh the more the thickness reduces. When the number of points reaches 20x20, the interface representation is assumed to be satisfactory, since the rise of the processing time would not compensate the correspondent reduction of interface thickness.
Figure 10 shows the inal interface position according with the number of mesh points used, where the results for 15x15 and 20x20 meshes are very close. In Fig. 11, the variation of external temperature with time at the stagnation point shows an even better convergence between these two meshes. Considering these results, the 20x20 mesh was considered reined enough for the purposes of this study.
he results were compared with those from the one-front model (Machado, 2008), using the same numerical parameters. Due to the diference between the models, the composite material (Si-phenoic resin) was characterized in a diferent way. he properties of resin employed in each model are shown in Table 1.
Figure 12 shows the characterization of every region in the domain through the global indicator function, at t = 0. In this case, the two interfaces corresponding to the pyrolisis and carbonization fronts are placed at the same initial position, over the external surface, since the ablative process did not start yet. he colored region corresponds to the interfaces and do not represent exactly the discontinuity, presenting a slope and a inite thickness (about 0.6 mm). his thickness could be reduced through the increase of the number of grid points, which was not considered necessary, according to the convergence analysis.
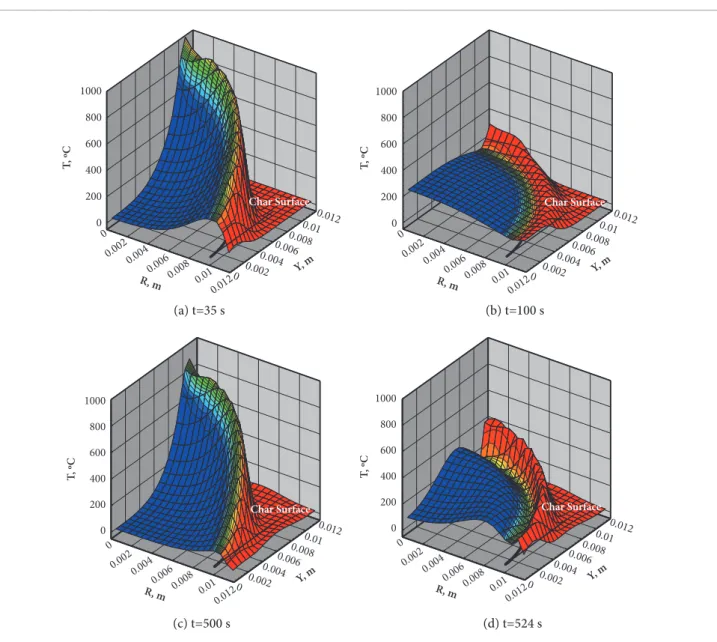
Figure 13 shows the 3-D view of temperature distribution at various moments. Temperature peaks occur in the external surface, in direct contact with the heated air, during the ascension,
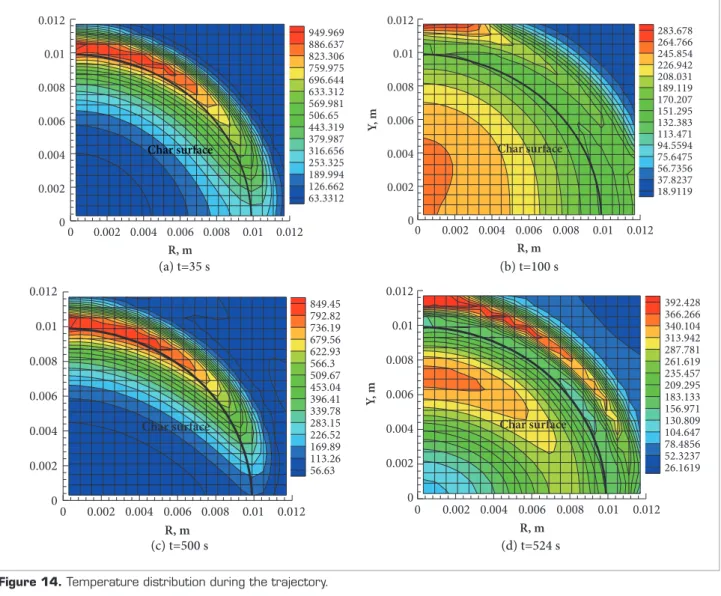
at 35 seconds (Fig. 13a) and at 500 seconds during the reentry (Fig. 13c). Between these times, at 100 seconds (Fig. 13b) and ater the reentry heating, at 524 seconds (Fig. 13d), a surface cooling occurs. In this case, the external surface becomes a heat sink and yields a “valley” in the temperature proile. One can observe that the temperature of fusion of the char is not reached. Indeed, this surface does not move, since there is no phase change and only the pyrolysis front moves when the pyrolisis temperature of the resin is reached. he region correspondent to the air does not present relevant temperature changes, once it is considered to be adiabatic with zero thermal capacity. Temperature distribution and the external surface position correspondent to these proiles are shown in Fig. 14.
he results were compared to those obtained through the one layer model, where ablation is treated as single-phase change process. Figure 15 shows temperature of internal and external surfaces, both at R=0, along the symmetry axis (at Y=10 mm and Y=0, respectively), what corresponds to the stagnation point line. he two temperature peaks correspond to the ascension and reentry of the vehicle in the atmosphere, including a period between then where a cooling occurs, due the heat losses by radiation, in the absence of convection (H=0, according to Fig. 4). It is noticeable that the ablative process begins when the external surface reaches the pyrolisis temperature, and the ablation front starts to move. he temperature of fusion of the char is not reached at both peaks, even in the points of maximum temperature. For the one layer model, the temperature of ablation is lower, what means the process begins earlier and takes more time. Due the presence of the char layer in the two-fronts model, the temperatures reached in the internal surfaces are lower, what
Y 12 mm
12 mm R
rTPS = 10 mm Nose top
Stagnation point
R
Y
Figure 8. Domain of calculation, regions (TPS in blue) and dimensions.
0 0.5
Indicator Function
1
5x5
x = 0,y=0
20x 20
15x15 10x10
0.01 0.009 0.008 0.007 0.006 0.005 0.004 0.003 0.002 0.001 0
0 0.0025 0.005
Initial position Final position 20x20 15x15 10x10 5x5
0.0075 0.01
Y
,m
R.m
Figure 10. Interface position for the virgin material at the inal time, for diverse number of points used in the regular mesh.
0 100 200 300 400 500
0 100 200 300 400 500 600
T, ºC
Time, s
700
20x20 15x15 10x10 5x5
Figure 11. External surface temperature with time, for diverse number of points used in the regular mesh.
Table 1. Properties of Si-phenolic resin.
Property One-front model Two-front model
Virgin material Char
hermal conductivity (W/m°C) 0.485(1) 0.485(1) 0.428(2)
Speciic heat, Cp (J/kg °C) 1,256(1) 1,256(1) 879.5(2)
Speciic mass, ρ (kg/m3) 1,730(1) 1,730(1) 1,300(2)
Emissivity, ε 0.8(1) 0.8(1) 0.8(3)
Heat of ablation (MJ/kg) 12(4) – –
Temperature of ablation (°C) 538(4) – –
Heat of pyrolisis (MJ/kg) – 0.78(5) –
Temperature of pyrolisis (°C) – 599 (5) –
Heat of fusion/Sublimation (MJ/kg) – – 10.5(3)
Temperature of fusion (°C) – – 3,700(3)
(1)Da Costa et al. (1996); (4)Gregori et al. (2008); (5)Tick et al. (1965); (2)Williams and Curry (1992); (3)Savvatimskii (2003).
0 0.002 0.004 0.006 0.008 0.01 0.012 1 0.9 0.8 0.7 0.6 0.5 0.4 0.3 0.2 0.1 0
0 0.002 0.004 0.006 0.008 0.01 0.0
R, m
R, m
1
0.8
0.6
0.4
0.2
0 0
0
0.005
0.005
0.01 0.01
Y, m
Indicator Function – I
Y, m
12
o
indicates that this layer works as a thermal barrier for the virgin material of the TPS.
Figure 16 shows the interface position with the time, ater the two ablation periods (ascension and reentry). According to the results, the ablation is more intense closer the stagnation point for both models. However, the two-fronts model indicates a lower material consumption than the one layer model. he initial position of the external surface keeps constant in the two-fronts model, since the temperature of fusion/sublimation of the char is not reached. he displacement starts ater the formation of the pyrolisis front (considered to be initially at 0.1 mm ater the external surface, for calculation purposes).
CONCLUSION
In this work, the two-dimensional transient aerodynamic heating and ablation processes in the vicinity of the stagnation point of the VSB-30 sounding rocket TPS were simulated through an interface tracking method considering the presence of two moving fronts, the pyrolisis and the carbonization fronts, and two resulting layers, the virgin material and the char layer. Preliminary results demonstrated that the method is able to capture the temperature peaks and to represent the ablation process as a moving boundary problem, in the presence of more
Char Surface
1000
800
600
400
200
0
T
, º
C
0.002 0
0.004 0.006
0.008 0.01 Y, m
0.012
0.012 0.01 0.008 0.006 0.004 0.002
R, m 0
Char Surface
T
, ºC
0.002 0
0.004 0.006
0.008 0.01 Y, m
0.012
0.012 0.01 0.008 0.006 0.004 0.002
R, m 0
1000
800
600
400
200
0
Char Surface
T
, ºC
0.002 0
0.004 0.006
0.008 0.01 Y, m
0.012
0.012 0.01 0.008 0.006 0.004 0.002
R, m 0
1000
800
600
400
200
0
Char Surface
T
, ºC
0.002 0
0.004 0.006
0.008 0.01 Y, m
0.012
0.012 0.01 0.008 0.006 0.004 0.002
R, m 0
1000
800
600
400
200
0
Figure 13. 3-D view of temperature ield during the trajectory, with the Global Indicator Function for every region: Thermal Protection System in blue and air in red.
(a) t=35 s
(c) t=500 s
(b) t=100 s
(a) t=35 s
(c) t=500 s
(b) t=100 s
(d) t=524 s
Figure 14. Temperature distribution during the trajectory. 0 0.002 0.004 0.006 0.008 0.01 0.012 0.012 0.01 0.008 0.006 0.004 0.002 0 R, m 949.969 886.637 823.306 759.975 696.644 633.312 569.981 506.65 443.319 379.987 316.656 253.325 189.994 126.662 63.3312 Char surface 0.012 0.01 0.008 0.006 0.004 0.002 0 Y , m
0 0.002 0.004 0.006 0.008 0.01 0.012
R, m 283.678 264.766 245.854 226.942 208.031 189.119 170.207 151.295 132.383 113.471 94.5594 75.6475 56.7356 37.8237 18.9119 Char surface
0 0.002 0.004 0.006 0.008 0.01 0.012
R, m 0.012 0.01 0.008 0.006 0.004 0.002 0 849.45 792.82 736.19 679.56 622.93 566.3 509.67 453.04 396.41 339.78 283.15 226.52 169.89 113.26 56.63 Char surface
0 0.002 0.004 0.006 0.008 0.01 0.012
R, m 0.012 0.01 0.008 0.006 0.004 0.002 0 Y , m 392.428 366.266 340.104 313.942 287.781 261.619 235.457 209.295 183.133 156.971 130.809 104.647 78.4856 52.3237 26.1619 Char surface
0.012 0.011 0.01 0.009 0.008 0.007 0.006 0.005 0.004 0.003 0.002 0.001 0 0.012 0.01 0.008 0.006 0.004
Two-front model, t = 200 s
Two-front model, t = 524 s
One-front model, t = 200 s
One-front model, t = 524 s
0.002 0
Y
, m
R, m
Initial profile at t = 0
Figure 16. Comparison between the results of the ablation models for interface position with time.
1100 1000 900 800 700 600 500 400 300 200 100 0
0 50 100 150
External suface temperature
Internal suface temperature
One-front model Two-front model
200 250 300 350 400 450 500
T
, ºC
Time, s
One-front model
Two-front model – Inteface char-Si-Phenolic
Two-front model – Char layer
o
than a single moving front, which allows representing diverse physical simultaneous processes.
When compared with the one-front model, it results in lower temperatures out of the periods of heating, shorter periods of ablation and less consumption of protective material. his analysis can be extended to more regions of the rocket, more layers and other shapes, including more moving fronts, if it is necessary. A more realistic physical model for the ablation in the composite material may now replace the one used in this work. he inclusion of the low ield efects, like injection of mass due to sublimation, shall also be incorporated into the simulation. Since the two-fronts model has presented better accuracy than the one-front model, as shown in previous studies
already mentioned, it seems to be a better option to estimate TPS performance for other vehicles and might provide a more accurate dimensioning and consequently reducing its weight and cost.
ACKNOWLEDGMENTS
he author would like to thank the Conselho Nacional de Desenvolvimento Cientíico e Tecnológico (CNPq), the Brazilian Federal Agency for Science and Technology, for the inancial support during this work.
REFERENCES
Anderson Jr., J.D., 1989, “Hypersonic and High Temperature Gas Dynamics”, McGraw-Hill, Blacklick, Ohio, USA.
Da Costa, L.E.V.L., De Mello, F.C. and Pardini, L.C., 1996, “Viability Study of Thermal Protection for SARA Platform”, IAE/CTA, Technical note NT-130-ASE-N/96, IAE/CTA, São José dos Campos, São Paulo, Brazil (in Portuguese).
Garcia, A., Yamanaka, S.S.C., Barbosa, A.N., Bizarria, F.C.P., Jung, W. and Sheuerplug, F, 2011, “VSB-30 Sounding Rocket: History of Flight Performance”, Journal of Aerospace Technology and Management, Vol. 3, No.3, pp. 325-330. doi: 10.5028/JATM.2011.03032211
Gregori, M.L., Barros, E. de A., Petraconi Filho, G., Costa, S.F. and Pardini, L.C., 2008, “Properties of Quartz-Phenolic Composites for Thermal Protection Systems”, 59th IAC Congress, Glascow, Scotland.
Juric, D., 1996, “Computations of Phase Change,” Ph.D. thesis, University of Michigan, Michigan, 166 p.
Machado, H.A. and Pessoa-Filho, J.B., 2007 , “Aerodynamic Heating on VSB-30”, ESA Symposium, Visby, Sweden.
Machado, H.A., 2008, “Two-dimensional Simulation of Ablation due to Aerodynamic Heating in a Sounding Rocket”, 40th AIAA Thermophysics
Conference, Seattle, USA.
Machado, H.A., 2012a, “Simulation of Ablation in a Composite Thermal Protection System via an Interface Tracking Method”, Journal of Aerospace Technology and Management, Vol. 4, No. 3, pp. 331-340. doi: 10.5028/jatm.2012.04030312
Machado, H.A., 2012b, “After-Flight Thermal Analysis of the VSB-30 Sounding Rocket Payload”, VII National Congress of Mechanical Engineering – CONEM, São Luís, Maranhão, Brazil (in Portuguese).
Miranda, I.F. and Mayall, M.C de M., 2001, “Fluxo de Calor Convectivo em Micro-Satélites em Reentrada atmosférica”, Graduate Dissertation, Instituto Tecnológico de Aeronáutica, São José dos Campos, São Paulo, Brazil, 66 p.
Patankar, S.V., 1980, “Numerical Heat Transfer and Fluid Flow”, Taylor & Francis, New Delhi.
Ruperti Jr., N.J., 1991, “Solution of a One-Dimensional Ablation Model”, Master thesis, Instituto Nacional de Pesquisas Espaciais, São José dos Campos, São Paulo, Brazil (in Portuguese).
Savvatimskii, A.V., 2003, “Melting Point of Graphite and Liquid Carbon”, Physics-Uspekhi, Vol. 46, No. 12, pp. 1295-1303. doi:10.1070/ PU2003v046n12ABEH001699
Sias, D.F., 2009, “Hibrid Solutions for Heat Transfer on Ablative Thermal Protection Systems”, Master thesis, Universidade Federal do Rio de Janeiro, Rio de Janeiro, Brazil (in Portuguese).
Tick, S.J., Huson, G.R. and Griese, R., 1965, “Design of Ablative Thrust Chambers and Their Materials”, Journal of Spacecraft and Rocket, Vol. 2, No. 3, pp. 325-331. doi: 10.2514/3.28179
Turner, J., Hörschgen, M., Turner, P., Ettl, J., Jung, W. and Stamminger, A., 2005, “SHEFEX – The Vehicle and Sb-Systems for a Hypersonic Re-entry Flight Experiment”, 17th ESA Symposium in
European Rocket and Balloon Programmes and Related Research, Sandfjord, Norway.
U.S. Standard Atmosphere, Washington, D.C., U.S. Government Printing Ofice, 1976.
Unverdi, S.O. and Tryggvason, G., 1992, “A Front-Tracking Method for Viscous, Incompressible, Multi-luid Flows”, Journal of Computational Physics, Vol. 100, No. 1, pp. 25-37.
Williams, S.D. and Curry, D.M., 1992, “Thermal Protection Materials – Thermophysical Property Data”, NASA Reference Publication 1289.