*e-mail: [email protected]
LDPE/PHB Blends Filled with Castor Oil Pressed Cake
Gustavo A. D. Burlein, Marisa C. G. Rocha*
Instituto Politécnico, Universidade do Estado do Rio de Janeiro – UERJ, CP 97282, CEP 28601-970, Nova Friburgo, RJ, Brasil
Received: February 19, 2013; Revised: September 2, 2013
Blends of PHB and LDPE were prepared by melt mixing in a twin screw extruder. Castor oil pressed cake (CC) was used as iller for the blends. The mixture design technique was used to evaluate the effect of the components proportion on the materials lexural properties. The results show that superior LDPE lexural properties may be obtained by the addition of PHB or castor oil cake to LDPE. Biodegradation was evaluated burying the samples in simulated soil for different periods of time. The ternary mixtures with higher content of PHB showed more pronounced degradation. Under the experimental conditions studied the LDPE/CC compositions presented no degradation. However, the loss of mass of the LDPE/PHB/CC ternary mixtures was higher than the loss of mass of the corresponding LDPE/PHB binary mixture. This result suggests that the castor oil cake accelerates the degradation of the LDPE/PHB mixtures.
Keywords: low density polyethylene, castor oil pressed cake, poly (3-hydroxybutyrate) flexural properties, mixture design of experiments, biodegradation
1. Introduction
Nowadays, polymers have been used in a wide range of applications that includes since the development of complex materials, such as prosthetic hips and knee joints up to the development of disposable ones, such as food wrappings. This fact reflects their significance and importance in our daily life. However, the most used polymers are not easily degraded by microorganisms and present very low degradation rates. As a result, their accumulation in the environment has become a serious problem. As the polymer usage is unavoidable, ways have to be found to develop materials which can re-enter in the biological life cycle through biodegradation1-3.
Until recently, biodegradation was perceived as a natural process that occurs solely by the action of microorganisms leading to the recycling of carbon, the mineralization of organic compounds and the generation of new biomass. At present, according to some researchers2,3, when the
complexity of biodegradation of polymeric materials is better understood, this process is deined considering that it results from combination of biotic and abiotic factors which act synergistically to decompose organic matter. Besides, the process can stop at each stage. Actually, it seems to have confusion in the deinition of biodegradation, biofragmentation and biodeterioration2,3.
According to Lucas et al.2, biodegradation is considered
to take place throughout three stages: biodeterioration, biofragmentation and assimilation, without neglect the participation of abiotic factors.
The biodeterioration is mainly the result of the activity of microorganisms, growing on the surface or, and inside a given material. It is important to emphasize that
microorganisms may act by mechanical, chemical, and enzymatic means. The biodeterioration of thermoplastic polymers may proceed by two different mechanisms, named bulk and surface erosion. In the bulk erosion, the polymer mass is fragmented into small fractions, and the molecular weight is reduced. In the case of surface erosion, there are no changes of the polymer molecular weight, but there is loss of matter2.
Biofragmentation involves the cleavage of the long polymer chains due to the mixed action of abiotic factors and microbial communities, which secretes enzimes or generates free radicals. A polymer is considered as fragmented, when low molecular weight molecules are found within the media. After being transported into the cytoplasm, the small molecules integrate the metabolism pathways. This step is called assimilation and is essential to produce microbial energy, biomass and metabolites. As mineralization takes place, CO2, N2, CH4, H2O and different salts from completely oxidized metabolites are released in the extracellular environment. Assimilation allows microorganisms to growth and to reproduce while consuming substrate from the environment2,3.
Low density polyethylene (LDPE) is one of the most used thermoplastic materials due to its good properties, such as high lexibility, good processability, excellent resistance to dilute and concentrated acids, alcohols, bases and esters, impact resistance and dimensional stability4. Nevertheless,
Since most enzyme-catalyzed reactions occur in aqueous media, the hydrophilic-hydrophobic character of synthetic polymers greatly affects their biodegradability. A polymer containing both hydrophobic and hydrophilic segments seems to have a higher biodegradability than those polymers containing either hydrophobic or hydrophilic structures only. Nowadays, it has been considered that even the hydrophobic nature of polyethylene is not a hindrance during biodegradation, since fungi due to their ability to form hydrophobic proteins, can easily attach to the polymer surface3,6.
The high molecular weight of polyethylene, however, represents a serious problem, as a molecule of this size cannot cross a cell wall and a cytoplasmatic membrane of the microbial cells. Therefore, it is necessary to reduce its molecular weight by some pretreatments, such as: photo-oxidation, thermo-oxidation and chemical oxidation. The sensitivity of polyoleins towards thermal oxidation is largely due to the presence of impurities, hydroperoxydes and carbonyl groups2,3.
According to Bassi et al.7, study on biodegradation of
polyethylene has indicated that the molecular weight of biodegradable polyoleins must be less than 500. Therefore, the principle of making biodegradable polyoleins involves adding special additives to the synthetic polyoleins so that the modiied structures are susceptible to photo-degradation and chemical degradation. As a result, the long carbon chains are broken to shorter segments and their molecular weights are reduced below 500. Microorganisms can then assimilate the polyolefins monomeric and oligomeric breakdown products previously derived from photo and chemical degradations.
Abiotic factors also seem to accelerate the biodegradation behavior of polyethylene. Results obtained by Negi et al.8
have indicated that environmental factors like sun-light, temperature and rainfall may enhance the rate of biodegradation of the polymer in nature.
Another of the possible ways to accelerate biodegradation rate of polyethylene in the environment is copolymerization, blending or grafting with functional polymers and compounds. It has been reported that the addition of additives having hydrophilic groups makes polyolefin less hydrophobic and susceptible to photo-, chemical and microbial degradation. The microbial assimilation of the iller, serving as initial point of microbial attack, results in the increase of the surface area of the synthetic material rendering it more susceptible not only to biotic but also to abiotic oxidation. .Biodegradable polymers, such as starch and poly (3-hydroxybutirate) (PHB) also have been used as degradable illers in polyethylene based materials2,3,9.
Selection and isolation of a strain (or a consortium) that produce high levels of oxidative enzymes; .increase induction of oxidative enzymes; and increase of cell surface hydrophobicity by the use of non-ionic surfactants that will enhance bioilm formation are other ways that have been pointed out to enhance the biodegradability of the most common polymers such as polyethylene, polypropylene and polystyrene10.
Poly (3-hydroxybutirate) (PHB) is natural polyester produced by several microorganisms. In the last
decades PHB has attracted much interest in medical and agricultural applications owing to its biocompatibility and biodegradability. Blending conventional polyoleins with PHB can be a considerable alternative to minimize the disposal problem in landills and improve the instrinsic britlleness that restricts PHB applications6,11,12. According
to Felisberti et al.13, PHB blends may be considered
biodegradable or partially biodegradable on basis of the biodegradation behavior of the combined polymer. A review on blends of poly (3- hydroxi-alkanoate) s (PHAs) has been published in the literature14. An important
conclusion drawn from this review is that blends of PHAs with other biodegradable polymers usually show improved biodegradability when compared with pure PHAs[14].
The blending of biodegradable polymers, such as starch and bioinert polymers, has received a considerable attention for possible applications in the waste disposal of plastics6,9,15-19. In the case of PHB based blends containing
a bioinert polymer, a kind of biodeterioration may occur according to the morphology and surface properties of the samples. As a matter of fact, the microorganisms attack to the PHB part of the whole samples and provoke a disintegration of the samples by subtracting cementing material between separate synthetic regions6. However, it
is worthy to mention that for some researchers, the total assimilation of the fragmentary products by the ecosystem is required if the polymers are to be acceptable from the ecological point of view9,20.
Several studies concerning the properties of LDPE/PHB blends have been performed and described in the literature12,21-35. There is evidence that LDPE/PHB
blends are immiscible and form morphological structures with well distinguished phase boundaries between dispersed phase and matrix12,21-26,32. According to Pankova et al.26, the
morphological features of these blends demonstrate the self-reinforced matrix where the minor component (PHB) forms the band-like ibrils embedded in the LDPE matrix. At the amount of PHB above 16%, the blend system undergoes the morphology transfer from the oriented PHB structure to the isotropic one where the PHB ibrils transform into a network. The distinction between the two morphologies relects the different values of water permeability through the blend ilms. Therefore, the concentration of PHB in the blends permits to regulate their special morphology and consequently, the water barrier properties26,29,34.
There are few studies about compatibilization of these blends. Poly (ethylene-co-glycidil methacrylate) (EGMA) seems to promote a satisfactory dispersion and a good interfacial adhesion between LDPE and PHB21.
As a general trend, addition of PHB to LDPE leads to obtaining a hard and brittle material due to the poor interfacial adhesion between the two polymers24,30. Young
Modulus (YM) of LDPE/PHB blends depends on the continuous phase and on the amount of compatibilizer in the blend. Generally, blends where LDPE is the continuous phase, show YM values near to that presented by the pure LDPE21. Addition of a pro-oxidant, such as oxidized
A study31 published in the literature shows that
LDPE/PHB blends present two stages of oxidation. In the irst one, the thermal oxidation of LDPE is determined by the structure of the LDPE continuous phase that is modiied by the addition of PHB. In the second stage, the auto-oxidation of LDPE is enhanced by low molecular weight products of PHB and the rate of this process is directly proportional to the PHB content in the blends.
Some studies on LDPE/PHB blends describe the use of additives that accelerate photo- and thermo-oxidation of polyethylene rendering the product more susceptible to biodegradation7,12,21-23. The reason behind this approach is
that photo and thermal-oxidation increase the amount of low molecular weight material by breaking bonds, increasing the surface area through embrittlement and increasing the hydrophilicity by introduction of carbonyl groups. All these effects render polyethylene more susceptible to biodegradation. It has also been observed that the oxidation products of polyoleins are biodegradable. This is the basis for the so-called oxobiodegradable polyoleins21.
A study23 on the biodegradation of LDPE/PHB blends
under simulated burial soil conditions, using aluminum stearate and vegetal oil as additives showed that the samples without additives presented some changes in their surface, such as roughness and whitening. These white spots have become greater as the concentration of PHB in the blends was increased. The samples with additives present dark spots on their surfaces. Apparently, these additives acted as plasticizers for the blends and have not improved their biodegradation behavior. However the monitoring time of biodegradation was not enough to obtain conclusive results.
Rosa et al.12 prepared PHB/LDPE blends with and
without oxidized polyethylene wax (OPW, 5wt %). Their results indicated that pure LDPE and both 25/75 PHB/LDPE and 50/50 PHB/LDPE blends showed little or no loss of mass. Their results also demonstrated that the addition of OPW increased the tensile strength and the elastic modulus, compared to the blends without OPW, but decreased the elongation at break of the blends. The photographs of the samples obtained by light microscopy itted with a high resolution camera showed that the incorporation of OPW made the samples more susceptible to attack by microorganisms. Morphological analysis of PHB conirmed that fungi colonized the surface of the polymers and that the initial phase of biodegradation involved the formation of small holes on the surface of the ilm. In addition, the color of the polymer changed from yellow to green with increasing age, and eventually to black prior to fragmentation.
Thermogravimetric data of LDPE/PHB blends prepared with a pro-oxidant (T6) and soil buried for 180 days obtained by Martelli et al.22 showed that both onset and maximum
rate degradation temperatures decreased as a function of biodegradation time. The differential scanning calorimetry (DSC) data showed that LDPE crystallinity degree values increased in general up to 2 months of biodegradation. At the end of the soil burial (SB) test, these values decreased principally for samples that were previously thermo-oxidized in an oven.
According to Martelli21, the most important inding of
her study on LDPE/PHB blends prepared with pro-oxidants
based on transition metals was that these ilms reach an advanced state of embrittlement after 45 days aging. This behavior is solely achieved with pro-oxidants addition.
Chemical modiication of the LDPE and LDPE/PHB ilms by using ultraviolet radiation is another approach used to improve the biodegradation behavior of the materials. This radiation promotes the generation of carbonyl groups that increases the hydrophilic character of the materials, rendering them more susceptible to attack by microorganisms28.
A growing interest has been observed in the possibility of improving polyoleins biodegradation by utilization of natural illers. This approach has been considered a way to getting cheaper polymers with optimized properties.
Lukanina et al.27 evaluated the properties of LDPE
based ilms containing biodegradable components, such as: cellulose, soy lour, grains (brewery wastes) and PHB. An increase of Young Modulus was observed for all samples, especially when 15wt% or higher concentration of PHB was added to LDPE. Nevertheless, the tensile stress at break of the ilms decreased with the addition of the natural illers. This result was attributed to the increased concentration of breakdown sites under high stretching degree. The addition of PHB, however, promoted the increase of tensile stress up to 10 wt% of PHB addition and an increase of the tensile at break stress. The biodegradation behavior of the samples was studied by using two fungus cultures: Penicillum crysogenium and Aspergillus flavus link Fr. Their results indicated that the quickest biomass accumulation on PHB was reached by using Aspergillus flavus link Fr culture and that the introduction of any natural iller to LDPE accelerates the biomass accumulation. Their results also indicated that the biodegradability of PHB decreases when it is added to LDPE. This result was attributed to the minor accessibility for fungi of PHB when it is blended with LDPE.
Castor bean (Ricinus communis L.) also known as castor oil bean is of great economic importance due to the oil extracted from its seeds. Castor oil has been used in various applications, such as raw materials for chemicals, cosmetics, lubricants and in biodiesel production36,37.
The oil extraction process for producing biodiesel and lubricant generates the castor bean cake as a residue, which is highly concentrated in proteins. Therefore, the valorization of this co- product should contribute to improve the productive chain of biodiesel36,37
.
The effect of the addition of a pressed castor oil cake, a biodiesel co-product, on the mechanical properties of a grade of LDPE used in the packaging industry was recently evaluated. It was veriied that the addition of this iller to the LDPE matrix improves the lexural properties of this polymer38.
Patent application iled by a Brazilian oil industry and published recently requires the privilege of obtaining composite materials with enhanced degradability using castor oil cake as iller39. The description of this invention
is not available yet.
In a previous work24, blends of LDPE and PHB were
mixtures of LDPE lie in the range from 8.9 to 10 MPa. As some commercial grades of LDPE have mechanical strength in this range, it was inferred that the addition of a certain amount of PHB or CC to LDPE could be considered as a possibility for obtaining LDPE based materials with increased susceptibility to biodegradation.
There is a lack in literature regarding the properties of LDPE/PHB blends illed with castor oil cake. In the present work, a mixture design technique of experiments was applied in order to evaluate the effect of LDPE/PHB/ CC mixtures composition on the lexural properties. A preliminary study of the biodegradation behavior of the mixtures under simulated soil was also performed.
2. Experimental Procedure
2.1.
Material
Low density polyethylene (LDPE, TS 0728), MFI = 2. 20 g/10 min - ASTM D 1238[40], at 190 °C was donated by
Petroquímica Triunfo (Brazil) and used as received. Poly (3-hydroxybutyrate) (PHB), MFI= 16 g/10 min- ASTM D 1238, at 190 °C was obtained from PHB Industrial and used as received. The castor oil pressed cake (CC) was donated by Embrapa (Brazil). The material was detoxiied by autoclaving.at 120 °C for 30 minutes. After a drying process, the iller was ground in a ball mill and passed through a set of sieves with a decreasing mesh size. Only the powdered material with a size less or equal to 0.25 mm was used in this work. The composition of castor cake is shown in Table 124.
2.2.
Mixture design of experiments
The Minitab 15 software program41 was used for
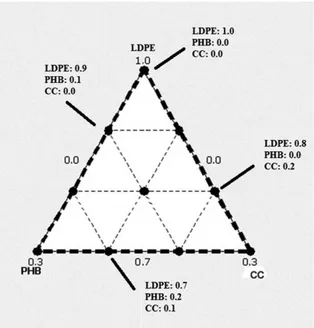
planning the mixturesand it was also used for analyzing themechanical behavior of the samples. Low density polyethylene, poly (3-hydroxy-butyrate) and castor oil pressed cake were represented by the input variables designated as LDPE, PHB and CC, respectively. As it was desirable to consider the largest LDPE content in the ternary system, the components of the mixture were subjected to the following constraints: 0.7 ≤ LDPE ≤ 1.0, 0 ≤ PHB ≤ 0.3 and 0 ≤ CC ≤ 0.3. Figure 1 shows the design region of interest. The circles represent ten LDPE/PHB/CC mixtures that should be prepared to give an appropriate response surface using a polynomial equation of degree n.
The composition of the mixtures deined by the Minitab software is presented in Table 2.
2.3.
Mixtures processing and characterization
The LDPE/PHB/castor cake mixtures were prepared in a twin screw extruder (Extrusão Brasil- Model DRC)with 22 mm diameter and a length to diameter (L/D) ratio equal to 36 at 100 rpm. The temperature profile in the extruder from the feed to the metering zone was set at 80/140/140/140/140°C. Flexural properties were measured using a Shimadzu Universal Testing Machine, Model AG-I with a 5 KN load cell. Tests were conducted in accordance with ASTM D 790[42] using Type V test
specimen dimensions. A crosshead speed of 10 mm/min was employed under atmospheric conditions. The morphology of the samples previously coated with gold was determined by scanning electron microscopy (Zeiss, DSM 960).
2.4.
Simulated soil burial biodegradation
experiment
The simulated soil consisted of 23% loamy silt, 23% organic matter (cow manure), 23% sand and 31% water (all w/w). The soil pH, equal to 7, was determined using the digital pH meter Model PHS-3B PHtek. Five type I specimens prepared according to ASTM D-638[43] were
weighed and buried in simulated soil under atmospheric conditions. Biodegradation behavior was monitored every 30 days for approximately 4 months by measuring the loss of mass. At each interval the buried samples were recovered, washed with water and dried in an oven for 24 hours at 40 °C. After this time the samples were weighted in order to determine the losses of mass.
3. Results and Discussion
The lexural properties of the different mixtures were evaluated through analysis of variance performed by the Minitab software41; some polynomial equations were tested
in order to describe the mechanical behavior of the samples The cubic model in pseudo components (Equation 1) was selected for describe the lexural strength of the samples
Table 1. Chemical composition of the castor oil pressed cake (%).
Dry matter 91.5
Crude protein 42.5
Fibers 20.04
Calcium 0.68
Phosphorus 0.78
because it was the most eficient from a statistical point of view.
σi = b
1X1 + b2X2+b3X3 + b12X1X2+ b13 X1X3 +
b23 X2X3 + b123 X1X2X3 (1)
Where: σi is the lexural strength; b
1, b2, b3, b12, b13
and b23 are the coeficients of the polynomial and X1, X2 and X3 are the entrance variables. In this study X1, X2 and X3 represent the LDPE, PHB and CC proportions in the ternary blends.
However, the linear model in pseudo components (Equation 2) was the most adequate to describe the lexural modulus of the samples.
Ei = b1X1 + b2X2+ b3X3 (2)
Where: Ei is the lexural modulus; b1, b2 and b3, are the coeficients of the polynomial and X1, X2 and X3 are the LDPE, PHB and CC proportions in the ternary blends.
The Equation 1 was used to generate the response surface presented in in this work.
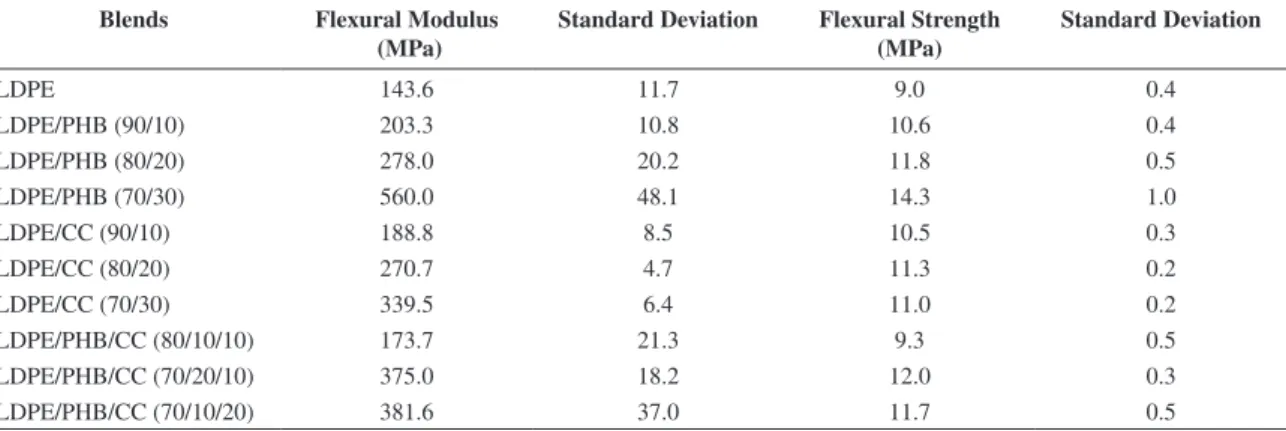
The flexural properties of LDPE and the different mixtures are presented in Table 3
The inspection of Table 3 shows that the flexural strength of LDPE increases as the content of PHB in the LDPE/PHB binary mixture increases. This result may be explained by the lexural strength value of the PHB that should be higher than the lexural strength of the LDPE.
Similar effect was observed when the LDPE/CC binary mixtures were analyzed. The addition of the natural iller to the LDPE provokes an increase of the lexural strength. However, this effect was smaller than that observed when the PHB was added to the LDPE. Similar results were found by Stork and Rocha38 and coworkers. The researchers have
veriied that the addition of castor oil pressed cake to LDPE leads to obtain better lexural properties.
The homogeneous distribution of illers in the polymeric matrix and a satisfactory interfacial adhesion have been pointed as the two main factors that lead to obtain superior mechanical properties. It is difficult to obtain a good dispersion of particulate illers in thermoplastic matrices due to the tendency these illers present to form agglomerates. This fact may explain why a signiicant increase of the lexural strength in higher content of illers was not observed. It is important to note that the increase of lexural strength has been observed in systems with weak adhesion such as HDPE/wood lour composites44.
Table 3 also shows that the lexural strength values of the ternary mixtures were lower than the lexural strength values of the binary mixtures. Perhaps, this result may be explained by the unsatisfactory dispersion of the castor oil cake in the LDPE/PHB blend.
Figure 2 presents the response surface plot of lexural strength versus the components proportion of the LDPE mixtures.
Table 2. Composition of LDPE/PHB/CC mixtures.
Sample Code LDPE PHB CC
% grams % grams % grams
1 90 450 10 50 0 0
2 80 400 0 0 20 100
3 70 350 20 100 10 50
4 80 400 10 50 10 50
5 70 350 30 150 0 0
6 80 400 20 100 0 0
7 100 500 0 0 0 0
8 70 350 10 50 20 100
9 70 350 0 0 30 150
10 90 450 0 0 10 50
Table 3. Flexural Properties of LDPE and LDPE/PHB/CC Blends.
Blends Flexural Modulus (MPa)
Standard Deviation Flexural Strength (MPa)
Standard Deviation
LDPE 143.6 11.7 9.0 0.4
LDPE/PHB (90/10) 203.3 10.8 10.6 0.4
LDPE/PHB (80/20) 278.0 20.2 11.8 0.5
LDPE/PHB (70/30) 560.0 48.1 14.3 1.0
LDPE/CC (90/10) 188.8 8.5 10.5 0.3
LDPE/CC (80/20) 270.7 4.7 11.3 0.2
LDPE/CC (70/30) 339.5 6.4 11.0 0.2
LDPE/PHB/CC (80/10/10) 173.7 21.3 9.3 0.5
LDPE/PHB/CC (70/20/10) 375.0 18.2 12.0 0.3
Figure 2 makes evident that the reinforcing effect of PHB is higher than the reinforcing effect of castor oil pressed cake. This result perhaps may be attributed to the higher tendency of castor oil pressed cake to form agglomerates besides the weak interfacial adhesion. The highest value of lexural strength was obtained when LDPE was processed with 30% w/w of PHB.
The relationship between the lexural strength and the components of the mixtures can be expressed by Equation 3:
σ = 9.1 [LDPE] + 40.2 [PHB] – 10.8 [CC] –20.7 [PEBD]
[PHB] + 38.3 [LDPE] [CC] + 129.3 [PHB][CC] – 1902.2 [LDPE] [PHB][CC]
(3)
Where: σ is the lexural strength (MPa); [LDPE], [PHB]
and [CC] are the proportion of LDPE, PHB and castor oil cake in the mixtures
The Equation 3 shows that the interaction between the three components of the LDPE mixtures provokes a signiicant reduction of the lexural strength values as may be inferred by the high negative coeficient related to the [LDPE] [PHB][CC] term.
Table 3 also shows that the behavior of lexural modulus in function of the composition of the mixtures was similar to that one presented by the lexural strength. Both PHB and CC act as a reinforcing element for the LDPE. However, the reinforcing effect of PHB is higher than the effect of the castor oil cake. The binary mixtures exhibited higher values of lexural modulus than the ternary mixtures.
On a statistical basis, the linear model (Equation 4) is more appropriate than the quadratic and cubic to express the relationship between the flexural modulus and the components of the mixtures. However, nonlinear regression models should be tested once the coeficient of determination found was equal to 0.7.
E = 150 [LDPE] + 539 [PHB] + 353 [CC] (4)
Where: E is the lexural modulus (MPa); [LDPE], [PHB] and [CC] are the proportion of LDPE, PHB and castor oil cake in the mixtures.
The measure of mass loss is frequently used for estimation of biodegradability and is standardized for in situ biodegradability tests. As this methodology has been used in the studies on biodegradation behavior of LDPE/ PHB blends, it is also used in this work. However, it should be emphasized that other methods must be used in order to estimate polymer biodegradation, since the loss of mass can be due to the vanishing of volatile and soluble impurities. In this work, a preliminary study on the biodegradation behavior of the blends was performed by measuring the loss of weight every 30 days for approximately 4 months. Figure 3 shows the percentage of loss of mass of LDPE / PHB binary blends in different intervals of time.
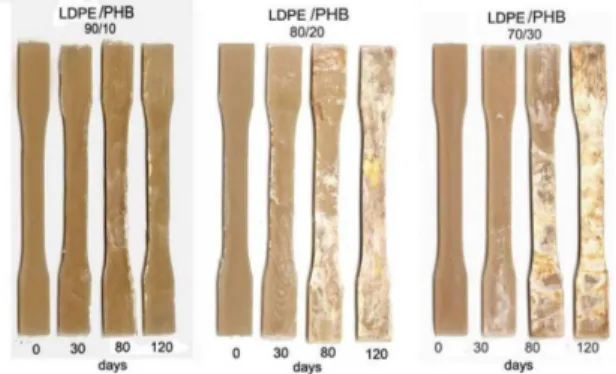
The inspection of Figure 3 shows that as the PHB content in the mixtures is increased, a trend to increase the biodegradation rate of the LDPE/PHB binary samples is observed, as it was expected. This result also may be inferred from the analysis of Figure 4 that shows the visual appearance of the LDPE/PHB specimens after they have been removed from the soil in different intervals of time. The more intensive action of microorganisms becomes more visible by the appearance of spots and the roughness of the specimens.
Figure 2. Response surface plot of lexural strength (MPa).
Figure 3. Percentage of loss of mass of LDPE/PHB binary blends in different intervals of time.
Table 4 show the percentage of loss of mass of LDPE mixtures in different intervals of time.
The loss of mass of the LDPE/CC samples showed .that there was a slight increase of mass over a period of 120 days. In this case, there was also no change in the visual appearance of the samples. Perhaps, this result may be attributed to the greater capacity of moisture absorption of the castor oil cake.
Figure 5 shows the percentage of loss of mass of LDPE/ PHB/CC mixtures in different intervals of time.
The ternary mixture with higher content of PHB presents the highest loss of mass in 120 days. Table 4 shows that the loss of mass of the LDPE/PHB/CC (70/20/10) ternary mixture was higher than the loss of mass of the LDPE/PHB (70/30) mixture. Table 4 also shows that the loss of mass of the LDPE/PHB/CC (80/20/10) ternary mixture was higher than the loss of mass of the LDPE/PHB (80/20) mixture. These results may be an indication that the castor oil pressed cake accelerates the degradation of the LDPE/PHB mixtures.
Figure 6 shows the morphology of the blend of LDPE containing 10% of CC. This micrograph appears quite different from that of blends containing 10% of PHB (Figure 7). The domains of castor pressed cake are quite visible and the fracture process does not seem to be so ductile. The weak interfacial adhesion is noticeable. Voids and cavities may be observed.
The larger domains of CC dispersed in LDPE/PHB blend (Figure 8) may be contributing to a higher stress concentration and cracks propagation. On the other side, the voids between the phases may be contributing to the water permeation that could lead to hydrolysis reactions of PHB.
Figure 9 presents the visual appearance of the LDPE/ PHB/CC specimens after they have been removed from the soil in different intervals of time. It can be seen that the specimens become clearer as they are degraded. White spots that become larger as the concentration of PHB was increased were observed in LDPE/PHB samples removed from the soil23. There was no mention about the source of
the spots. Maybe, the cracks and voids give rise to regions with different refractive index that may be responsible by the observed whitening.
Table 4. Percentage of loss of mass of LDPE mixtures in different intervals of time.
Blends Loss of mass (%)
Standard Deviation
Loss of mass (%)
Standard Deviation
Loss of mass (%)
Standard Deviation
30 days 80 days 120 days
LDPE/PHB (90/10) 0.18 0.06 –0.01 0.15 0.18 0.02
LDPE/PHB (80/20) 0.09 0.03 0.75 0.38 1.30 0.26
LDPE/PHB (70/30) 0.22 0.04 2.23 0.82 2.48 0.70
LDPE/CC(90/10) 0.04 0.07 –0.14 0.06 –0.11 0.26
LDPE/CC (80/20) –0.07 0.04 –0.40 0.05 –0.33 0.10
LDPE/CC (70/30) –0.19 0.01 –0.69 0.16 –0.56 0.20
LDPE/PHB/CC (80/10/10) 0.17 0.07 –0.13 0.18 0.25 0.13
LDPE/PHB/CC (70/20/10) –0.39 0.05 4.25 0.92 7.95 2.33
LDPE/PHB/CC (70/10/20) –0.31 0.06 0.81 0.47 3.05 0.55
Figure 5. Percentage of loss of mass of LDPE/PHB/CC mixtures in different intervals of time.
4. Conclusions
1. Superior LDPE lexural properties may be obtained by the addition of PHB or castor oil cake to LDPE. The effect of PHB addition to LDPE is greater than the effect produced by the addition of castor oil cake (CC). The LDPE binary mixtures presented better properties than the LDPE ternary mixtures; 2. The addition of increasing concentration of PHB
enhances the biodegradation of the LDPE/PHB binary mixtures. However, the loss of mass data of the LDPE/CC samples showed .that there was a slight increase of mass over a period of 120 days; 3. The loss of mass of the LDPE/PHB/CC ternary
mixtures was higher than the loss of mass of the corresponding LDPE/PHB binary mixture. This result may be an indication that the castor oil pressed cake accelerates the degradation of the LDPE/PHB mixtures.
Acknowledgments
The authors want to thank Braskem, Embrapa and PHB Industrial for raw materials supplying and CNPq for supporting this research.
Figure 7. SEM micrographs of fractured surfaces of 90/10 LDPE/ PHB mixture.
Figure 9. Visual appearance of LDPE/PHB/CC specimens after removal from the soil in different time intervals.
Figure 8. SEM micrographs of fractured surfaces of 80/10LDPE/ PHB/10 CC mixture at low and high magniication.
References
1. Arutchelvi J, Sudhakar M, Arkatkar A, Doble M, Bhaduri S and Uppara PV. Biodegradation of polyethylene and polypropylene. Indian Journal of Biotechnology. 2008; 7:9-22.
2. Lucas N, Bienaime C, Belloy C, Queneudec M, Silvestre F and Nava-Saucedo J-M. Polymer biodegradation: Mechanisms and estimation techniques. Chemosphere. 2008; 429-442. http:// dx.doi.org/10.1016/j.chemosphere.2008.06.064
3. Nowak B, Pajak J and Karcz J. Biodegradation of Pre-Aged Modiied Polyethylene Films. In: Scanning Electron Microscopy 32: Structure and properties of biodegradable polymer composites material. Vlascheslaw Kazmiruk; 2012. p. 643-670. Available from: <http://www.intechopem.com./ books/scanning-electron-microscopy/biodegradation/of-pre-aged-modiied-polyethylene-ilms>. Access in: 20/07/2013. 4. C o u t i n h o F M B , M e l l o I L a n d S a n t a M a r i a L C .
Polietileno: Principais tipos, propriedades e aplicações.
Polímeros. 2003; 13(1):1-13. http://dx.doi.org/10.1590/S0104-14282003000100005
5. Hamad K, Kaseem M and Deri F. Melt rheology of poli (lactic acid)/low density polyethylene polymer blends. Advances in Chemical Engineering and Science. 2011; 1:208-214. http:// dx.doi.org/10.4236/aces.2011.14030
6. Chandra R and Rustgi R. Biodegradable Polymers. Progress in Polymer Science. 1998; 23:1273-1335. http://dx.doi. org/10.1016/S0079-6700(97)00039-7
7. Z h e n g Y , Y a n f u l E K a n d B a s s i A S . A r e v i e w on plastic waste biodegradation. Critical Reviews in Biotechnology. 2 0 0 5 ; 2 5 : 2 4 3 - 2 5 0 . h t t p : / / d x . d o i . org/10.1080/07388550500346359
9. Arvanitotannis I, Biliaderis CG, Ogawa H and Kawasaki N. Biodegradable ilms made from low-density polyethylene (LDPE), rice starch and potato starch for food packaging applications: Part I. Carbohydrate Polymers. 1998; 36:89-104. http://dx.doi.org/10.1016/S0144-8617(98)00016-2
10. Sivan A. New perspectives on plastics biodegradation. Current Opinion inBiotechnology. 2011; 22:422-426. http://dx.doi. org/10.1016/j.copbio.2011.01.013
11. Sadi RK, Kurusu RS, Fechine GJM and Demarquette NR. Compatibilization of polypropylene/poly (3-hydroxybutyrate) blends. Journal of Applied Polymer Science. 2012; 123:3511-3519. http://dx.doi.org/10.1002/app.34853
12. Rosa DS, Gaboardi F, Guedes CGF and Calil MR. Inluence of oxidized polyethylene wax (OPW) on the mechanical, thermal, morphological and biodegradation properties of PHB/LDPE blends. Journal of Materials and Science. 2007; 42:8093-8100. http://dx.doi.org/10.1007/s10853-007-1701-z
13. Quental AC, Carvalho FP, Tada ES and Felisberti MI. Blendas de PHB e seus copolímeros: Miscibilidade e Compatibilidade. Quimica Nova. 2010; 33:438-446. http://dx.doi.org/10.1590/ S0100-40422010000200035
14. Verhoogt H, Ramsay BA and Favis BD. Polymer blends containing poly (3-hydroxy alkanoate)s. Polymer. 1994; 35:5155-5169. http://dx.doi.org/10.1016/0032-3861(94)90465-0
15. Sabetzadeh M, Bagheri R and Masoomi M. Effect of corn starch content in thermoplastic starch/low density polyethylene blends on their mechanical and low properties. Journal of Applied Polymer Science. 2012; 126:E-63-E-69. http://dx.doi. org/10.1002/app.36329
16. Pedroso AG and Rosa DS. Mechanical, thermal and morphological characterization of recycled LDPE/ corn starch blends. Carbohydrate Polymers. 2005; 59:1-9. http://dx.doi. org/10.1016/j.carbpol.2004.08.018
17. Ali RR, Wawa R, Kasmani RM, Ibrahim N, Mustapha SNH and Hasbullah. Tapioca starch biocomposite for disposable packaging ware. Chemical Engineering Transactions. 2013; 32:1711-1716.
18. Hoque MdE, Ye TJ, Yong LC and Dahlan KZM. Sago-starch mixed with low density polyethylene biodegradable polymer: Synthesis and characterization. Journal of Materials. 2013; 1-7.
19. Shah PB, Bandopadhyay S and Bellare JR. Environmentally degradable starch illed low density polyethylene. Polymer Degradation and Stability. 1995; 47:165-173. http://dx.doi. org/10.1016/0141-3910(94)00088-P
20. Avella M, Martuscelli E and Raimo M. Properties of blends and composites based on poly (3-hydroxy) butyrate (PHB) and poly (3-hydroxybutirate-hydroxyvalerate) (PHBV) copolymers. Journal of Materials Science. 2000. 35:523-545. http://dx.doi. org/10.1023/A:1004740522751
21. Martelli SM. Environmentally compatible polymeric blends and composites based on oxo-biodegradable polyethylene. [Dissertation]. Pisa: University of Pisa; 2011
22. Martelli SM, Fernandes EG and Chiellini E. Thermal analysis of soil buried oxo-biodegradable polyethylene based blends. Journal of Thermal Analysis and Calorimetry. 2011; 5(3):333-339.
23. Silva CR. Estudo de blendas potencialmente biodegradáveis de poli (3-hidroxibutirato) (PHB) e polietileno de baixa densidade. [Dissertção]. Campinas: Universidade de Campinas, 2001. 24. Burlein GAD. Avaliação das propriedades de polietileno de
baixa densidade PEBD, poli (3-hidróxibutirato) (PHB) e de
suas misturas com torta de mamona. [Dissertação]. Nova Friburgo: Universidade Estadual do Rio de Janeiro; 2010. 25. Arkatkar A, Arutchelvi J, Sudhakar M, Bhaduri S,
Uppara PV and Doble M. Approaches to enhance the biodegradation of polyolefins. The Open Environmental Engineering Journal. 2009; 2:68-80. http://dx.doi. org/10.2174/1874829500902010068
26. Pankova Y, Shchegolikhin A, Iordanskii A, Zhulkina A, Ol’Khov A and Zaikov G. The characterization of novel biodegradable blends based on polihydroxybutyrate. Chemistry & Chemical Technology. 2011; 5(3):333-339.
27. Lukanina JK, Khvatov AV, Kolesnikova NN and Popov AA. In: Progress in Chemicaland Biochemical Physics, Kinectics and Thermodynamics 18: Structure and properties of biodegradable polymer composites material; 2008. Nova Science Publishers; 2008. p. 209-218.
28. Lopes VCP. Foto e biodegradação de PEBD, PHB e suas blendas. [Dissertação]. Rio Claro: Universidade Estadual Paulista; 2011.
29. Iordanskii AL, Kamaev PP, Ol’khov AA and Wasserman AR. Water transport in ‘green’ and ‘petrochemical’ polymers. Differences and similarities. Desalination. 1999; 26:139-145. http://dx.doi.org/10.1016/S0011-9164(99)00166-6
30. Kuriyama FL. Estudo das propriedades obtidas na blenda de PEBD (polietileno de baixa densidade) com PHB (polihidroxibutirato). [Monograia]. São Paulo: Faculdade de Tecnologia da Zona Leste; 2012.
31. Tertyshnaya YuV, Shibryaeva LS and Popov AA. Thermooxidative degradation of blends based on poly (3-hydroxybutyrate). Specifics of the process. Russian Journal of Physical Chemistry B. 2012; 6(1):38-41. http://dx.doi. org/10.1134/S1990793112010149
32. Ol’khov AA, Iordanskii AL, Zaikov GE, Shibryaeva LA, Litivinov IA and Vlasov SV. Morphologically special features of poly (3-hydroxybutyrate) / low density polyethylene blends. Polymer-Plastics Technology and Engineering. 2000; 39(5):783-792. http://dx.doi.org/10.1081/ PPT-100101403
33. Iordanskii AL, Ol’khov AA, Pankova YN, Bonartsev AP, Bonastseva GA and Popov VO. Hydrophilicity impact upon physical properties of the environmentally friendly poly (3-hydroxybutyrate) blends: Modification via blending. Macromolecular Symposia. 2006; 233:108-116. http://dx.doi. org/10.1002/masy.200690005
34. Bonartsev AP. Biosynthesis, biodegradation, and a p p l i c a t i o n o f p o l y ( 3 - h y d r o x y b u t y r a t e ) a n d i t s copolymers - polyestersproduced by diazotrophic bacteria. Communicating Current Research and Educational Topics and Trends in Applied Microbiology. 2007; 295-307.
35. Shibryaeva LS, Iordanskii AL, Ol’kov AA and Zaikov GE. Thermal oxidation of self-degradable composite ilms based on LDPE. Oxidation Communications. 2005; 28(2):442-450.
36. Melo WC, Santos AS, Santa Anna LM and Pereira N Jr. Acid and enzymatic hydrolisis of the residue from Castor Bean (Ricinus cimmunis L.) oil extraction for ethanol production: detoxiication and biodiesel process integration. Journal of Brazilian Chemical Society. 2008; 19(3):418-425. http://dx.doi. org/10.1590/S0103-50532008000300008
38. Stork RR and Rocha MCGR. Composites of low density polyethylene and castor presscake. Polymer Plastics Technology and Engineering. 2010; 49(3):1352-1355. http:// dx.doi.org/10.1080/03602559.2010.496699
39. Machado ACOM, Ribeiro CMS, Freire DMG, Cunha LM, Castilho LR, Dias ML, et al. Material compósito contendo material termoplástico e material protéico e processo de obtenção. Brazil Patent BR PI0804101-6 A2; 2008 Sept 09, 2010 Jul 06. Available from: <http://www. patentesonline.com.br/material-comp-sito-contendo-material-termopl-stico-e-material-prot-ico-e-processo-229188.html>.
40. American Society for Testing and Materials - ASTM. ASTM D1238: Standard test method for melt low rates of the thermoplastic by extrusion plastometer. Philadelphia: ASTM; 2010.
41. Minitab Inc. Minitab 15 software programme. 2007. Available from: <http://www.minitab.com/er-Av/default.aspx>. Access in: 20/01/2012.
42. American Society for Testing and Materials - ASTM. ASTM D790: Standard test methods for flexural properties of unreinforced and reinforced plastics and electrical insulating materials properties of plastics. Philadelphia: ASTM; 2003. 43. American Society for Testing and Materials - ASTM.
ASTM D638: Standard test method for tensile properties of plastics. Philadelphia: ASTM; 2003.