© 2013 IBRACON
This paper assesses environmental loads of concretes made with Portland blended cements containing different proportions of ground granulated blast furnace slag (ggbs) as clinker replacement and with characteristic compressive strength ranging from 25 to 60 MPa. Impact assessment method CML 2001 v. 2.04 and Life Cycle Assessment platform SimaPro 7.3 respectively supported calculations in terms of environmental impact categories and of a set of life cycle indicators. Service life, estimated via Life 365 v.2.1 software, is tested as a functional unit normalizer for envi-ronmental assessment of concrete elements through application to the embodied CO2 indicator. Increased fractions of ggbs in Portland cement reduce concretes’ life cycle environmental loads as indicated by all metrics but blue water footprint. Effects of clinker replacement on the indicators are discussed. Service life consideration proved to add coherence to concrete’s environmental, functional and technical quality interpretation.
Keywords: cement; concrete; service life; environmental indicators; life cycle assessment.
Este trabalho objetiva avaliar as cargas ambientais de concretos fabricados com cimento Portland contendo diferentes proporções de escória granulada de alto-forno (egaf) em substituição ao clínquer e com resistência carcaterística variando de 25 a 60 MPa. O método de avaliação de impactos CML 2001 v. 2.04 e a paltaforma de Avaliação de Ciclo de Vida SimaPro 7.3 deram suporte ao cálculo das categorias de impacto e de um conjunto de indicadores de ciclo de vida, respectivamente. A vida útil, estimada por meio do software Life 365 v.2.1, é testada como unidade funcional normalizadora para a avaliação ambiental dos elementos de concreto por meio da aplicação do indicador CO2 incorporado. Os valores dos indicadores, com exceção da pegada de água azul, evidenciam que o aumento das frações de egaf no cimento Portland reduz as cargas ambientais do ciclo de vida do concreto. Discutem-se os efeitos da substituição do clínquer sobre os indicadores. Aconsideração da vida útil provou agregar coerência à interpretação da qualidade ambiental, funcional e técnica do concreto.
Palavras-chave: cimento; concreto; vida útil; indicadores ambientais; avaliação do ciclo de vida.
Inluence of service life, strength and cement type
on life cycle environmental performance of concrete
Inluência da vida útil, resistência característica e tipo
de cimento no desempenho ambiental do ciclo de vida
do concreto
M. G. SILVA a [email protected]
M. R. M. SAADE b [email protected]
V. GOMES b [email protected]
a Technology Center, Civil Engineering Department, Federal University of Espírito Santo, Vitória, ES, Brazil b School of Civil Engineering, Architecture and Urbanism, University of Campinas, Campinas, SP, Brazil
Received: 11 Dec 2012 • Accepted: 13 Oct 2013 • Available Online: 12 Dec 2013
Abstract
1. Introduction
In 2011, Portland cement’s annual global production reached the value of 2.8 billion tones (Schneider et al [1]). As a result, cement making currently responds for approximately 5% of global anthro-pogenic carbon emissions (Huntzinger; Eatmon [2]). That percent-age is increasing rapidly, considering that cement and concrete manufacture rises at a rate that is higher than the reduction of carbon emissions (CSI [3]). Portland cement global production is expected to increase by 2.5 times between 2005 and 2050, with a considerable amount of that growth happening in developing coun-tries (CSI [4]).
Roughly half of cement making CO2 is emitted during decarbon-ation of limestone into calcium oxide, which will react with silica and aluminum oxide to produce Portland clinker. Substituting sup-plementary cementitious materials (SCMs) for clinker in cement has therefore a great potential to lower cement and concrete’s car-bon footprint, as well as consumption of virgin material, embodied energy and other impacts associated to clinker manufacturing. Technical advantages of replacing clinker with ground granulated blast furnace slag (ggbs), for example, have been demonstrated by several studies, including those of Silva [5], Silva et al [6], and Silva [7]. Isaia and Gastaldini [8] showed that the environmental, technical and economical gains are proportional to the amount of clinker replaced. Similarly, Buffenbarger [9] states that the em-bodied energy of concrete mixtures is directly proportional to their cement content and Van Geem [10] estimates that for every 1% replacement of cement with SCMs the embodied energy of con-crete is reduced by 0,7%. Comparable reference values for other environmental indicators applied to concrete are still scarce. In Brazil, ggbs has been used as clinker replacement in Portland cement manufacturing for over 50 years. According with their ggbs content by mass, two types of blended cements are standardized: CP II-E-32, with up to 35% of ggbs (ABNT [11]) and CP III-32, with up to 70% of ggbs (ABNT [12]).
This paper aims at estimating some environmental loads associ-ated to concretes using different types of cement and with differ-ent characteristic compressive strengths (fck). It also investigates usefulness of service life, estimated via Life 365 v.2.1 software, as a functional unit normalizer for environmental assessment of concrete elements. Impact assessment method CML 2001 v. 2.04 and Life Cycle Assessment platform SimaPro 7.3 respectively sup-ported calculations in terms of environmental impact categories and of a set of life cycle indicators.
Life cycle environmental indicators are commonly used to describe the resource intensity and other environmental loads associated to a given product or process. Great attention is paid to embodied en-ergy and carbon, but, with the crescent demand for environmental product declarations (EPDs) in all business sectors, the European Standard EN 15804 [13] was established to determine the core rules for declarations referring to construction products. From all environmental parameters listed in that standard, primary energy, global warming potential (GWP), ozone depletion potential (ODP),
acidiication potential (AP), eutrophication potential (EP) and pho -tochemical ozone creation potential (POCP) seem to be the most usually found. Contrastingly, though also listed as potential items in EPDs of construction products and fundamental to provide a thorough understanding of their impacts, water consumption and some metric of mineral resources depletion are seldom used.
The European Committee for Standardization Technical Com-mittee dedicated to developing standards on sustainability of construction works (CEN TC 350) recommends using the abiotic depletion potential (ADP). However, different forms of APD can be used, depending on the type of reserve and the available extrac-tion rates. In the construcextrac-tion sector, ADP might be adapted to de-scribe local depletion of natural resources (i.e. non-renewable raw material content) such as gravel and sand (Habert et al. [14]) and be possibly complemented by a recycling indicator, pointed out by
RILEM LCA Technical Committee as the only speciic indicators
needed apart from the generally used environmental life cycle indi-cators (Roussel [15]). This matter is still a research topic targeted
by the specialized scientiic community.
2. Methodology
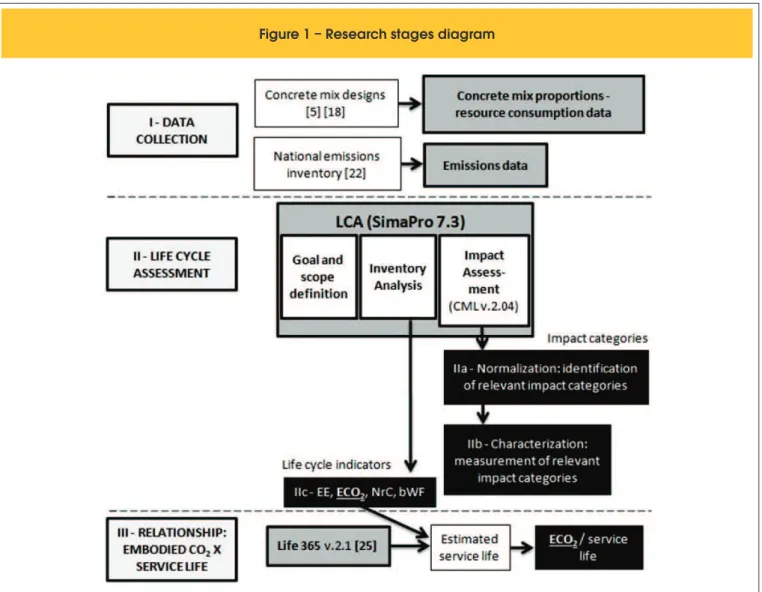
Figure [1] summarizes the main steps of this study. Black boxes represent the results obtained. The following items describe each stage more thoroughly.
LCA is divided in three main stages: (i) goal and scope deinition,
when the study’s purpose is deined; (ii) life cycle inventory (LCI) analysis, in which calculations regarding emissions and resource
use is carried; and, inally, (iii) environmental impact assessment, in which data regarding emissions and resource use is related to different impact categories, transforming the inventory results into more relevant environmental information.
According to ISO 14044:2006 (ISO [16]), the impact assessment stage is divided in mandatory, and optional sub stages. The
man-datory sub stages are classiication and characterization. Classi
-ication assigns LCI results to their respective impact categories,
and characterization measures the relative contribution of each LCI result to its impact category, using equivalency factors. The optional sub stages performed vary across impact assess-ment methods. Normalization is the only optional sub stage per-formed by CML 2001 v.2.04, the impact analysis method adopted in this paper. Normalization shows to what extent an impact cat-egory contributes to the overall environmental problem, through the division of the impact category value by a “normal” value, which
could be, for example, the impact category indicators for a speciic
region during a year, divided by the number of inhabitants in that
speciic area (Goedkoop et al [17]). CML 2001 v.2.04 adopts that
type of procedure considering the entire planet as the analyzed region. This procedure helps identifying the impact categories with
the most - and the least - signiicant contributions to their respec -tive impacts, reducing the number of environmental issues to be
evaluated in detail to provide an environmental proile overview.
2.1 Data used in this study
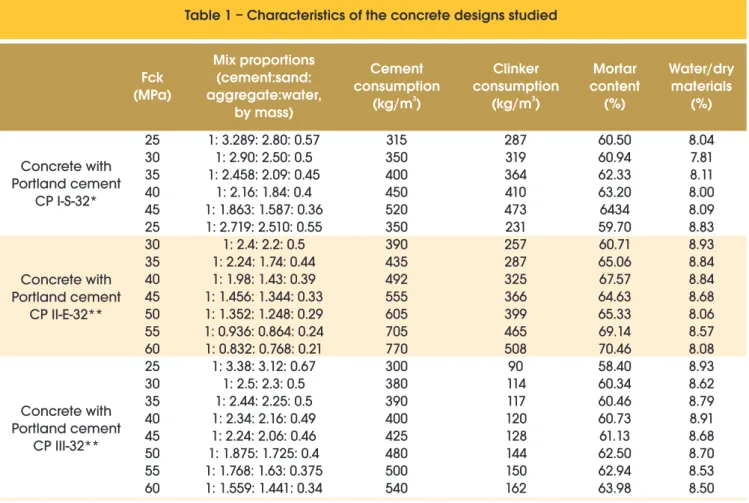
Based upon published data on concrete mix designs with CP II-E-32 and CP III-32 (Silva [5]), and with CP I-S-32 (Regattieri et al [18]), the respective strength (fck) values were entered in concrete mix design graphs to obtain the mix proportions, cement (and clin-ker) consumption, mortar content and water to dry materials ratio listed in Table [1] for each strength class.
Concrete mixes with CP II-E-32 and with CP III-32 were
lab-de-signed for consistency 70 ± 10 mm, to avoid unidentiied inluence of
admix-846 IBRACON Structures and Materials Journal • 2013 • vol. 6 • nº 6
considered in this paper represents a speciic commercial situa -tion, achieved through their separate grinding.
From the data expressed in Table [1], it was possible to perform the LCA (item 2.2, 2.3 and 2.4) and to estimate the service life (item 2.5) of each concrete.
2.2 Goal and scope deinition
The most convenient functional unit to perform LCAs of concretes with different mix designs was considered to be 1 m3. This unit is
commonly used in comparable studies for the material concrete. The system boundaries adopted characterize a cradle to gate
analysis, which encompasses all stages - from the extraction of raw material for manufacturing to the (cement and concrete) facto-ry’s gate - but transportation and use. The support platform chosen for performing the LCA was SimaPro 7.3, which accommodates a wide range of research goals and allow database adaptation, ensuring data adherence to the context of interest.
As against the background of a sustainability assessment, a con-struction element must be considered in view of its functional and technical quality (Mueller [21]), the second phase of the analysis tures were used to ensure consistency of 110 ± 20 mm, which
repre-sents commercial practice seeking to reduce cement consumption. The very small admixture content in concretes with CP I-S-32 was
considered of negligible inluence and excluded from the LCA per -formed, in alignment with Van Den Heede and Belie [19] remarks. Table [1] shows that the studied concretes presented similar rang-es of mortar content and of water to dry materials ratio. Drang-espite their difference in consistency, such similarity assures uniformity across the main technical features governing fresh concrete’s properties, allowing for comparison between them. The maximum fck obtained for concretes with CP I-S-32 (45MPa), exceptionally limited the analysis of those concretes to that strength threshold. The percentage of ggbs, by mass, was 5% in CP I-S-32 (REGAT-TIERI et al [18]) and 30% and 66%, respectively, in CP II-E-32 and CP III-32 (SILVA et al [6]), all of them compliant with corresponding Brazilian standards (ABNT [20]; ABNT [11]; ABNT [12]).
Though ABNT NBR 5735:1991 (ABNT [12]) allows incorporation of up to 70% of ggbs by mass to Portland cement CP III-32, com-mercial practice limits the maximum percentage to around 58%, considered as the economic viability threshold for joint grinding of clinker and ggbs. The clinker replacement with 66% ggbs by mass
IBRACON Structures and Materials Journal • 2013 • vol. 6 • nº 6
all phases of the evaluated life cycle, supporting calculation of the indicators. For the EE calculation, the listed amounts of primary energy consumed from raw material extraction to manufacturing of 1 m3 of concrete were summed. Analogously, the ECO
2
calcula-tion computed all CO2 emissions listed in the inventory and disre-garded other GHG gases. The bWF calculation added the water – obtained from ground and surface water sources - consumed during the extraction and production of each material/component (Hoekstra et al [24]). Finally, for NRc calculation, the consumption of all non-renewable mineral resources was totaled.
2.4 Environmental impact analysis
In this stage, life cycle inventory data are converted into speciic
impact categories inputs, covering impacts on natural resources, human health and ecosystem quality. The impact categories pre-set by CML 2001 v.2.04 include global warming, ozone layer de-pletion, human toxicity, aquatic, terrestrial and sediment ecotoxic-ity, land competition and oxidation, among others.
2.5 Service life prediction
As the concrete mix designs considered were originally developed for structures in regions potentially exposed to chloride attack, specialist assessed structural components produced with the studied
(ma-terial) concretes, subjected to certain exposure conditions and
aiming at fulilling a given service life. Usefulness of service life
as an indicator normalizer to describe performance of reinforced concrete components is therefore investigated.
2.3 Inventory analysis
Modeling of Portland cement’s manufacturing process uses sec-ondary data from SILVA et al [6] and from the Brazilian inventory for greenhouse gases (GHG) associated to cement production (CARVALHO et al [22]). The mix designs listed in Table [1] were used to model concrete’s manufacturing. Aggregates and water data were adapted from the Ecoinvent v.2.2 database, by switch-ing into the Brazilian energy grid, since such processes were
con-sidered as suficiently adherent to national practice.
During the inventory analysis the core set of life cycle environ-mental indicators proposed by Saade et al [23] was calculated for 1 m3 of each concrete, comprising: (i) embodied energy (EE - MJ/
m3), (ii) embodied CO
2 (ECO2 – kg CO2/m
3), (iii) blue water
foot-print (bWF - m3/m3) and (iv) non-renewable raw material content
(NRc - kg/m3).
Life cycle inventories of LCAs provide data concerning resources consumed as well as emissions and waste produced throughout
Table 1 – Characteristics of the concrete designs studied
Fck
(MPa)
Mix proportions
(cement:sand:
aggregate:water,
by mass)
Cement
consumption
3(kg/m )
Clinker
consumption
3(kg/m )
Mortar
content
(%)
Water/dry
materials
(%)
25
30
35
40
45
25
30
35
40
45
50
55
60
25
30
35
40
45
50
55
60
1: 3.289: 2.80: 0.57
1: 2.90: 2.50: 0.5
1: 2.458: 2.09: 0.45
1: 2.16: 1.84: 0.4
1: 1.863: 1.587: 0.36
1: 2.719: 2.510: 0.55
1: 2.4: 2.2: 0.5
1: 2.24: 1.74: 0.44
1: 1.98: 1.43: 0.39
1: 1.456: 1.344: 0.33
1: 1.352: 1.248: 0.29
1: 0.936: 0.864: 0.24
1: 0.832: 0.768: 0.21
1: 3.38: 3.12: 0.67
1: 2.5: 2.3: 0.5
1: 2.44: 2.25: 0.5
1: 2.34: 2.16: 0.49
1: 2.24: 2.06: 0.46
1: 1.875: 1.725: 0.4
1: 1.768: 1.63: 0.375
1: 1.559: 1.441: 0.34
315
350
400
450
520
350
390
435
492
555
605
705
770
300
380
390
400
425
480
500
540
287
319
364
410
473
231
257
287
325
366
399
465
508
90
114
117
120
128
144
150
162
60.50
60.94
62.33
63.20
6434
59.70
60.71
65.06
67.57
64.63
65.33
69.14
70.46
58.40
60.34
60.46
60.73
61.13
62.50
62.94
63.98
8.04
7.81
8.11
8.00
8.09
8.83
8.93
8.84
8.84
8.68
8.06
8.57
8.08
8.93
8.62
8.79
8.91
8.68
8.70
8.53
8.50
Concrete with
Portland cement
CP I-S-32*
Concrete with
Portland cement
CP II-E-32**
Concrete with
Portland cement
CP III-32**
848 IBRACON Structures and Materials Journal • 2013 • vol. 6 • nº 6 Life 365 v.2.1 software supported service life prediction of
hypotheti-cal reinforced concrete structural elements using those mixtures. The software assumes that the corrosion mechanism by chloride attack is divided in initiation and propagation periods. The
initia-tion period corresponds to the time until suficient chlorides pen -etrate the concrete cover. It is a function of the concrete cover’s quality and thickness, exposure conditions and chloride concen-tration threshold to trigger the corrosion process. To predict the
initiation period, a simpliied approach assumes that the concrete
is completely saturated and that ionic diffusion is the only chloride transport mechanism, governed by Fick’s second diffusion Law (Equation [1]).
(1)
dC
dt =D.
d
2C
dx
2where D is the apparent diffusion coeficient; C is the chloride
amount; x is the depth measured from the external surface; and t is time.
The diffusion coeficient is a function of time and temperature, cal -culated by Equation [2].
(2)
D(t)=D
ref.
(
t
reft
)
mwhere D(t) is the diffusion coeficient at time t (assumed as < 25 years by Life-365 software); Dref is the diffusion coeficient at time tref (assumed as 28 days by Life-365 software); m is the diffusion decay index, a constant.
The software selects Dref and m based on mixture design details,
such as water/cementitious materials ratio and on type and pro-portion of cementitious materials. Corrosion initiation time is
cal-culated by inite difference method to solve Equation [1], where D value is modiied at each time increment using Equation [2]. It
is assumed that: (a) the material is homogeneous; (b) supericial
chloride concentration around the concrete element is constant for any given point in time; (c) the element’s properties are constant during each time interval; and (d) the diffusion constant is uniform throughout the element’s depth (Ehlen [25]).
The default propagation period is 6 years, but can be changed to
relect local speciicities. This way, actual data input is the soft -ware current version is limited to type and dimensions of the given structural element, temperature and chloride exposure conditions, concrete mix proportions, reinforcement steel type and its percent-age in the element’s transversal section (Ehlen [25]).
In this paper, hypothetical linear elements (300-cm long, with a square cross section of 30 x 30 cm) are submitted to Class III expo-sure condition according to ABNT NBR 6118:2007 (ABNT [26]). A minimum concrete cover of 3 cm was adopted, which corresponds to a nominal coverage of 4 cm, considering a 1 cm tolerance. Input temperatures were monthly averages taken from the EPW
(Ener-gyplus Weather Data) ile for the city of Vitoria, Brazil.
2.6 Results analysis
Results interpretation is performed in two main phases: (1) evalua-tion of environmental impacts categories associated to the produc-tion of one cubic meter; and calculaproduc-tion of four life cycle environ-mental indicators for each of the studied concrete design mixes; and (2) assessment of impacts per year of service life of structural
elements using those concretes.
In the irst step, values for all impact categories encompassed by
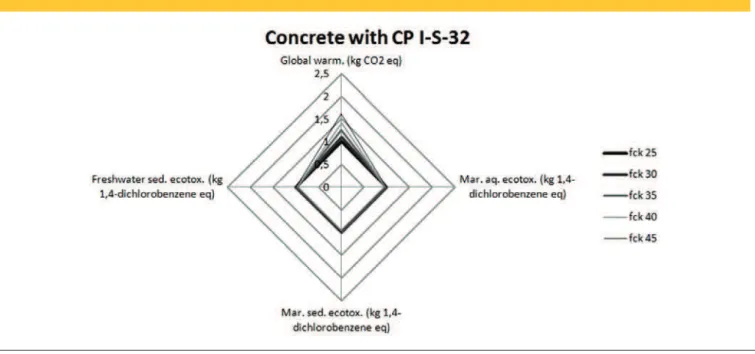
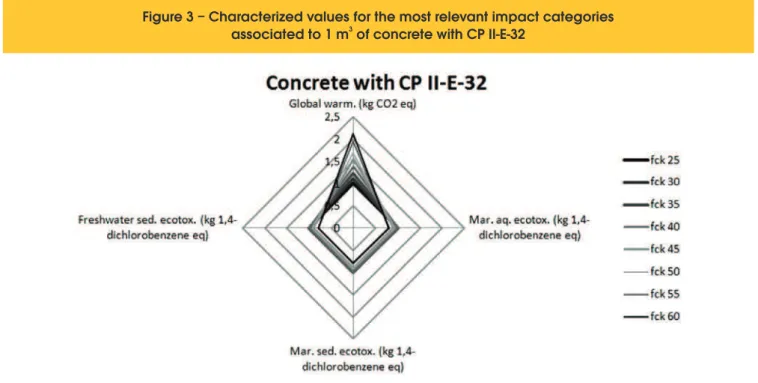
CML 2001 v.2.04 are calculated and the categories that stand out after normalization stage are listed. For better visualization (Van
Den Heede and Belie [19]; Mueller [21]), concrete with fck 25 MPa is taken as reference and, for each impact category, results ob-tained for the different mix designs are normalized in relation to values obtained for concretes with fck 25|CP I-S-32 (Figure [2]), fck 25|CP II-E-32 (Figure [3]) and fck 25|CP III-32 (Figure [4]). Next, the selected life cycle environmental indicators (embodied energy, embodied carbon, blue water footprint and non-renewable content) are calculated for all concrete design mixes, in order to provide
values that are more easily communicated to and understood by designers and contractors.
Finally, the relationship between environmental impact and con-crete’s service life is illustrated through application to the embod-ied CO2 indicator. The authors chose to limit the impact/service life analysis carried out here since the “global warming” impact category is a well-known environmental liability that arises from cement and concrete production and - in their particular
manufac-Figure
3 – Characterized values for the most relevant impact categories
3
associated to 1 m of concrete with CP II-E-32
Figure 4 – Characterized values for the most relevant impact
3
850 IBRACON Structures and Materials Journal • 2013 • vol. 6 • nº 6 turing processes - CO2 emissions are the main contributors to that
impact. Detailed analysis and discussion of the remaining environ-mental impact categories and indicators mentioned are targeted by parallel studies in a larger research project, being therefore out of the scope of this paper.
3. Results and discussions
3.1 Characterization of the most relevant
environmental impact categories
Normalization revealed that the most relevant impact categories for production of all types of concrete studied were (i) global warming, (ii) marine aquatic ecotoxicity, (iii) marine sediment ecotoxicity,
and (iv) freshwater sediment ecotoxicity. The analysis was limited to the characterized values found for a 100-year time boundary, set as default by the impact assessment method (Figures [2], [3] and [4]).
As expected from previous scientiic publications, comparison
across Figures [2], [3] and [4] highlights that concretes using blended cements have lower GWP than the reference concrete. Furthermore, fck increase (which, for the cases studied, is ob-tained through higher cement - and clinker - consumption) also
intensiies GWP, but at a signiicantly lower rate for concretes with
ggbs substitution for clinker in cement. Since clinker production
does not contribute as signiicantly to ecotoxicity as its CO2
emis-sions do to global warming, and since such contribution seems
3
Figure 5 – Embodied energy calculated for 1 m of
concretes with CP I-S-32, CP II-E-32 and CP III-32
3
2
of concrete with CP I-S-32, CP II-E-32 and CP III-32
3
Figure 7 – Blue water footprint calculated for 1 m
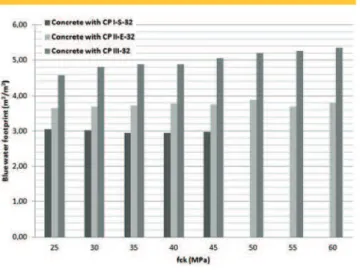
of concrete with CP I-S-32, CP II-E-32 and CP III-32
to be similar to that of ggbs, the ecotoxicity impact values slightly reduce with the increase in fck, but at a negligible rate.
3.2 Calculation of life cycle environmental
indicators
Figures [5], [6], [7] and [8] present the calculated values of the selected life cycle environmental indicators.
Values of embodied CO2, embodied energy and non-renewable raw material content indicators diminish considerably and pro-gressively with the increase in ggbs as clinker replacement from 5% (CP I-S-32) to 30% (CP II-E-32) and to 66% (CP III-32). These results corroborate the environmental advantages of replacing clinker with ggbs in cement/concrete manufacturing pointed out by authors like Isaia and Gastaldini [8], Van Den Heede and Belie [19], Buffenbarger [9], Van Geem [10] and Mueller [21].
The only exception was the blue water footprint indicator, which conversely rises when shifting from concrete with CP I-S-32 to concrete with CP III-32. The observed raise results from the water intensive blast furnace slag granulation process. Most steelmak-ing companies environmental management programs have imple-mented water reuse practices. Such procedures were not
consid-ered in this paper, as their variation challenges coniguration of an
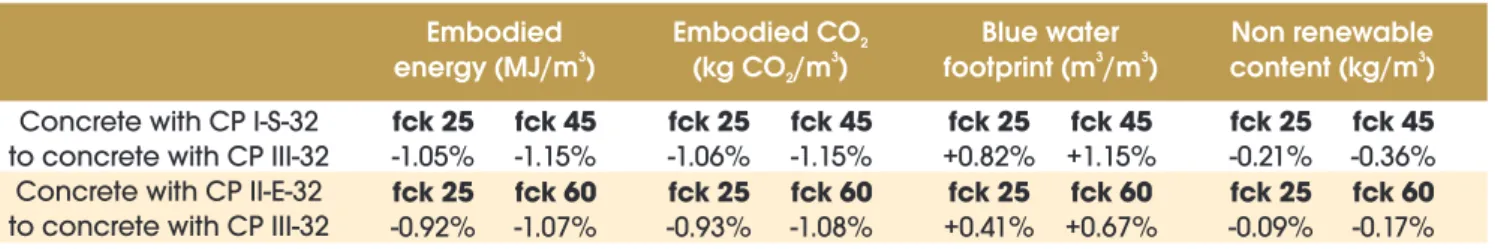
average industry practice to be accounted for in the LCA modeling. Table [2] shows the variations on each indicator’s values for every
1% replacement of clinker with ggbs. The resulting beneit in terms
of embodied energy (0,92%-1,15%) is higher than international
SCM’s average (-0,7%, reported by Van Geem [10]).International reference values for the other environmental indicators investigat-ed were not fount at the time of writing, but would probably follow this trend.
3.3 Relationship between embodied CO
2and concrete’s service life
Table [3] presents the service life estimated by software Life 365 v.2.1 for each type of concrete studied.
Figure [9] uses those data to normalize the mass of CO2 embod-ied in 1 m3 of each concrete per year of its service life. These
re-sults disregard the potential downsizing of the structural elements (dematerialization) due to increased characteristic compressive strength.
Figure [9] conirms that, for any given resistance, much more CO2
is embodied in each m3 of concrete with CP I-S-32 than with CP
II-E-32 and with CP III-32, at a factor that is roughly proportional to the ggbs content. Concretes with Portland cements CP II-E-32 and CP III-32 show approximately horizontal trend lines, which repre-sent strength growth at a constant mass of embodied CO2 per m3
of concrete. Contrastingly, concretes with cement CP I-S-32 follow a steep curve, suggesting that each increase in strength comes at a much higher environmental impact increment and that service life extension (Table [3]) is not able to neutralize the additional CO2 emissions resulting from the higher clinker consumption needed for increased resistance (Table [1]).
Table 2 – Variations on each indicator's values for every 1% replacement of clinker with ggbs
Embodied
3
energy (MJ/m )
Embodied CO
(kg CO /m )
3 2footprint (m /m )
Blue water
3 3 2Non renewable
3
content (kg/m )
fck 25
-1.05%
fck 25
-0.92%
fck 25
+0.82%
fck 25
+0.41%
fck 25
-1.06%
fck 25
-0.93%
fck 25
-0.21%
fck 25
-0.09%
fck 45
-1.15%
fck 60
-1.07%
fck 45
+1.15%
fck 60
+0.67%
fck 45
-1.15%
fck 60
-1.08%
fck 45
-0.36%
fck 60
-0.17%
Concrete with CP I-S-32
to concrete with CP III-32
Concrete with CP II-E-32
to concrete with CP III-32
Table 3 – Estimated service life
(in years) of analyzed concretes
Fck
(MPa)
Concrete with
CP I-S-32
Concrete with
CP II-E-32
Concrete with
CP III-32
C25
C30
C35
C40
C45
C50
C55
C60
9.2
9.8
10.4
11.1
11.8
–
–
–
10.2
11
12.1
13.2
15.2
16.8
18.8
18.8
11.6
14.4
14.4
14.8
16.1
19.6
21.4
24.6
Figure 9 – Relationship between the embodied CO
23
852 IBRACON Structures and Materials Journal • 2013 • vol. 6 • nº 6
4. Final considerations
Normalization revealed that global warming and ecotoxicity (marine aquatic, marine sediment and freshwater sediment) are the most rel-evant impact categories for the concretes modeled. Concretes using
blended cements have global warming potential (GWP) signiicantly
lower than the reference concrete. Results for global warming are very sensible to clinker content. Furthermore, fck increase based
on higher cement/clinker consumption intensiies the GWP, but at a signiicantly lower rate for concretes with ggbs substitution for clinker
in cement. On the other hand, clinker’s contribution to ecotoxicity seems to be close to that of ggbs, so that values in those categories do not change much with the increase in fck.
Increasing the ggbs substitution for clinker in Portland cement re-duced the overall concrete environmental loads as indicated by all
metrics but blue water footprint. The beneits of such replacement seem to be higher than average international SCM’s igures.
Consideration of service life as a normalizer when establishing en-vironmental indicators adds coherence to life cycle enen-vironmental performance interpretation, to simultaneously communicate con-crete’s environmental, functional and quality aspects.
5. Acknowledgements
Authors thank Companhia Paulista de Força e Luz (CPFL) and
Conselho Nacional de Desenvolvimento Cientíico e Tecnológico
(CNPq) for their inancial support.
6. References
[01] Schneider M; Romer M; Tschudin M; Bolio H. Sustainable cement production—present and future. Cement and Concrete Research, vol. 41, 2011;
p. 642-650.
[02] Huntzinger DN; Eatmon TD. A life-cycle assessment of Portland cement manufacturing: comparing the traditional process with alternative technologies. Journal of Cleaner Production, vol. 17, 2009;
p. 668–675.
[03] Cement Sustainability Initiative - CSI. Cement industry energy and CO2 performance – Getting the numbers right. 2009. Available at: < http://www.wbcsdcement. org/pdf/csi-gnr-report-with%20label.pdf>. Access in Oct. 14, 2011.
[04] Cement Sustainability Initiative - CSI. Cement – At the foundation of sustainable development. 2007. Available at: < http://www.wbcsdcement.org/pdf/csi.pdf>. Access in Oct. 12, 2011.
[05] SILVA, M. G. (coordinator). Concreto de Alto Desempenho com Elevados Teores de Escória de Alto Forno: Estratégia para consolidar o Mercado da Escória de Alto Forno. Technical Report, Núcleo de Excelência em Escórias Siderúrgicas (NEXES).
Centro Tecnológico, Universidade Federal do Espírito
Santo, 2006.
[06] SILVA, M. G.; SILVA, V., G.; RODRIGUES, G. L. C.;
POLESE, M. O. Propriedades, normalização e tendências na adição de escória de alto-forno em cimentos e concretos. Technical Report, Núcleo
de Excelência em Escórias Siderúrgicas, Centro
Tecnológico, Universidade Federal do Espírito Santo,
2006, p. 106.
[07] SILVA, M. G. Cimento Portland com Adições Minerais. Materiais de Construção Civil e Princípios de Ciência e Engenharia de Materiais (Ed. ISAIA, G. C), 2a Edição
Atualizada e Ampliada, 2010, p.791-824.
[08] Isaia GC; Gastaldini ALG. Perspectivas ambientais e econômicas do concreto com altos teores de adições minerais: um estudo de caso. Ambiente Construído, vol. 4, 2004; p. 19-30.
[09] BUFFENBARGER, J.K. Achieving sustainability and
resiliency in the built environment through the use of bended cements. In: First international conference on concrete sustainability, 1st, Tokyo, 2013, Proceedings,
Tokyo, May 27-29, 2013. Lead Paper. p. 73-80. [10] Van Geem MG. Sustainability designer’s notebook.
PCI Accent, Spring 2007. Precast/Prestressed Concrete Institute. 2007.
[11] Associação Brasileira de Normas Técnicas - ABNT. Cimento Portland composto. NBR 11. 578. Rio de Janeiro, 1991.
[12] Associação Brasileira de Normas Técnicas – ABNT. Cimento Portland de alto-forno. NBR 5735. Rio de Janeiro, 1991.
[13] European Committee for Standardization. Sustainability of construction works – Environmental product declarations – Core rules for the product category of construction products. EN 15804:2012. Brussels, 2012.
[14] HABERT, G., BOUZIDI, Y., CHEN, C., JULLIEN,
A. Resource consumption indicator for concrete construction. Concrete 21st Century super hero. In: Annual international FIB symposium, 11th, London,
2009, Proceedings, London 2009.
[15] ROUSSEL, N. RILEM activities in the ield of sustainable
construction and its future. In: First international conference on concrete sustainability, 1st, Tokyo,
2013, Proceedings, Tokyo, May 27-29, 2013. Lead Paper. p. 56-61.
[16] International Organization for Standardization (ISO). Environmental management – Life Cycle Assessment – Requirements and Guidelines. ISO 14044, 2006.
[17] GOEDKOOP, M.; SCHRYVER, A. D.; OELE, M.; DURKSZ, S.; ROEST, D. Introduction to LCA with
SimaPro 7. Amersfoort: Product Ecology Consultants, 2008. 82 p.
[18] REGATTIERI, C. E. X.; SILVA, M. G.; HELENE,
P. Inluência das adições do cimento na resistência à
penetração de íons cloreto. In: Reunião do IBRACON, 41ª, Salvador, 1999.
[19] Van Den Heede P; Belie N. Environmental impact and life cycle assessment (LCA) of traditional and ‘green’ concretes: Literature review and theoretical calculations. Cement and Concrete Composites, vol. 32, 2012; p. 431-442.
[20] Associação Brasileira de Normas Técnicas - ABNT. Cimento Portland comum. NBR 5732. Rio de Janeiro, 1991.
[21] MUELLER, H. S.; VOGEL, M.; HAIST, M. Service life
In: First international conference on concrete sustainability, 1st, Tokyo, 2013, Proceedings, Tokyo,
May 27-29, 2013. Lead Paper. p.93-106.
[22] CARVALHO, J. O.; KIHARA, Y.; MAIA, C.; VISEDO,
G., Emissões de Gases de Efeito Estufa nos Processos Industriais – Produtos Minerais (Parte 1). In: Segundo Inventário Brasileiro de Emissões e Remoções Antrópicas de Gases de Efeito Estufa, Brasilia, 2010, 37 p.
[23] SAADE, M. R. M.; SILVA, M. G.; GOMES, V. Proposition and Preliminary Analysis of a Core Set of Indicators to
Describe Material Eco-Eficiency of Brazilian
Buildings. In: Smart and Sustainable Built Environment, 1st, São Paulo, 2012, Proceedings, São Paulo, 2012,
p.525-532.
[24] HOEKSTRA, A.Y.; CHAPAGAIN, A.K.; ALDAYA, M.M. and MEKONNEN, M.M. The water footprint
assessment manual: setting the global standard. London: Earthscan Ltd., 2011.
[25] EHLEN, M. A. Life-365 Service life prediction model,
v.2.1.1 – Users Manual. January, 31, 2012.