RBRH, Porto Alegre, v. 21, n. 4, p. 789-796, out./dez. 2016 Scientiic/Technical Article
http://dx.doi.org/10.1590/2318-0331.011615006
Calculation method for charging water on shrimp farming
Método de cálculo para cobrança da tarifa pelo uso da água na carcinicultura
Lorena Soares Monteiro1, David Araujo Borges2, Ticiana Marinho de Carvalho Studart1, José Nilson Bezerra Campos1 and Francisco Suetônio Bastos Mota1
1Universidade Federal do Ceará, Fortaleza, CE, Brasil
2Universidade Federal do Rio Grande do Norte, Natal, RN, Brasil
E-mails: [email protected] (LSM), [email protected] (DAB), [email protected] (TMCS), [email protected] (JNBC), [email protected] (FSBM)
Received: January 21, 2015 - Revised: February 13, 2016 - Accepted: July 29, 2016
ABSTRACT
The increase of global water demand has stimulated the application of water charging to seek its rational use. However, the establishment of the water tariff for a certain use is not an easy task, given that this tariff must have an elevated value, suficient to encourage the rational use, but not so elevated, in a manner that compromises or prevents the development of production activities. The present study aimed to evaluate different water tariff values proposed and applied to the shrimp farming industry in Ceará, from 2003 to 2016, and analyze the sensitivity of the industry to these values. The analyses considered the productive performance of the shrimp farming observed by the producers, production costs for the activity, and incomes earned by the producers in 2008. The present study demonstrated that the only tariff value that makes the sector inancially attractive is R$1.00/1,000m3, a lower value than the one previously proposed by the state of Ceará (R$ 31.20/1,000m3), which was reduced in the following years. In this context, a model was developed to ix tariffs for shrimp farming, which considers the payment capacity of the entrepreneur and the production costs to cultivate shrimp.
Keywords: Water charging; Payment capacity; Shrimp farming.
RESUMO
O aumento na demanda pela água no mundo estimulou a aplicação da cobrança na busca pelo uso racional dos recursos hídricos. A ixação da tarifa de água para um determinado uso não é fácil, dado que ela deve ter um valor elevado o bastante que incentive o seu uso racional, porém não elevado o suiciente que comprometa ou impeça o desenvolvimento de atividades produtoras. Este estudo avalia diferentes valores de tarifa sugeridos e aplicados ao setor da carcinicultura no Ceará no período de 2003 a 2016 e analisa a sensibilidade do setor a esses valores. Foram considerados os resultados zootécnicos da atividade, bem como os custos de produção e receitas auferidas pelos produtores no ano de 2008. O estudo mostrou que o único valor de tarifa que torna o setor inanceiramente atraente para este uso é o de R$ 1,00/1.000m3, valor bem abaixo do inicialmente proposto pelo Estado (R$ 31,20/1.000m3), o qual foi reduzido em anos posteriores. Neste contexto, foi desenvolvido um modelo para ixação de tarifas para a carcinicultura, o qual considera a capacidade de pagamento dos empresários e o custo de produção dos camarões.
INTRODUCTION
Shrimp farming underwent a strong global expansion in the 1970s and has since continued to grow. It started in China, Thailand, Vietnam, and Indonesia which still remain as the largest shrimp producers, representing 85% of the global production. Production in the western hemisphere is concentrated in the South and Central American countries, which account for 13.3% of global production, with Ecuador, Mexico, and Brazil being the largest shrimp producers. Brazil is the ninth largest producer in the world, representing 1.8% of the global production (FAO, 2013). The expansion of shrimp farming was associated with the growing demands from the US, Japanese, and European markets, and with the high level of return on investment.
Shrimp farming in Brazil was promoted in 1998, for having a favorable climate, hydrography, and topography. The favorable conditions allow for three production cycles per year, where each cycle is 90 days. Production in Brazil increased from 3,600 to 65,000 tons between 1997 and 2005. However, shrimp exports from Brazil began to decline in 2005, for various reasons, including the appreciation of the Brazilian Real (ABREU et al., 2011).
The northeast region of Brazil is responsible for 99.3% of the national production and is where 92% of all of the producers are located, most of which reside in the states of Rio Grande do Norte and Ceará (ABCC, 2013).
The majority of commercial shrimp farms in the state of Ceará are located near the coast, mainly in watersheds inluenced by brackish waters. Shrimp farming on the coastline of Ceará is divided into the western coast and the eastern coast regions. The western coast region is located in the sub-region Acaraú/Camocim, northwestern in the state of Ceará. The eastern coast is located in the sub-region of coastal Aracati and lower Jaguaribe river valley, of the eastern portion of the state (TAHIM; ARAÚJO JUNIOR, 2014).
In lower Jaguaribe river valley, 32 marine shrimp farms were constructed, between 2000 and 2003, to produce the Litopenaeus vannamei (gray shrimp) (LEITÃO et al., 2011). This particular species is well adapted to hydrographic regions of low salinity (between 0.5 to 28.5mg/L) (MIRANDA et al., 2010) and is widely accepted in American, Asian, European and Brazilian markets.
After the initial rapid expansion of new production areas, development of commercial shrimp farms reached a plateau that allowed the remaining producers to establish themselves in the market. In 2011, 55 farms were located in the region near the municipalities of Russas, Quixeré, Jaguaruana, and Itaiçaba (LEITÃO et al., 2011). Producers encountered new challenges in this phase, such as increasing production while maintaining quality, searching for proitable markets, meeting the requirements of operating permits, preparing reports on the environmental impact, and paying for water use.
Despite commercial shrimp farming being new and polemic in Brazil, particularly in semi-arid regions, the activity has reached socio-economic importance over the last two decades. In 2013, Ceará produced 33,949.8 tons of shrimp, resulting in R$ 395.2 million of revenue, representing 3.74% of the state GDP in 2013 (IBGE, 2013). The activity generated 2,569 jobs, equivalent to 0.6 jobs per hectare of production.
Despite the adequate quantity of studies on shrimp farming, studies centered on the establishment of water tariffs for this activity were not found in scientiic journals. On the other hand, studies related to irrigation can be found (VEETTIL et al., 2011; VEETTIL; SPEELMAN; VAN HUYLENBROECK, 2013).
To set up the water tariff for a certain water use is not trivial, once it encompasses technical, political and cultural aspects. The tariff should be elevated, in a manner to promote the rational use of water, but should also remain at a rate that does not compromise the development of production activities. Despite of the economic importance of shrimp farming to Ceará State economy, this activity is composed mostly of micro and small producers. They are mostly family or community based (ROCHA, 2006), which are more susceptible to tariff values than large commercial shrimp farms.
It was observed that, for the study period (2003-2016), the water tariff for shrimp farming varied from R$ 31.20/1,000 m3 to R$ 1.50/1,000 m3. The huge disparity between these values applied in Ceará, demonstrates a lack of objective parameters to establish these water tariffs.
To address the lack of standardization, conceptual elements were discussed and a methodology was developed to ix the tariff on the use of water for shrimp farming. The elements and the methodology incorporated the production costs and the ability to pay, and provided attraction to the development of shrimp farming.
WATER CHARGING
The second half of the twentieth century was marked by accelerated growth in the demand for water and ultimately the search for new management strategies related to water use. In 1964, France launched new water policies based on six fundamental principles. In relation to the water charging, the principle mobilizes inancial resources speciically for water. The French model has earned global recognition and has inluenced actions on water resources, later adapted by Brazil (CAMPOS; STUDART, 2003).
The new Brazil Water Act was instituted by the Federal Law 9.433/97 (BRASIL, 1997) and was created to recognize water as a limited resource. Water resources play an important role in economic and social development, is experiencing rising costs, and it is, thus, considered an economic good of expressive value. The Federal Law 9.433/97 elaborates that the charging water is essential for the conservation and rational use. Furthermore, the charging is a viable instrument to gather inancial resources to aid the water resources management.
In Brazil, some state water laws were created before the Federal Law. São Paulo was the irst state to approve its water law (SÃO PAULO, 1991), followed by Ceará (1992).
The establishment of the water tariff
to develop more eficient practices (SINGH, 2007; CAMPOS; STUDART, 2000).
According to economic theory, the price increase of good results in a consumption reduction of this good. Dinar and Subramanian (1997) and Rivers and Groves (2013) demonstrated the effectiveness of taxing the water for various uses. Several studies, however, indicate that the desired gains are not always achieved, especially on irrigation, due to the low elasticity of demand in this sector (MAMITIMIN et al., 2014). Many studies describe collateral effects such as a decrease in agricultural income and labor demand in rural areas (FRIJA et al., 2011). This proves that although much progress has been made in studies of water charging, there is still no understanding of the impacts, in particular, can be expected (PÉREZ-BLANCO; DELACAMARA; GOMEZ, 2015).
A variety of methods exists to estimate the value of the water and establish a tariff. According to Damásio et al. (2003), the trial and error method is the most used to establish the tariff for a certain use of the water. The authors emphasize that there are signiicant differences between economic activities, and an inadequate tariff value may lead to negative externalities on a portion of users who can be inancially impaired.
Rolim (2013) afirms that the capacity to pay is important to consider in the establishment of the tariff for a determined use. The cost of water and the other factors intrinsic to the activity in question must be considered, such as the exploited product, the market and the agronomic, economic, social and environmental variables. Studies on the establishment of the water tariff to irrigation based on the ability to pay and cost recovery have been carried out by Chifamba, Nyanga and Gukurume (2013) and Giraldo, Cortignani and Dono (2014).
Pereira (2003) also defends the capacity to pay as a benchmark element for the water tariff, and conditions the tax to the inancial and economic impact on the sector. From the inancial point of view, the author defends that the user should be veriied for the means to pay for the water with the income received from the production. From the perspective of the economy, the activity must be veriied to remain attractive with the new costs. The author also defends that the costs of the water use should not exceed 0.5% of the production cost.
Water tariffs for shrimp farming in Ceará
Ceará was the irst state to effectively charge for the use of raw water. In 1996, the State Council of Water Resources (CONERH) delegated authority to the Water Resources Management Company (COGERH) to carry out the tax on raw waters.
The tax model in Ceará is based on the marginal cost of managing water resources and on the capacity to pay from each category of users, involving a component referent to the consumption (tariff of consumption) and other equivalent to the assumed demand (tariff of demand). Due to a greater understanding and acceptance from the users, the tax was implemented assuming tariffs are only based on the water consumed (tariff of consumption) (FINKLER et al., 2015).
Since the implementation of the water charging in the state, the values for all of the sectors affected have been determined by COGERH through negotiation with the government agencies involved, with the commissions of consumers, and with the water basin committees.
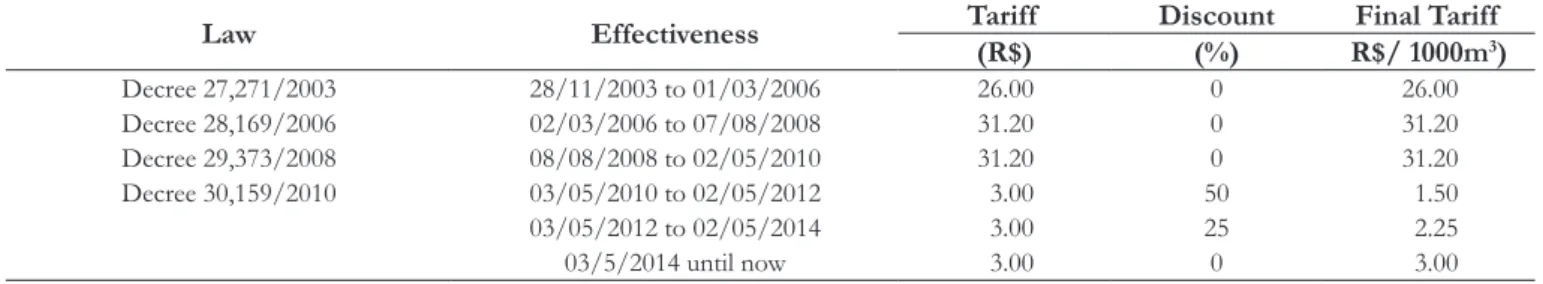
In 2003, Ceará started charging the water use for the shrimp farming industry, using values applied to ish farming. Initially, the tariff was R$ 26.00/1,000m3. In 2006, the tariff was raised to R$ 31.20/1,000m3. The value was signiicantly reduced in 2010, to R$ 1.50/1.000m3 (with the discount of 50% provided in the decree 30.159/2010). In 2012, the tariff increased to R$ 2.25/1,000m3 (25% discount) and in 2014 to R$ 3.00/1.000m3 (no discount), which is also valid in 2016 (Table 1).
MATERIALS AND METHODS
Selected data
The lower Jaguaribe river valley has 55 farms, of which the vast majority of the shrimp farms use low salinity waters (from 0.5 to 0.6 ppt NaCl) (LEITÃO et al., 2011). A sample size of nine farms was selected, representative of the all of the farms in question. The average production costs were obtained from the analysis of the sampled farms.
Estimation of the production cost
The total production cost is formed by the sum of the ixed costs and variable costs.
- Fixed costs: Fixed costs of production were estimated from data taken in one of the farms analyzed. As the other farms have the same size with a total area of about 50ha and a pond area of 30ha, the ixed cost was assumed as representative of the sample. Fixed costs are basically a function of the areas of the farms. The ixed costs analyzed are from 2008, but are assumed to be representative of the current situation.
Table 1. Evolution of tariffs charged by raw water for inland shrimp farming in Ceará.
Law Effectiveness Tariff Discount Final Tariff
(R$) (%) R$/ 1000m3) Decree 27,271/2003 28/11/2003 to 01/03/2006 26.00 0 26.00 Decree 28,169/2006 02/03/2006 to 07/08/2008 31.20 0 31.20 Decree 29,373/2008 08/08/2008 to 02/05/2010 31.20 0 31.20 Decree 30,159/2010 03/05/2010 to 02/05/2012 3.00 50 1.50
03/05/2012 to 02/05/2014 3.00 25 2.25
- Variable costs: The variable costs depend on the stocking density and the average weight of the harvest. Higher average densities and harvest weights generate higher feed consumption. The average data of the nine farms were considered for this analysis, combining three different stocking densities (25 shrimp/m2, 35 shrimp/m2 and 50 shrimp/m2) with three different average weights of the harvested animals (7g, 9g and 12g).
The 12 month period was adopted to evaluate the inancial results, which is standard for inancial analyses in shrimp farming.
To calculate the opportunity cost, a portion of the ixed reinvestment of one-twelfth of the total operating cost was evaluated using a compound interest rate of 0.67% per month for one year. For the payment of the water use, a tariff of R$ 31.20/1.000m3 of water was used based on the current tariff set in 2008 and the maximum value veriied for the tariff between 2003 and 2016.
Volume of water used vs. volume of water consumed in aquaculture
To estimate the volumes of water used and consumed (consumptive use), the quantities of water taken from the river and the quantities returned to the water body after use were evaluated over a period of one year.
The volume of water effectively consumed, referring to evaporation and iniltration was adopted to determine the water balance. The volume used was considered as the water removed from the irrigation line to ill the ponds and to renovate the water, to maintain the water quality of the cultivation.
Quantity of the water used
To determine the amount of water needed for shrimp production based on the densities and the weights of the harvest analyzed, the following parameters were considered: the number of production cycles per year, the number of days per cycle, the daily renovation rate of the water, the volume to ill the ponds, the volume evaporated daily, and the volume iniltrated daily.
The daily iniltration and evaporation values of 1.0mm and 5.0mm were considered, respectively, based on the proximity to the values from the meteorological station of Fortaleza (Campus of Pici).
Cost of water in shrimp farming
An analysis of the feasibility of shrimp farming was carried out using the tariff of R$ 31.20/1,000m3 applied for the irst years of the activity (Decree No. 29.373/2008). Other tariff values established in 2010 were also analyzed.
Sensitivity study of the production cost in relation to the adopted water tariff
The value of the tariff was estimated from the production costs, including the cost of water. A sensitivity study was carried out using three different tariffs: R$ 1.00/1,000m3, R$ 1.50/1,000m3
and R$ 3.00 / 1,000m3 (values already adopted for irrigation). Each tariff value adopted was inserted in the variable costs and quantiied based on the percentage in relation to the total production cost.
Economic feasibility of shrimp farming for each adopted tariff
After the evaluation of the costs and of the sensitivity study, the economic feasibility of the activity as a function of the tariff adopted was analyzed
RESULTS AND DISCUSSION
Estimate of the production cost
The calculation of the standard ixed cost is shown in Table 2. The items of the ixed costs were accounted for in Brazilian reals (R$) per hectare per day. The linear method was used to calculate depreciation, considering the initial and residual values of the infrastructure, vehicles, machinery and equipment, as well as the useful life of each item.
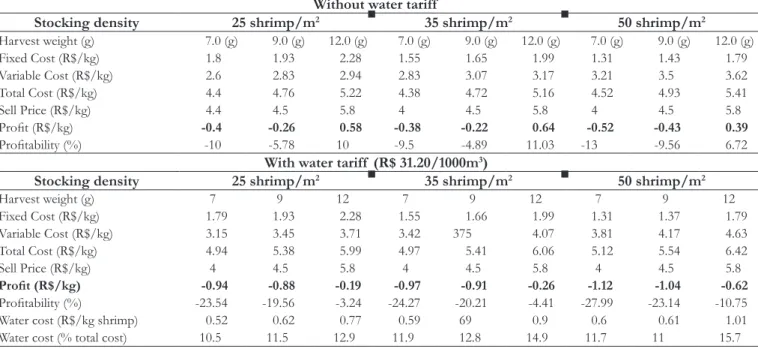
Table 3 shows the total cost for each scenario of stocking density vs. the weight of the harvest, selling price, proit and proitability. The impact of the water tariff on the production cost is also analyzed.
Initially, the only scenarios observed to generate proit were those that showed a harvest weight of 12 grams (R$ 0.58, R$ 0.64 and R$ 0.39/kg of shrimp). When adopting the tariff of R$ 31.20/1,000 m3, even this harvest weight becomes economically unfeasible.
Considering the tariff of R$ 31.20/1000m3 (practiced in Ceará in 2008), the cost of water would correspond to 10.5% to 15.7% of the total production cost of the analyzed scenarios, much higher than the costs suggested by Pereira (2003), which recommends that the water tariff should not exceed 0.5% of the production cost.
Water volume used vs. water volume effectively consumed in aquaculture
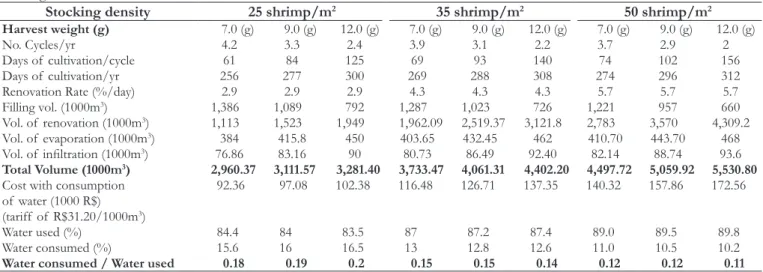
It is observed in Table 4 that the total volume of water used increases with the increase of stock density and weight of harvest yield, due to the increased volume of renovation of the ponds (volume to subsequently return to the water body). The volumes effectively consumed (evaporation and iniltration), however, are reduced with the increase of the density and weight of the harvest.
is no renovation of water; (5) the average rate of evaporation is 5 mm/day; (6) the average rate of iniltration is 1 mm/day; (7) the total volume refers to the sum of the illing volumes, renovation, evaporation and iniltration, and (8) a tariff of R$ 31.20/1000m3 was considered to calculate the cost of water.
Sensitivity study of the production cost in relation to the value of the adopted water tariff
The impact of the cost of water on the total cost of production is observed to increase with stocking density, given that more water is demanded (Table 5). The same occurs with the increase of the harvest weight.
The tariff of R$ 1.00/1,000m3 was observed to be the only tariff that results in a percentage close to that suggested by Pereira (2003), or, approximately 0.5%.
Economic feasibility of water taxation in shrimp farming
After the evaluation of the impact of the different tariffs in the total cost of the shrimp farming activity in the State of Ceará, it was carried out an evaluation of the proitability earned by the producers (Table 6). Is veriied, obviously, the reduction of the proitability in all scenarios analyzed, when compared to the null tariff.
Table 2. Fixed cost in the production of shrimp.
Component Unit Qty Unit Value
(R$/ha/day)
Total Value (R$/ha/day)
Labor R$18.82
Management unit 1 R$2.22 R$2.22
Administration unit 1 R$0.89 R$0.89
Accountant unit 1 R$0.84 R$0.84
Feeder unit 10 R$0.44 R$4.44
Tractor operator unit 1 R$0.56 R$0.56
Guard unit 2 R$0.55 R$1.10
Cook unit 1 R$0.42 R$0.42
Charges and Fees % 79.7 R$8.35
Energy Consumption unit 1 R$3.89
Telephone unit 1 R$0.61
Oils and fuels unit 1 R$0.5 R$0.50
Taxes
ITR 0.5% VTT R$625.00 R$0.06
ITR
Maintenance % 1.5aa R$0.36
Depreciation R$4.63
Other costs % 1.4 R$0.34
Total R$/ha/dia R$ R$29.15
Table 3. Total cost production, proit and proitability of shrimp farming for the stocking density (25, 35 and 50 shrimp/m2) and harvest weight (7, 9 and 12 g) without and with the water tariff (R$ 31.20/1,000m3).
Without water tariff
Stocking density 25 shrimp/m2 35 shrimp/m2 50 shrimp/m2 Harvest weight (g) 7.0 (g) 9.0 (g) 12.0 (g) 7.0 (g) 9.0 (g) 12.0 (g) 7.0 (g) 9.0 (g) 12.0 (g)
Fixed Cost (R$/kg) 1.8 1.93 2.28 1.55 1.65 1.99 1.31 1.43 1.79
Variable Cost (R$/kg) 2.6 2.83 2.94 2.83 3.07 3.17 3.21 3.5 3.62
Total Cost (R$/kg) 4.4 4.76 5.22 4.38 4.72 5.16 4.52 4.93 5.41
Sell Price (R$/kg) 4.4 4.5 5.8 4 4.5 5.8 4 4.5 5.8
Proit (R$/kg) -0.4 -0.26 0.58 -0.38 -0.22 0.64 -0.52 -0.43 0.39
Proitability (%) -10 -5.78 10 -9.5 -4.89 11.03 -13 -9.56 6.72
With water tariff (R$ 31.20/1000m3)
Stocking density 25 shrimp/m2 35 shrimp/m2 50 shrimp/m2
Harvest weight (g) 7 9 12 7 9 12 7 9 12
Fixed Cost (R$/kg) 1.79 1.93 2.28 1.55 1.66 1.99 1.31 1.37 1.79
Variable Cost (R$/kg) 3.15 3.45 3.71 3.42 375 4.07 3.81 4.17 4.63
Total Cost (R$/kg) 4.94 5.38 5.99 4.97 5.41 6.06 5.12 5.54 6.42
Sell Price (R$/kg) 4 4.5 5.8 4 4.5 5.8 4 4.5 5.8
Proit (R$/kg) -0.94 -0.88 -0.19 -0.97 -0.91 -0.26 -1.12 -1.04 -0.62
Proitability (%) -23.54 -19.56 -3.24 -24.27 -20.21 -4.41 -27.99 -23.14 -10.75
Water cost (R$/kg shrimp) 0.52 0.62 0.77 0.59 69 0.9 0.6 0.61 1.01
Economic feasibility, translated by the positive proit, was observed only from the average harvest weight of 12.0 g, among the three densities analyzed. No scenario was considered feasible with the tariff set at R$ 31.20/1,000m3.
CONCLUSIONS
Shrimp farming is still a very recent and polemic economic activity in Brazil, especially in regions with water shortages. Nevertheless, the activity was established in the State of Ceará,
and has assumed growing socio-economic importance in the last two decades.
In this article, a methodology of simple application was proposed to estimate the water tariff for shrimp farming in the State of Ceará, considering the producer capacity to pay. The water tariff suggested by Pereira (2003) remains as an objective, which recommends that the costs of the water should not exceed 0.5% of the production cost. Even though the methodology is applied to Ceará, it is not restricted to this State.
Table 4. Characteristics of the elements that form the costs of shrimp production, considering the different harvest weights and stocking densities.
Stocking density 25 shrimp/m2 35 shrimp/m2 50 shrimp/m2
Harvest weight (g) 7.0 (g) 9.0 (g) 12.0 (g) 7.0 (g) 9.0 (g) 12.0 (g) 7.0 (g) 9.0 (g) 12.0 (g)
No. Cycles/yr 4.2 3.3 2.4 3.9 3.1 2.2 3.7 2.9 2
Days of cultivation/cycle 61 84 125 69 93 140 74 102 156
Days of cultivation/yr 256 277 300 269 288 308 274 296 312
Renovation Rate (%/day) 2.9 2.9 2.9 4.3 4.3 4.3 5.7 5.7 5.7
Filling vol. (1000m3) 1,386 1,089 792 1,287 1,023 726 1,221 957 660
Vol. of renovation (1000m3) 1,113 1,523 1,949 1,962.09 2,519.37 3,121.8 2,783 3,570 4,309.2
Vol. of evaporation (1000m3) 384 415.8 450 403.65 432.45 462 410.70 443.70 468
Vol. of iniltration (1000m3) 76.86 83.16 90 80.73 86.49 92.40 82.14 88.74 93.6
Total Volume (1000m3) 2,960.37 3,111.57 3,281.40 3,733.47 4,061.31 4,402.20 4,497.72 5,059.92 5,530.80
Cost with consumption 92.36 97.08 102.38 116.48 126.71 137.35 140.32 157.86 172.56
of water (1000 R$) (tariff of R$31.20/1000m3)
Water used (%) 84.4 84 83.5 87 87.2 87.4 89.0 89.5 89.8
Water consumed (%) 15.6 16 16.5 13 12.8 12.6 11.0 10.5 10.2
Water consumed / Water used 0.18 0.19 0.2 0.15 0.15 0.14 0.12 0.12 0.11
Table 5. Representation of water cost in the cost of production considering the water tariff of R$ 1.00, R$1.50 and R$ 3.00 / 1000m3.
Stocking density Harvest weight (g) Water cost impact on production costs (R$/1,000 m 3)
R$ 1.00 R$ 1.50 R$ 3.00
25 shrimp/m2 7.0 0.38% 0.56% 1.12%
9.0 0.39% 0.59% 1.17%
12.0 0.45% 0.67% 1.33%
35 shrimp/m2 7.0 0.41% 0.62% 1.23%
9.0 0.44% 0.66% 1.32%
12.0 0.53% 0.79% 1.57%
50 shrimp/m2 7.0 0.41% 0.61% 1.21%
9.0 0.45% 0.67% 1.33%
12.0 0.57% 0.85% 1.69%
Table 6. Shrimp farming proitability with and without the collection of water, considering tariff $1.50/1,000m3 and R$1.00/1,000m3.
Stocking density Tariff (R$ 1.50/1000m
3)
25 shrimp/m2 35 shrimp/m2 50 shrimp/m2
Harvest weight (g) 7.0 (g) 9.0 (g) 12.0 (g) 7.0 (g) 9.0 (g) 12.0 (g) 7.0 (g) 9.0 (g) 12.0 (g)
Total cost (R$/kg) 4.43 4.80 5.26 4.41 4.76 5.21 4.55 4.87 5.46
Sell price (R$/kg) 4.00 4.50 5.80 4.00 4.50 5.80 4.00 4.50 5.80
Proit (R$/kg) -0.43 -0.30 0.54 -0.41 -0.26 0.59 -0.55 -0.37 0.34
Proitability (%) -10.75 -6.67 9.31 -10.25 -5.78 10.17 -13.75 -8.22 5.86
Stocking density Tariff (R$ 1.00/1000m
3)
25 shrimp/m2 35 shrimp/m2 50 shrimp/m2
Harvest weight (g) 7.0 (g) 9.0 (g) 12.0 (g) 7.0 (g) 9.0 (g) 12.0 (g) 7.0 (g) 9.0 (g) 12.0 (g)
Total cost (R$/kg) 4.42 4.79 5.25 4.40 4.75 5.19 4.54 4.86 5.45
Sell price (R$/kg) 4.00 4.50 5.80 4.00 4.50 5.80 4.00 4.50 5.80
Proit (R$/kg) -0.42 -0.29 0.55 -0.40 -0.25 0.61 -0.54 -0.36 0.35
Through the chronology of the water tariffs adopted for shrimp farming in the state, no reference value for the tariff was observed, resulted from the immense disparity between the practiced values. The water tariff on shrimp farming was initiated in 2008, with a value of R$ 31.20/1,000m3. After the high index of default in the sector, the state reduced the tariff value and established a policy of increasing tariffs, starting with R$ 1.50/1,000m3 (2010 to 2011), R$ 2.25/1,000m3 (2012 to 2013), and R$ 3.00/1,000m3 (in 2014), a value even higher than recommended by the study for the capacity to pay.
From the sample analyzed, the only tariff observed to make the sector inancially attractive is R$ 1.00/1,000m3. This value represents only 3% of the value initially practiced in Ceará in 2008 (R$ 31.20/1.000m3).
The incoherence and the inconsistencies in the policy for charging water on shrimp farming detected in this study are indicators of the importance of establishing a technical based methodology to set the values of the tariff.
REFERENCES
ABCC – ASSOCIAÇÃO BRASILEIRA DE CRIADORES DE CAMARÃO. Levantamento da infraestrutura produtiva e dos aspectos tecnológicos, econômicos, Sociais e ambientais da carcinicultura marinha no Brasil em 2011. Natal, 2013. 82 p.
ABREU, M. C. S.; MATTOS, P.; LIMA, P. E. S.; PADULA, A. D. Shrimp farming in coastal Brazil: reasons for market failure and sustainability challenges. Ocean and Coastal Management, v. 54, n. 9, p. 658-667, 2011. http://dx.doi.org/10.1016/j.ocecoaman.2011.06.012.
BRASIL. Lei nº 9.433 de 8 de janeiro de 1997. Institui a Política Nacional de Recursos Hídricos, cria o Sistema Nacional de Gerenciamento de Recursos Hídricos, regulamenta o inciso XIX do art. 21 da Constituição Federal, e altera o art. 1º da Lei nº 8.001, de 13 de março de 1990, que modificou a Lei nº 7.990, de 28 de dezembro de 1989. Diário Oficial da União, Brasília, DF, 8 jan. 1997.
CAMPOS, J. N. B.; STUDART, T. M. C. Historical perspective on the administration of water in Brazil. Water International Carbondale, v. 25, n. 1, p. 148-156, 2000. http://dx.doi.org/10.1080/02508060008686806.
CAMPOS, J. N. B.; STUDART, T. M. C. (Ed.). Gestão das águas: princípios e práticas. 2nd ed. Porto Alegre: ABRH, 2003.
CEARÁ. Lei nº 11.996 de 24 de julho de 1992. Dispõe sobre a Política Estadual de Recursos Hídricos, institui o Sistema Integrado de Gestão de Recursos Hídricos – SIGERH e dá outras providências. Diário Oficial do Estado, Ceará, CE, 29 jul. 1992.
CHIFAMBA, E.; NYANGA, T.; GUKURUME, S. Irrigation water pricing and cost recuperation for sustainability of irrigation projects in Nyanyadzi, Zimbabwe. Russian Journal of Agricultural and Socio-Economic Sciences, v. 15, n. 3, p. 39-53, 2013. http://dx.doi. org/10.18551/rjoas.2013-03.07.
DAMÁSIO, J.; CARRERA-FERNANDEZ, J.; GARRIDO, R. J.; SILVEIRA, A. H. P. Impactos da cobrança pelo uso da água:
uma metodologia de avaliação. Bahia Análise & Dados, v. 13, p. 497-513, 2003.
DINAR, A.; SUBRAMANIAN, A. Water Pricing Experiences: an International Perspective. Washington: The World Bank, 1997. 178 p. Report No. WTP386.
FAO – FOOD AND AGRICULTURE ORGANIZATION OF THE UNITED NATIONS. Global Aquaculture Production. Fisheries and Aquaculture Information and Statistics Service: 1950-2011. Rome, 2013. Available from: <http://www.fao.org/ statis>. Access on: 3 may 2015.
FINKLER, N. R.; MENDES, L. A.; BORTOLIN, T. A.; SCHNEIDER, V. E. Cobrança pelo uso da água no Brasil: uma revisão metodológica. Desenvolvimento e Meio Ambiente, v. 33, p. 33-49, 2015. http://dx.doi.org/10.5380/dma.v33i0.36413.
FRIJA, A.; WOSSINK, A.; BUYSSE, J.; SPEELMAN, S.; VAN HUYLENBROECK, G. Irrigation pricing policies and its impact on agricultural inputs demand in Tunisia: a DEA-based methodology. Journal of Environmental Management, v. 92, n. 9, p. 2109-2118, 2011. http://dx.doi.org/10.1016/j.jenvman.2011.03.013. PMid:21524839.
GIRALDO, L.; CORTIGNANI, R.; DONO, G. Simulating volumetric pricing for irrigation water operational cost recovery under complete and perfect information. Water, v. 6, n. 5, p. 1204-1220, 2014. http://dx.doi.org/10.3390/w6051204.
IBGE – INSTITUTO BRASILEIRO DE GEOGRAFIA E ESTATÍSTICA. Produção da pecuária municipal 2013. Brasília, 2013. 108 p. (v. 41).
LEITÃO, R. C.; CAVALCANTE, R. R. R.; RIBEIRO, E. M.; CLAUDINO, R. L.; MACIEL, N. M.; ROSA, M. F. Reúso da água da despesca na produção de camarão. Revista Brasileira de Engenharia Agrícola e Ambiental, v. 15, n. 12, p. 1314-1320, 2011. http://dx.doi.org/10.1590/S1415-43662011001200014.
MAMITIMIN, Y.; FEIKE, T.; SEIFERT, I.; DOLUSCHITZ, R. Irrigation in the Tarim Basin, China: farmers’ response to changes in water pricing practices. Agricultural Water Management, v. 145, p. 92-97, 2014.
MIRANDA, F. R.; CAVALVANTE, R. R. R.; RIBEIRO, E. M.; LIMA, R. N. Uso de efluentes da carcinicultura na irrigação de Panicum maximum cvs. Tanzânia e Mombaça. Revista Ciência Agronômica, v. 41, p. 46-52, 2010.
PEREIRA, D. Governabilidade dos recursos hídricos no Brasil: a implementação dos instrumentos de gestão na Bacia do Rio Paraíba do Sul. Brasília: ANA, 2003.
RIVERS, N.; GROVES, S. The welfare impact of self-supplied water pricing in Canada: a computable general equilibrium assessment. Environmental and Resource Economics, v. 55, n. 3, p. 419-445, 2013. http://dx.doi.org/10.1007/s10640-013-9633-3.
ROCHA, I. Impactos socioeconômicos e ambientais da carcinicultura brasileira: mitos e verdades. Revista Associação Brasileira de Criadores de Camarão, v. 7, n. 4, p. 29-36, 2006.
ROLIM, H. S. C. Modelos tarifários e propostas para a cobrança dos recursos hídricos do Estado do Ceará. Revista Científica Intermeio, v. 1, n. 1, p. 54-79, 2013.
SÃO PAULO. Lei nº 7.663 de 30 de dezembro de 1991. Estabelece normas de orientação à Política Estadual de Recursos Hídricos bem como ao Sistema Integrado de Gerenciamento de Recursos Hídricos. Assessoria Técnico-Legislativa, São Paulo, SP, 30 dez. 1991.
SINGH, K. Rational pricing of water as an instrument of improving water use efficiency in the agricultural sector: a case study in Gujarat, India. International Journal of Water Resources Development, v. 23, n. 4, p. 679-690, 2007. http://dx.doi.org/10.1080/07900620701488604.
TAHIM, E. F.; ARAÚJO JUNIOR, I. F. A carcinicultura do Nordeste Brasileiro e sua inserção em cadeias globais de produção: foco nos APLs do Ceará. Revista de Economia e Sociologia Rural, v. 52, n. 3, p. 567-586, 2014. http://dx.doi.org/10.1590/S0103-20032014000300009.
VEETTIL, P. C.; SPEELMAN, S.; FRIJA, A.; BUYSSE, J.; VAN HUYLENBROECK, G. Complementarity between water pricing, water rights and local water governance: a Bayesian analysis of choice behavior of farmers in the Krishna river basin, India.
Ecological Economics, v. 70, n. 10, p. 1756-1766, 2011. http://dx.do i.org/10.1016/j.ecolecon.2011.04.018.
VEETTIL, P. C.; SPEELMAN, S.; VAN HUYLENBROECK, G. Estimating the impact of water pricing on water use efficiency in semi-arid cropping system: an application of probabilistically constrained nonparametric efficiency analysis. Water Resources Management, v. 27, n. 1, p. 55-73, 2013. http://dx.doi.org/10.1007/ s11269-012-0155-5.
Authors contributions
Lorena Soares Monteiro: Research design, data analysis, data discussion and article writing.
David Araujo Borges: Professor, helped in the article design, colletion and processing of data, and review of the article translation into English.
Ticiana Marinho de Carvalho Studart: Professor contributed to the appropriateness of the methodology used, with the discussion of the results, reviewing the article format and the writing in Portuguese and English.
José Nilson Bezerra Campos: Professor, contributed to the discussion of the results and inal review of the text in both Portuguese and English.