UNIVERSIDADE FEDERAL DO CEARÁ CENTRO DE CIÊNCIAS
DEPARTAMENTO DE COMPUTAÇÃO
CURSO DE GRADUAÇÃO EM CIÊNCIA DA COMPUTAÇÃO
LUCAS PERES GASPAR
PROGRAMMING MODELS TO DISTRIBUTED GRAPHS
LUCAS PERES GASPAR
PROGRAMMING MODELS TO DISTRIBUTED GRAPHS
Trabalho de Conclusão de Curso apresentado ao Curso de Graduação em Ciência da Computação do Centro de Ciências da Universidade Federal do Ceará, como requisito parcial à obtenção do grau de bacharel em Ciência da Computação. Orientador: Prof. Dr. Jose Antonio Fer-nandes de Macedo
Dados Internacionais de Catalogação na Publicação Universidade Federal do Ceará
Biblioteca Universitária
Gerada automaticamente pelo módulo Catalog, mediante os dados fornecidos pelo(a) autor(a)
G232p Gaspar, Lucas Peres.
Programming models to distributed graphs / Lucas Peres Gaspar. – 2017. 42 f. : il. color.
Trabalho de Conclusão de Curso (graduação) – Universidade Federal do Ceará, Centro de Ciências, Curso de Computação, Fortaleza, 2017.
Orientação: Prof. Dr. José Antônio Fernandes de Macêdo.
1. Large graphs. 2. Distributed system. 3. Programming models. I. Título.
LUCAS PERES GASPAR
PROGRAMMING MODELS TO DISTRIBUTED GRAPHS
Trabalho de Conclusão de Curso apresentado ao Curso de Graduação em Ciência da Computação do Centro de Ciências da Universidade Federal do Ceará, como requisito parcial à obtenção do grau de bacharel em Ciência da Computação.
Aprovada em:
BANCA EXAMINADORA
Prof. Dr. Jose Antonio Fernandes de Macedo (Orientador)
Universidade Federal do Ceará (UFC)
Prof. Regis Pires Magalhães Universidade Federal do Ceará (UFC)
Prof. Dr. Sabeur Aridhi University of Lorraine (UL)
Prof. Dr. Engelbert Mephu Nguifo
AGRADECIMENTOS
Primeiramente agradeço à Deus por toda esta jornada.
Ao Prof. Dr. José Antônio Fernandes de Macedo por me orientar neste início de jornada acadêmica.
Aos meus pais, que sempre me apoiaram nas escolhas da vida. Em particular minha mãe, que sempre mostrou que devemos buscar mais conhecimento e sempre continuar com os estudos.
Aos meus colegas do Insight Data Science Lab, por terem me auxiliado em minhas pesquisas, principalmente ao Prof. Regis Pires Magalhãs e David Araújo Abreu, que me motivam e auxiliam a ampliar meus conhecimentos, tanto na ciência quanto na vida.
Ao Departamento de Computação e seu corpo docente, por terem me proporcionado 4 anos de muita experiência e aprendizado.
Aos meus colegas do PET Computação UFC e da graduação, que sempre acreditaram em mim como cientista.
“Always pass on what you have learned.” (Master Yoda(Frank Oz), inStar Wars Episode
RESUMO
Processamento de grafos em larga escala é vital para muitas aplicações científica, e esse pro-cessamento está entre os sete principais métodos de análise de dados massivos. Embora alguns frameworks facilitem o desenvolvimento de processamento de grafos paralelo e distribuído, existe uma necessidade para um entendimento mais profundo de seu modelo conceitual. Este trabalho revisa alguns dos mmais conhecidos modelos de programação e detalha seu funcio-namento e suas características. Além disso, nós também apresentamos frameworks baseados nesses modelos. Também realizamos comparações entre os modelos, a fim de mostrar pontos fortes e fracos para que possamos decidir quando e como usar tais modelos.
ABSTRACT
Large-scale graph processing is vital for many scientific applications, and graph processing is among the seven principal computational methods of massive data analysis. Although some frameworks facilitate the development of parallel and distributed graph processing, there is a need for in-depth understanding of their conceptual model. This work reviews some of the well-known programming models and details how they work, their main features. Besides, we also present frameworks that are based on these models. We also make a comparison among them, to show its pros and cons so that we can decide when and how to use those models.
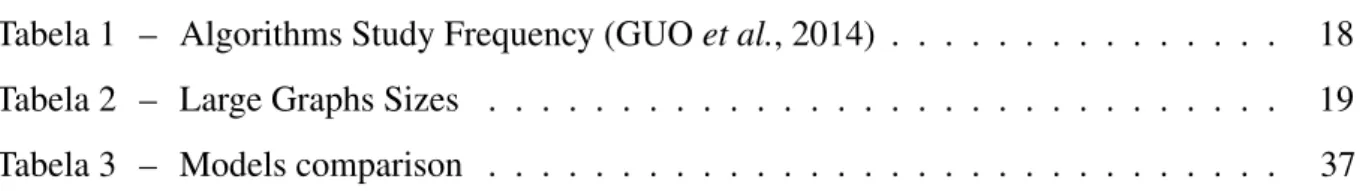
LIST OF FIGURES
Figura 1 – Undirected graph example . . . 16
Figura 2 – Directed graph example . . . 17
Figura 3 – Directed graph example . . . 17
Figura 4 – BSP Higher Value Vertex Example . . . 22
Figura 5 – BSP Superstep Workflow . . . 23
Figura 6 – Undirected Graph with 2 triangles . . . 25
Figura 7 – GAS Higher Value Vertex Example . . . 29
LIST OF TABLES
LIST OF ALGORITHMS
1 Bulk Synchronous Parallel (BSP) Vertex Interface . . . 23
2 BSP Triangle Count . . . 25
3 GAS Vertex Interface . . . 29
LISTA DE ABREVIATURAS E SIGLAS
BSP Bulk Synchronous Parallel GAS Gather, Apply, Scatter
GPS Graph Processing System
SUMÁRIO
1 INTRODUCTION . . . 15
2 THEORETICAL FOUNDATION . . . 16
2.1 Graphs. . . 16
2.2 Graph’s Algorithms . . . 17
2.3 Large Graph Processing . . . 18
2.4 Large Graph Processing Frameworks . . . 19
2.5 Programming Models for Distributed Graph Processing . . . 19
2.6 Conclusion . . . 20
3 BULK SYNCHRONOUS PARALLEL (BSP) . . . 21
3.1 Introduction . . . 21
3.2 BSP Model . . . 22
3.3 Primitive Functions. . . 24
3.4 Code example . . . 25
3.5 Execution Cost . . . 26
3.6 Frameworks . . . 26
3.7 Conclusion . . . 27
4 GATHER, APPLY, SCATTER (GAS) . . . 28
4.1 Introduction . . . 28
4.2 GAS Model . . . 28
4.3 Primitive Functions. . . 30
4.4 Code example . . . 31
4.5 Execution Cost . . . 31
4.6 Frameworks . . . 32
4.7 Conclusion . . . 32
5 OTHER MODELS . . . 33
5.1 Introduction . . . 33
5.2 Map/Reduce. . . 33
5.3 Functional Programming . . . 34
5.4 Actor. . . 35
6 MODEL COMPARISONS . . . 37
6.1 Introduction . . . 37
6.2 Criteria . . . 37
6.3 Analysis of models . . . 38
6.4 Conclusion . . . 39
7 CONCLUSIONS AND FUTURE WORKS . . . 40
15
1 INTRODUCTION
Thanks to the popularity of technologies and the Internet, we are handling with datasets bigger than ever. This phenomenon causes unprecedented challenges concerning data processing. The situation is not different when dealing with graphs datasets. (JORDAN, 2013) says that graph processing is among the seven principal computational methods of massive data analysis. Graphs can be used in several scenarios, like analytic, business, social networks, etc.
To deal with the large-graphs context, we have tools to manipulate them. There are a lot of frameworks that allow constructing algorithms to be applied to those graphs, but to use them we must know how they work. Before studying the frameworks, we should understand the programming models used to develop them.
The goal of this work is to describe some of those models, presenting how they work, exemplifying their functionalities, showing which components we can use to construct a distributed system with those models and showing frameworks that implement them and make some comparisons among them, allowing us to understand better how those models works and help us choose a good model to solve some problem on some giving scenarios.
16
2 THEORETICAL FOUNDATION
This chapter presents the core concepts used in this work.We start presenting the definition of a graph and its types. A graph is an abstract structure, and it can be used to represent many things, like roads, decision problems, production lines, street maps, network communications, social relations, and others. Sometimes, representing a problem in a graph structure can help its resolution, since there are several theorems and algorithms to extract information from graphs. this chapter also shows some types of graph algorithms that are used to retrieve information.
Sometimes we need to work with large-graphs, that cannot be stored in memory or may take a long time to apply some algorithms. The solution to that is to distribute the graph information, the processing, or both. This work also shows some concepts and challenges of processing large-graphs. We also present some frameworks that deal with them and even the programming models used by those graph frameworks.
2.1 Graphs
(BONDY; MURTY, 1982) brings traditional definition to a graph that is helpful to understand a lot of graph properties. In our context, we can define agraphas an ordered pair G=(V,E)composed by two sets: V, representing the set ofverticesand E representing theedges. Each element from E is a pair of two elements of V, representing a relation (edge) between them. Figure 1 ilustrates a graph whereV = {1,2,3,4} andE= {(1,2),(1,4),(2,4),(2,3)}. In this case, we have anUndirectedgraph, that is, the edges of the graph represent a symmetrical relation(the relation (1,2) is the same as (2,1)).
Figure 1 – Undirected graph example
17
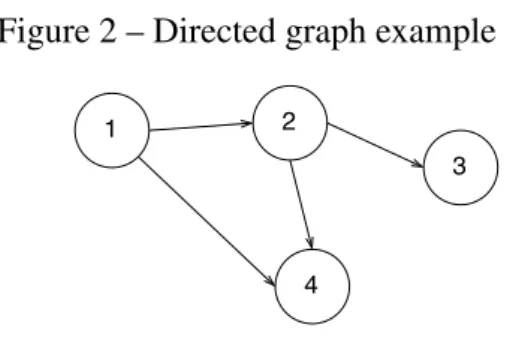
Figure 2 – Directed graph example
Suppose that one graph represents a road graph. Figure 1 says that we can go from 1 to 2 and from 2 to 1 using the same road, while Figure 2 says that we can only go from 1 to 2. But if we want to represent the distance between 1 and 2? A graph is calledweightedwhen its edges have weight, that is, a value to express the relation. Figure 3 shows a directed and weighted graph where the distance(or cost) to go from 1 to 2 has the value of 2.
Figure 3 – Directed graph example
2.2 Graph’s Algorithms
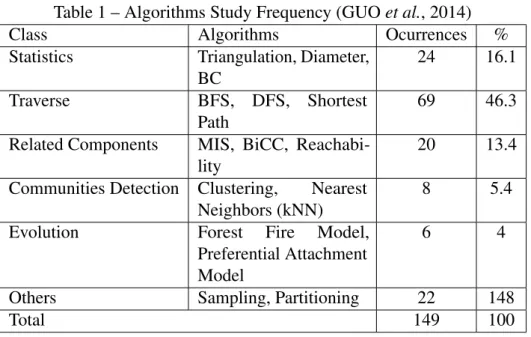
(HARAet al., 2015) present a review of 124 papers and has classified 149 algorithms to analyze the studied frequency of those algorithms. Table 1 represents the resume of this analysis. They are classified into the following categories:
• Statistics: these algorithms computes values from the graph relations, like the number of relations, more related vertices, groups of relations. Those are helpful to collect useful metrics to analyze the graph.
• Traverse: traverse algorithms are one of the most known(and used) types: they help in finding a path between two vertices of the graph.
• Related Components: some graphs have subsets of vertices and edges that are not related, that means, there is no path linking those subsets to the rest of the graph. Subgroups like those are called components, and these algorithms are used to find them.
18
They detect groups of vertices bounded by some characteristic.
• Evolution: the idea of this type of algorithm is to study thetopology of the graph to analyze how it can affect the evolution of the graph.
• Others: here we have some categories, likepartitioningalgorithms, that are used to divide the graph into subgraphs in a most optimized way (dividing the nodes, reducing the number of edges between two partitions, etc.) andsamplingalgorithms, that retrieve a subgraph that statistically represents a good sample of the graph(like keeping the mean degree of the vertices, the maximum shortest path, the centrality, etc.).
Table 1 – Algorithms Study Frequency (GUOet al., 2014)
Class Algorithms Ocurrences %
Statistics Triangulation, Diameter,
BC
24 16.1
Traverse BFS, DFS, Shortest
Path
69 46.3
Related Components MIS, BiCC,
Reachabi-lity
20 13.4
Communities Detection Clustering, Nearest Neighbors (kNN)
8 5.4
Evolution Forest Fire Model,
Preferential Attachment Model
6 4
Others Sampling, Partitioning 22 148
Total 149 100
2.3 Large Graph Processing
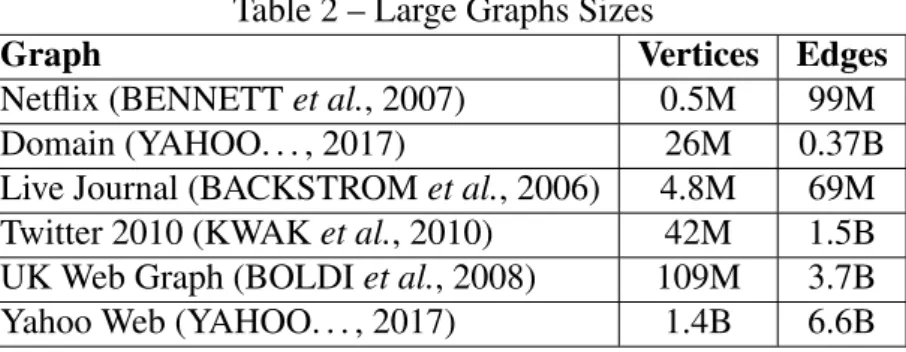
We can work with graphs of several sizes, form small graphs representing a family tree; to large graphs, like huge social networks. Such large-graphs require special techniques to be processed, since, to do so, we must use disk memory or distribute the processing. (KYROLA et al., 2012) presents a table with the size of large-graphs used in experimentation on their work, in 2012. Table 2 shows some of that information.
Nowadays, there are many techniques and frameworks to handle large datasets and to collect information from them, but, when related to graphs, they cannot be applied, because, in some scenarios, the computer can not store all the data or it would take much time to process it.
19
Table 2 – Large Graphs Sizes
Graph Vertices Edges
Netflix (BENNETTet al., 2007) 0.5M 99M
Domain (YAHOO. . . , 2017) 26M 0.37B
Live Journal (BACKSTROMet al., 2006) 4.8M 69M
Twitter 2010 (KWAKet al., 2010) 42M 1.5B
UK Web Graph (BOLDIet al., 2008) 109M 3.7B
Yahoo Web (YAHOO. . . , 2017) 1.4B 6.6B
2.4 Large Graph Processing Frameworks
Many frameworks allow the processing of large-graphs in a distributed environment. Each framework has its abstraction with its particularities, like the topology element used on the distribution( vertices, edges or subgraphs).
The most common topology used is the vertex(called vertex-centric), proposed first byPregel(MALEWICZet al., 2010), a Google framework. The scope of an algorithm defined on this framework is the vertex value and messages that are sent to it. This framework is also the basis for many others, where all of them try to optimize some feature or remove limitations.
(HEIDARIet al., 2017) and (REZENDE, 2017) compare some of those frameworks, presenting some criteria chosen by them and explaining how they work, the scenarios to use them and their programming models.
2.5 Programming Models for Distributed Graph Processing
Programming in a distributed system is not a simple task. Many challenges can be found in the way, like synchronization between the machines (ornodes), the information flow, etc. There are some patterns that are used to develop such systems. These patterns help to define an execution flow, information exchange, and architecture.
20
and Block-Centrick, where every computation happens over subgraphs(or blocks) of the whole graph.
In the vertex-centric context, there are two most used programming models: the BSP and GAS, which are going to be presented in chapters 3 and 4, respectively. These models are very used due to some frameworks success.
2.6 Conclusion
This chapter presented the definition of a graph, what are the types algorithms applied to them and its importance. We also discussed the problems to work with large graph datasets and presented two programming models to deal with those problems.
21
3 BULK SYNCHRONOUS PARALLEL (BSP)
3.1 Introduction
According to (VALIANT, 1990), in the 80’s the sequential computation has brought an efficient bridge between software and hardware, allowing the compilation and execution of high-level languages. But, to deal with parallel computation, was required a model that can allow this same simplicity. That is the BSP goal.
The BSP model first appeared in 1990s (VALIANT, 1990). It was proposed at Harvard University by Leslie Valiant to deal with distributed computing in several scenarios, allowing that operations could be easily programmed to execute in multiples machines.
When used in the context of graphs, BSP becomes a vertex-centric programming model, working with a sequence of iterations named superstep. A superstep consists of a set of independent local computations, followed by a global communication phase acting as a synchronization unit. Inside asuperstep, messages can be exchanged between vertices, passing information that will be computed on the nextsuperstep.
The basic workflow of an algorithm on the BSP model is as following: on the first superstep, each vertex execute itscomputefunction. After that, the vertex will becomeinactive. At the end of this execution, the vertex may (or not) send messages to all its neighbors. If so, the vertex that receive messages becomesactive. After the firstsuperstep, in each othersuperstep S, only theactivevertices execute their computations and they use the messages received on the superstep S-1.
To understand better the BSP workflow, assume the example in Figure 4. The idea of the example is to get the vertex with the higher value. It starts with every vertex sending its value to their neighbors. On the secondsuperstep, the vertices will process only the messages with a value higher than its own. That is what happens on the middle vertex: it receives 2 values that are higher than its, so it will update its value and send again messages, but now with value 5. On the thirdsuperstep, only the top and bottom vertices are going to be active, since only them have messages to process. The bottom vertex will update its value and send a message to the middle vertex. Then, on the lastsuperstep, the middle vertex will receive a message, but will not update its value. Since no message was sent, the execution stops.
22
Figure 4 – BSP Higher Value Vertex Example
that can improve the semantics of a program written on the model, based on the proposals of (SALIHOGLU; WIDOM, 2014). We also show frameworks that implement this model.
3.2 BSP Model
BSP is a vertex-centric model, so the main structure that we must analyze is the vertex. It computes a function in eachsuperstep, and it can(or can not) change its value and then it becomes inactive. In summary, the vertex is composed of the following components:
• Value: the value of the vertex itself on the graph. Let’s suppose the vertex represents a user on a social network. Its values can be id, name, username, etc.
• Mutable value: a value to the vertex that is used in the execution of an algorithm. This value is a result of the execution of some algorithm applied to the vertex, as the number of neighbors, for example.
• Compute function: a function that receives the messages and executes an algorithm on eachsuperstep. Usually, onecomputefunction is implemented for each algorithm.
• Halt function: function to set the vertex toinactivestate.
Algorithm 1 presents an interface to this vertex structure. First, we have the compute function used on thesupersteps. Then, we have a function to retrieve the vertex value from the model. After, we have functions to get and set the mutable value used on the algorithms. We also have a function to send messages to the neighbors and one to set the vertex state to inactive.
23
Algorithm 1BSP Vertex Interface public voidcompute(MessageList msgs); public ValuegetValue();
public voidsetMutableValue(MutableValue m); public MutableValuegetMutableValue(); public voidsendMessageTo(Message msg); public voidhalt();
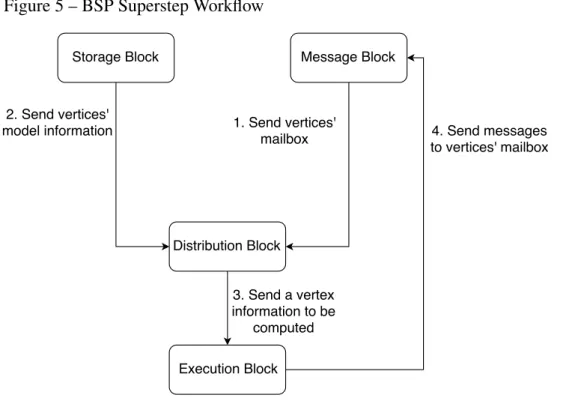
system, which are:
• Message Block: this block will be responsible for managing the message exchange among the vertices. It will store themailboxof each vertex, controlling the insertion and retrieval of messages.
• Storage Block: This block is responsible for storing the graph model. It gives access to information like vertex id and its values. It can also save themutable valuesdescribed before.
• Execution Block: It executes thecomputefunction of the vertex.
• Distribution Block: It coordinates the parallel execution of the algorithm, passing to the Execution Block its vertex information and the messages sent to it(we are going to call this set of messages asmailbox). This block works like thecontroller of the algorithm, and, therefore, it synchronizes the executions.
Figure 5 – BSP Superstep Workflow
24
graph that has messages on the mailbox (that means, it is active) the block will get the messages from the Message Block and the vertex data from the Storage Block and send them to the Execution Block. After that, the Execution Block takes this data and run thecomputefunction. If necessary, the block can send messages to other mailboxes of vertices in the Message Block. After all the active vertices have passed over the Execution Block and finished the computing, thesuperstepends.
This model structure uses the message trading, what let us change the number of computer nodes without concern with the access of the data, what makes the BSP model easily scalable.
3.3 Primitive Functions
Some applications may require an extense coding from the programmer. That happens because the expressiveness of the functions presented in Algorithm 1. They are the basic components of the model. The work on (SALIHOGLU; WIDOM, 2014) presents a set of primitive function to improve the algorithms semantics. From those functions, we can bring some of them to the BSP model:
Filter
This primitive is very simple: it applies some decision over each vertex and, if it returns a false value, the element will be removed from the model. This can be implemented with a call to thecomputefunction over each node but is easier to understand semantically, once you do not need to create a whole vertex structure just for this.
Update Value
25
Graph Value
The idea of this primitive is to gather some value over the graph, like the mean degree of the vertices. This primitive can be seen as asuperstepof a computation applied only over a single vertex.
3.4 Code example
We will present an abstract algorithm to Triangle Count on an undirected graph using the BSP model. Figure 5 shows an example of a graph with two triangles on its structure. Algorithm 2 shows the code of this algorithm.
Figure 6 – Undirected Graph with 2 triangles
Algorithm 2BSP Triangle Count 1: ifsuperstep≤1then
2: triangles←0
3: sendToNeighbors(neighbors) 4: else
5: formessageinmailboxdo
6: forvertexinmessage.data()do
7: ifvertexinneighborsthen
8: triangles←triangles+0.5 9: end if
10: end for 11: end for 12: end if 13: halt()
26
vertex will check the neighbors’ list in the messages, checking for familiar neighbors. If a common neighbor is found, thetrianglevalue will be incremented in 0.5 (the graph is undirected so that the same triangle will be computed twice). After that, each vertex will have the number of triangles in which it is.
3.5 Execution Cost
The cost of execution inside asuperstepin the BSP model can be represented as the sum of three factors:
• The cost of the longest running local computation, that is, the vertex that will take the longest time to execute;
• The higher number of messages that will be sent to a vertex plus the number of messages exchanged between the distribution block and each vertex (usually they are two: one to start the execution and another one to notify its end);
• The cost of the synchronization barrier at the end of thesuperstep.
Based on that, we can approximate the execution cost from an algorithm with S superstepsby the following formula, where:
∑Ss=1ws+g∑Ss=1hs+Sl
• Sis the number ofsupersteps;
• ws is the longest vertex execution onsuperstep s;
• grepresents the number of messages exchanged between the distribution and execution block;
• hs is the maximum number of messages sent from a vertex onsuperstep s.
• l is the cost of asuperstep
3.6 Frameworks
One of the most popular BSP implementation isPregel, from Google, and most of other BSP implementations follows its characteristics. Its API that allows the user to build his vertex implementation with itscomputefunction. The framework hasgenericclasses that allow computing store and send in the message any data.
27
• It allows the programmer to manipulate multiple vertices at the same time, where one vertex is themaster vertexthat can control the others.
• It optimizes the partitioning of the vertices among the nodes, allowing fewer messages to be exchanged among the machines.
• It can partition high-degree vertices over the nodes so that the computation of these vertices can also be parallelized.
3.7 Conclusion
This chapter describes features of the BSP model. We show a primary interface to its vertex, explaining it and an example of an algorithm using this model. We also show how can we have some primitive functions to improve the semantics of the model. Finally, we briefly show some frameworks that use this model.
28
4 GATHER, APPLY, SCATTER (GAS)
4.1 Introduction
The BSP model allows the creation of many frameworks to handle graphs in a distributed environment. The BSP requires that the information exchange occurs by message passing, and it can have a high cost. The GAS model addresses this problem.
GAS was initially presented in PowerGraph(GONZALEZ et al., 2012) in 2012. Gonzalez proposed this new programming model based on the frameworkGraphLab(LOWet al., 2012), that implements an alternative information exchanging to the BSP model.
The GAS model is an abstraction to BSP. The difference between them is how the computation occurs over the vertices in eachsuperstep. This execution can be divided into three steps:
• Gather: the vertex gathers the information of all its neighborhood through the edges, without the need to directly receive a message from some vertex.
• Apply: after gathering all the information needed, the vertex compute the data to update its mutable value.
• Scatter: in the end, the computed data is sent to the edges, allowing that other vertices can gather that information on the nextsuperstep.
To understand better the GAS workflow, we retake the example from the BSP model. Figure 7 shows this example. The only difference is that, on the firstsuperstep, the nodes already know the values of its neighbors. Then, the execution flows in the same way that on the BSP.
This chapter discusses the GAS model, following the same structure used in the last chapter. First, we present an abstract description of its vertex model and structure to the system. Then, we show some primitives to graph manipulation. For last, frameworks that implement this model.
4.2 GAS Model
29
Figure 7 – GAS Higher Value Vertex Example
the steps mentioned above. They are private because, on the execution, the compute function is the one that will be called and, inside it, those three functions are going to be used.
Algorithm 3GAS Vertex Interface private Updategather();
private Updateapply(); private voidscatter(); public voidcompute(); public ValuegetValue();
public voidsetMutableValue(MutableValue m); public MutableValuegetMutableValue(); public voidhalt();
Other difference on this model is that we have an Updatetype on the gather and scatter functions. This type is responsible for representing the changes of the vertices’ values over the graph. Messages on the BSP are an example of Update since they are responsible for carrying the information from the vertices.
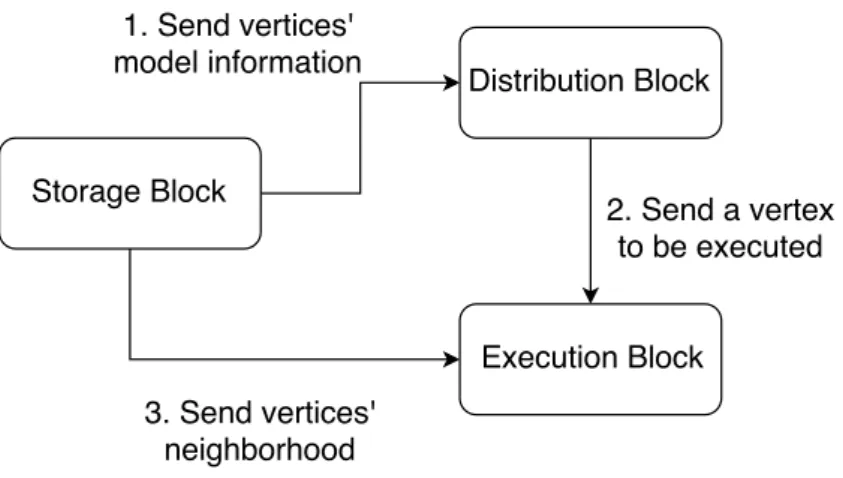
The GAS model abstracts the way that the information will flow over the graph. This allows information to be passed by a message, file serialization, direct communication, shared memory, etc. Therefore, the block architecture is more straightforward than the BSP one, allowing the Message Block removal from the requirements. Figure 8 presents this block architecture and the workflow of asuperstep.
30
Figure 8 – GAS Superstep Workflow
scatterfunctions.
Without the requirement to exchange messages, this model can become more efficient then BSP, since the information flow can be made inside a node, without the need to communicate with another, but it requires a more effort on programming since the optimization depends on the implementation of the information flow.
4.3 Primitive Functions
As presented in the last chapter, we can use some primitive function to improve the algorithm semantic on the GAS model. We can use the same 3 presented to BSP and add 2 more from those presented on (SALIHOGLU; WIDOM, 2014):
Collect Values
This primitive allows a vertex to collect information from its neighbors, like the gather function. So that, the vertex can group that information and store a new one inside it. This implementation can be made only using agatherand anapplyfunctions.
Aggregate Vertices
31
4.4 Code example
On Algorithm 4 implementsTriangle Countusing the GAS model. Different from BSP model, GAS allows this algorithm to run in just onesuperstep. That happens because the common neighbors checking can be done at the beginning of the algorithm since the vertex already have information about its neighborhood.
Algorithm 4GAS Triangle Count
1: forneighborsList inneighborhood do
2: forvertexinneighborsList do
3: ifvertexinneighborsthen
4: triangles←triangles+0.5 5: end if
6: end for 7: end for 8: halt()
The algorithm execution is almost the same from the Algorithm 2 but is not needed more than onesuperstep: for each neighbor oh the vertex(line 1), the vertex will check for a common neighbor between them (lines 2 and 3). If so, thetrianglesvalue is increased by 0.5(this value is because each triangle will be counted twice). After that, the vertex enters in the inactive state.
4.5 Execution Cost
The execution cost of asuperstepon the GAS model can be analyzed by the same BSP formula, but with some little changes. The formula and its variables are:
∑Ss=1ws+g∑Ss=1(hs+us) +Sl
• Sis the number ofsupersteps;
• ws is the longest vertex execution onsuperstep s;
• grepresents the number of messages exchanged between the distribution and execution block;
• hs is the maximum number of messages sent from a vertex onsuperstep s.
• us is the higher cost to update a neighborhood onsuperstep s
32
It is possible that, in asuperstep, a node sends messages to other nodes, to update the neighborhoods (it all depends on how it will be implemented). The cost to update the neighborhoods must be counted independently if is by message passing or not, that is whyus is used. That represents the higher cost to update the neighborhood.
4.6 Frameworks
GraphLab(LOW et al., 2012) in an open sourceimplementation of graphs with focus on to Data Science and Machine Learning. It has a shared memoryfeature that allows the vertices know its neighborhoods so that they can execute thegatherand thescatterphases. The implementation is a little more complex than thePregelone: it uses anUpdatestructure to represent the information of the neighborhood. The execution of its algorithms happens over that data and the vertex data.
Power Graph(GONZALEZet al., 2012) is a framework that combines the best of PregelandGraphLab, since they can have bad performances on high-degree vertices. It is the first framework to use the GAS officially model to factor the vertices programs over the edges, using theshared memoryapproach fromGraphLaband the commutative and associative gather concept fromPregel. In other words, the information collected from the neighborhood can be gathered in any order.
4.7 Conclusion
In this chapter we described the GAS model, presenting its vertex structure, system organization, an algorithm execution, primitive functions and frameworks that use this model.
33
5 OTHER MODELS
5.1 Introduction
There are some programming models very popular to deal with large datasets on the big data scenario, without the need to be a graph dataset. Since those models and its frameworks’ are very used, some frameworks were developed over them to handle large-graphs.
(WUet al., 2017) describes a set of programming models that are used in theBig Datascenario. It describes each model and makes comparison among them and their frameworks.
On this chapter, we briefly present theMapReduce,Functional Programmingand Actormodels, explaining how their work, how can we use them in graph context and present frameworks to them.
5.2 Map/Reduce
MapReduce is a Tuple Centric model proposed by Jeffrey Dean, from Google, on 2008(DEAN; GHEMAWAT, 2008). This model works dividing the function into two major categories:
• Map, where some computation is applied to each data unit. This computation returns an object containing, at least, one key and one value. This key represents the category of the resultant information.
• Reduce combines all the data with the same key, applying a function defined by the programmer. After mapping the data, the ones with the same key are grouped and condensed into one major information. The result or the reduce is a set of data, one for each unique key on the map stage.
A very common example of theMapReducemodel is the word count. Assume that you want to count the number of occurrences of a word in a text. UsingMapReduce, you could map the phrases, counting the number of times that a word appears, and them reduce it, for each word found, summing its occurrences.
34
is implemented, but with a computational cost. When using the vertex as the data unit, the algorithms became similar to the GAS model, but without thescatterphase.
Apache Hadoop(HADOOP, 2009) is the open-source implementation of Google’s MapReduceparadigm, mainly implemented in Java. It has amapand areduceinterface so that programmers can implement their functions in order to process the data. FromHadoopwe have Pegasus(KANGet al., 2009): a graph mining framework that can handle graphs withbillions of nodes and edges. It is constructed over theHaddopenvironment and uses a matrix-vector generalization to execute the algorithms.
5.3 Functional Programming
Functional Programmingis a programming paradigm that has grown in the last years and is becoming very common in the programming languages. The importance of this paradigm was described since the 80’s on (HUGHES, 1989) and (HENDERSON, 1980). One advantage of this paradigm is that everything is a function. We can pass a function as values and generate ones according to some input values.
This paradigm is emerging as a programming model for this generation on big data systems, due to frameworks likeSpark(ZAHARIAet al., 2010). This framework was build over Hadoopenvironment and provides functional interfaces to data manipulation, that is stored on its built-in model called Resilient Distributed Datasets (RDD).Sparkwas created to solve some limitations to theMapReducemodel, giving a set of high-level function primitives.
When working with graphs, we can similarly use this model asMapReduce: we can define a topology element of the graph to represent the data unit and, over them, apply some function defined by the programmer. Here we also may not have a simple way to trade information between two data unities, so the data units should contain all the information that they need.
35
5.4 Actor
TheActor model is used for concurrent computation. It has a primitive computation unit called asactorwhich is responsible for reacting to events triggered by messages in different contexts. The following example presents a scenario to help explain this model:
"Suppose we have a family living in their home and the home need to be clean. The parents say the children to clean their respective bedrooms. When the kids finish cleaning their bedrooms, they can go out and play."
In this example, we have two kinds ofactors: parent and child. When the parents say to the child to clean the bedroom, that is a message sent from the parents to the child, where we can see the "clean the room"as the action that will be executed, and it will be executed concurrently by each child. The "respective bedroom"represents that each child actor will have its domain, that is, a set of data to handle. When the children finish their works, they send a message to inform that and, after, they can go out and play. That is an example of a workflow using theActormodel.
One framework that is widely used and uses this model isAkka(THURAU, 2012). Typesafe developed its first release in 2009 and, although it allows the implementation of other models, it focuses on the Actor model. Akkauses asynchronous messages to communicate theactors, so there is no synchronization primitive. Also, itsactorsobjects can run local and distributed, without the need to modify their logic.
To work with graphs, we can use theActormodel defining subgraphs to actors so that the operations are going to be executed inside each actor. This division allows that we can use this model to compose or create new programming models. For example, we can divide the graph into subgraphs, in each subgraph run a BSP algorithm and then apply areducefunction over it.
36
5.5 Conclusion
This chapter presented some big data programming models, explaining how they operate, its features and frameworks that implement them.
37
6 MODEL COMPARISONS
6.1 Introduction
To better understand all the models presented in this work and how they resemble and diverge, we compare those models following some of the criteria presented in (REZENDE, 2017), so that we can be able to, given a scenario, chose an adequate model to use.
On this chapter, we first define the criteria, and then we will analyze the models based on them.
6.2 Criteria
Each model has its workflow with similarities in some cases. Following we present six features that we use to compare the models.
• Partitioning Influence: the distribution of the information among the nodes can have a critical influence on the performance of the algorithms because that can imply in more messages to be exchanged, what increases the cost. So, we may have models that the partitioning has a high or a low influence on the performance.
• Computation Unit: the approach to the computation unit can be vertex-centric, edge-centric or block-edge-centric.
• Execution(EX): the execution can be synchronous(S), if there is a synchronization unit (like thesuperstepfrom the BSP) or asynchronous(A), otherwise.
• Mutability(M): it supports mutability if, during the execution of an algorithm, a new vertex, edge or a set of both is inserted, it will consider that without the need to restart the algorithm.
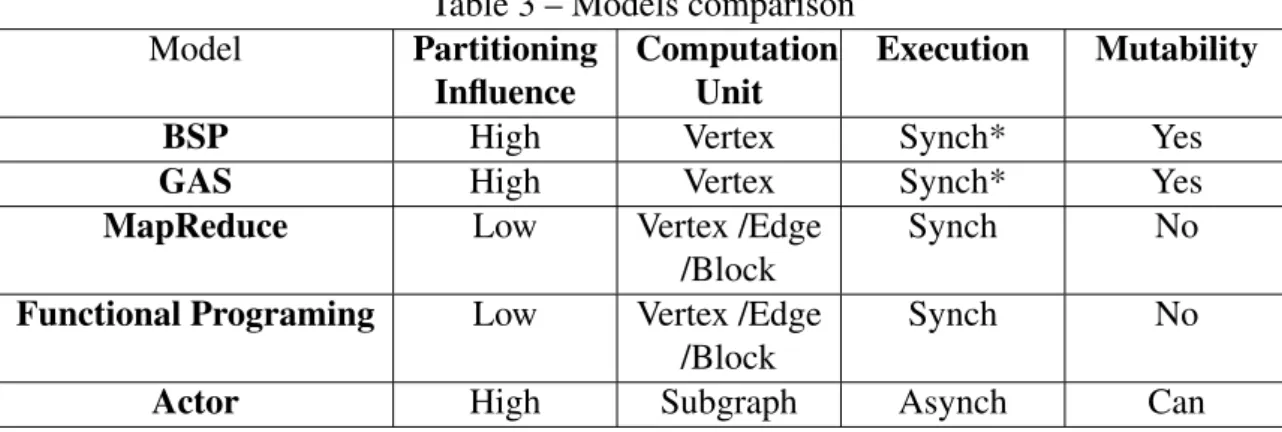
Table 3 – Models comparison
Model Partitioning
Influence
Computation Unit
Execution Mutability
BSP High Vertex Synch* Yes
GAS High Vertex Synch* Yes
MapReduce Low Vertex /Edge
/Block
Synch No
Functional Programing Low Vertex /Edge /Block
Synch No
38
6.3 Analysis of models
From Table 3 we report that the BSP and GAS are basically the same:
• The way that the vertices are distributed can imply on a significant information exchange over the nodes, increasing the cost of computation;
• Both are vertex-centric;
• They have thesuperstepas a synchronization unit. These models have some implementa-tions like (WANGet al., 2013), that make an asynchronous implementation of the BSP model to improve the convergence time of some algorithms and keep the simplicity and scalability. Also,Graphlab(LOWet al., 2012) allows the execution in asynchronous way; • If a change is made in the model, in the nextsuperstepit will be sensed by the nodes and
the new information will flow over the graph;
Based on that, if we have an environment with low cost to message exchange or the need to a keep changing the number of machines, the BSP and the GAS model can be very efficient. Otherwise, on scenarios with high message exchanging cost, those models may be costly.
About the MapReduce and Functional Programmingmodels we can see that the distribution of the information would not have a significant impact on the execution. That happens because we need to take the information of every node to retrieve a final result and they work with an abstract data unity, allowing to use vertex and subgraphs. Also, if any information is added to the graph model, all the functions may be applied again to capture the modification. This situation exemplifies why we have not many frameworks to handle distributed graphs using these models.
MapReduce and Functional Programming models can be helpful if we need to compute some simple metrics over a graph, without the need of a more coordinated algorithm(like a shortest path, for example), since they do not have any communication among the computations and the operations can be applied over the vertices in any order.
The Actormodel is the most different among the models presented here: it uses a subgraph as computation unit, it is asynchronous due to the events that are triggered by message passing and it can or not sense the mutability, that depends on how the application will be implemented.
39
the shortest path between two points in the same city in Europe, we do not need to access the information from South America. So, on this examples, we could have an actor responsible for each continent.
6.4 Conclusion
40
7 CONCLUSIONS AND FUTURE WORKS
This work presented some programming models for distributed graphs. We discussed how they work, explaining their workflow and structure, and introduced frameworks that use those models.
On the vertex-centric models, we presented BSP and GAS models. We discussed their features, explaining its workflow, how to structure a vertex on these models and wich components we may use to build a distributed system. We also show an algorithm to examplify these models and how to calculate its execution cost.
Some big data models were presented also. We briefly describedFunctional Pro-gramming,Map/ReduceandActor models, presenting frameworks that uses those models and how to use them on graphs context.
We also compare the models, presenting some details that can help to choose a model to implement an application and exemplifying some scenarios that each model can be helpful. This shows that there is no best model to work with distributed graphs. All of them have their particularities and are useful in some contexts.
41
REFERENCES
ARIDHI, S.; MONTRESOR, A.; VELEGRAKIS, Y. Bladyg: A novel block-centric framework for the analysis of large dynamic graphs. In: ACM.Proceedings of the ACM Workshop on High Performance Graph Processing. [S.l.], 2016. p. 39–42.
BACKSTROM, L.; HUTTENLOCHER, D.; KLEINBERG, J.; LAN, X. Group formation in large social networks: membership, growth, and evolution. In: ACM.Proceedings of the 12th ACM SIGKDD international conference on Knowledge discovery and data mining. [S.l.], 2006. p. 44–54.
BENNETT, J.; LANNING, S.et al.The netflix prize. In: NEW YORK, NY, USA.Proceedings of KDD cup and workshop. [S.l.], 2007. v. 2007, p. 35.
BOLDI, P.; SANTINI, M.; VIGNA, S. A large time-aware web graph. In: ACM.ACM SIGIR Forum. [S.l.], 2008. v. 42, n. 2, p. 33–38.
BONDY, J. A.; MURTY, U. S. R.GRAPH THEORY WITH APPLICATIONS. [S.l.: s.n.],
1982.
DEAN, J.; GHEMAWAT, S. Mapreduce: simplified data processing on large clusters. Communications of the ACM, ACM, v. 51, n. 1, p. 107–113, 2008.
GONZALEZ, J. E.; LOW, Y.; GU, H.; BICKSON, D.; GUESTRIN, C. Powergraph: Distributed graph-parallel computation on natural graphs. In: OSDI. [S.l.: s.n.], 2012. v. 12, n. 1, p. 2. GUO, Y.; VARBANESCU, A. L.; IOSUP, A.; MARTELLA, C.; WILLKE, T. L. Benchmarking graph-processing platforms: a vision. In: ACM. Proceedings of the 5th ACM/SPEC international conference on Performance engineering. [S.l.], 2014. p. 289–292.
HADOOP, A.Hadoop. 2009. <http://hadoop.apache.org/>. [Online; accessed 06-December-2017].
HARA, C. S.; PORTO, F.; OGASAWARA, E. Tópicos em gerenciamento de dados e informações 2015. 2015.
HEIDARI, S.; SIMMHAN, Y.; CALHEIROS, R. N.; BUYYA, R. Scalable graph processing frameworks: A taxonomy and open challenges. 2017.
HENDERSON, P. Functional programming: application and implementation. [S.l.]: Prentice-Hall, 1980.
HUGHES, J. Why functional programming matters.The computer journal, Oxford University Press, v. 32, n. 2, p. 98–107, 1989.
JORDAN, M. Committee on the analysis of massive data, committee on applied and theoretical statistics, board on mathematical sciences and their applications, division on engineering and physical sciences, council, nr, 2013. frontiers in massive data analysis.Frontiers in Massive Data Analysis, 2013.
42
KWAK, H.; LEE, C.; PARK, H.; MOON, S. What is twitter, a social network or a news media? In: ACM.Proceedings of the 19th international conference on World wide web. [S.l.], 2010. p. 591–600.
KYROLA, A.; BLELLOCH, G. E.; GUESTRIN, C. Graphchi: Large-scale graph computation on just a pc. In: USENIX. [S.l.], 2012.
LOW, Y.; BICKSON, D.; GONZALEZ, J.; GUESTRIN, C.; KYROLA, A.; HELLERSTEIN, J. M. Distributed graphlab: a framework for machine learning and data mining in the cloud. Proceedings of the VLDB Endowment, VLDB Endowment, v. 5, n. 8, p. 716–727, 2012. MALEWICZ, G.; AUSTERN, M. H.; BIK, A. J.; DEHNERT, J. C.; HORN, I.; LEISER, N.; CZAJKOWSKI, G. Pregel: a system for large-scale graph processing. In: ACM.Proceedings of the 2010 ACM SIGMOD International Conference on Management of data. [S.l.], 2010. p. 135–146.
REZENDE, C. A. d.A component-oriented framework for large-scale parallel processing of big graphs. Tese (Doutorado), 2017.
SALIHOGLU, S.; WIDOM, J. Gps: A graph processing system. In: ACM.Proceedings of the 25th International Conference on Scientific and Statistical Database Management. [S.l.], 2013. p. 22.
SALIHOGLU, S.; WIDOM, J. Help: High-level primitives for large-scale graph processing. In: ACM.Proceedings of Workshop on GRAph Data management Experiences and Systems. [S.l.], 2014. p. 1–6.
THURAU, M.Akka framework. 2012. <https://media.itm.uni-luebeck.de/teaching/ws2012/ sem-sse/martin-thurau-akka.io.pdf>. [Online; accessed 06-December-2017].
VALIANT, L. G. A bridging model for parallel computation.Communications of the ACM, ACM, v. 33, n. 8, p. 103–111, 1990.
WANG, G.; XIE, W.; DEMERS, A. J.; GEHRKE, J. Asynchronous large-scale graph processing made easy. In: CIDR. [S.l.: s.n.], 2013. v. 13, p. 3–6.
WU, D.; SAKR, S.; ZHU, L. Big data programming models. In: Handbook of Big Data Technologies. [S.l.]: Springer, 2017. p. 31–63.
XIN, R. S.; GONZALEZ, J. E.; FRANKLIN, M. J.; STOICA, I. Graphx: A resilient distributed graph system on spark. In: ACM.First International Workshop on Graph Data Management Experiences and Systems. [S.l.], 2013. p. 2.
YAHOO WebScope. 2017. <https://webscope.sandbox.yahoo.com/catalog.php?datatype=g>. Accessed: 2017-12-04.