Plasma mepivacaine concentrations in patients undergoing
third molar surgery
HC Scarparo,* RN Maia,†
EA dos Santos Filho,‡
ECS Soares,§
FWG Costa,¶
CSR Fonteles,**
TP Bezerra,††
TR Ribeiro,‡‡
NR Romero§§
*Associate Professor, Division of Clinical Pharmacology, Department of Clinical Dentistry, Federal University of Ceara, Ceara, Brazil. †Professor, Division of Oral and Maxillofacial Surgery, Oral and Maxillofacial Surgery Residency Program, Dr. Jose Frota Hospital Institute, Ceara, Brazil.
‡Pharmacist, Department of Pharmacy, Federal University of Ceara, Ceara, Brazil.
§Pharmacist, Division of Oral and Maxillofacial Surgery, Department of Clinical Dentistry, Federal University of Ceara, Ceara, Brazil. ¶Adjunct Professor, Division of Oral Radiology, Department of Clinical Dentistry, Federal University of Ceara, Ceara, Brazil.
**Associate Professor, Division of Orthodontics and Pediatric Dentistry, Department of Clinical Dentistry, Federal University of Ceara, Ceara, Brazil.
††Professor, Division of Oral and Maxillofacial Surgery, Oral and Maxillofacial Surgery Residency Program, Walter Cantıdio Universitary Hospital, Ceara, Brazil.
‡‡Adjunct Professor, Division of Orthodontics and Pediatric Dentistry, Department of Clinical Dentistry, Federal University of Ceara, Ceara, Brazil.
§§Associate Professor, Department of Pharmacy, Federal University of Ceara, Ceara, Brazil.
ABSTRACT
Background: Local anaesthetic-related systemic toxicity mainly results from elevated plasma concentrations of these drugs. We hypothesized that intraoral injection of submaximal doses of mepivacaine does not lead to toxic levels of this drug in blood. This study evaluated the plasma levels of mepivacaine in third molars surgeries.
Methods:Twenty-one patients were randomly assigned into two groups: group I (two unilateral third molars; submaxi-mal dose of mepivacaine 108 mg with epinephrine 54lg) and group II (four third molars; submaximal dose of
mepiva-caine 216 mg with epinephrine 108lg). Blood samples were collected before anaesthesia, and 5, 10, 15, 20, 30, 40, 60,
90 and 120 min after anaesthesia.
Results:Individual peak plasma concentrations ranged 0.77–8.31lg/mL (group I) and from 2.36–7.72 lg/mL (group II).
An increase in the average dose of mepivacaine from 1.880.12 mg/kg (group I) to 3.35 0.17 mg/kg (group II) increased the mean mepivacaine peak plasma levels from 2.33 0.58 to 4.010.69lg/mL, respectively. Four patients
obtained plasma levels of mepivacaine above the threshold for toxicity (5lg/mL).
Conclusions:Toxic levels of mepivacaine are possible, even when a submaximal dose is used. A twofold increase in the dose of mepivacaine caused the mean peak plasma concentration to increase proportionally, indicating that they may be predicted based on the relation of dose per bodyweight.
Keywords: local anaesthetics, mepivacaine, oral surgery, plasma levels, third molars.
Abbreviations and acronyms:CI = confidence interval; HPLC = high-performance liquid chromatography; LA = local anaesthetic. (Accepted for publication 10 January 2016.)
INTRODUCTION
Local anaesthetic (LA)-related systemic toxicity mainly results from elevated plasma concentrations of these drugs. It is noted that in adult patients mepiva-caine induces toxicity when blood concentrations are above 5.0lg/mL.1 However, routine dental injection
is not expected to reach blood concentrations of this magnitude.
In order to prevent systemic toxicity, a maximum adult dose of 6.6 mg of mepivacaine per kg of
bodyweight has been recommended by manufacturers for a healthy individual.2 In addition, when using
anaesthetic solutions containing epinephrine, 400 mg is the maximum recommended dose of mepivacaine for adults.1 In Australia, a maximum mg/kg dose of 2% mepivacaine with adrenaline 1:100 000 is not currently available; therefore, a maximum total of three dental cartridges containing 3% mepivacaine hydrochloride is safely recommended for adults (www.tg.org.au). These recommendations reinforce the importance of bodyweight, and its association
446 ©2016 Australian Dental Association
Australian Dental Journal2016; 61: 446–454
doi: 10.1111/adj.12410
Australian Dental Journal
with LA dose in the prevention of systemic toxicity. However, factors such as biological variations, pres-ence/absence of vasoconstrictor, injection speed, loca-tion of the injecloca-tion site and intravascular injecloca-tion of these drugs may also influence peak plasma concentra-tions, increasing the risk of LA toxicity.3–9
The wide variation of clinically administrated doses of LAs coupled with the scarce number of studies reporting on plasma concentrations of mepivacaine during third molar surgeries have raised our interest in this field. Hence, the present study aimed to evalu-ate the plasma levels of mepivacaine during impacted third molar surgery. We hypothesized that intraoral injection of submaximal doses of mepivacaine does not lead to toxic levels of this LA in blood.
METHODS
Study design
The present prospective, single-centre, randomized study was conducted as a collaboration between the School of Pharmacy, Dentistry and Nursing at the Federal University of Ceara and the Dr Jose Frota Institute Hospital (Fortaleza, Brazil). The approval for conducting this study was granted by the Ethics Com-mittee on Human Research of the Dr Jose Frota Insti-tute Hospital (protocol #02499/97). All patients freely consented to participate in this study, and Declaration of Helsinki guidelines were followed.
Participants and eligibility criteria
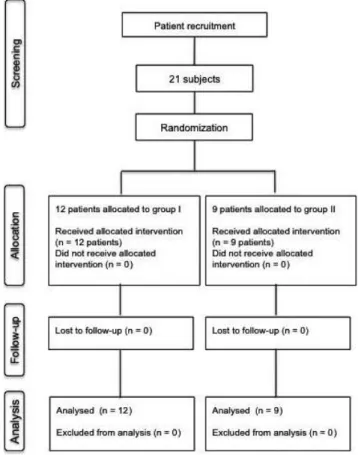
This study included 21 healthy individuals (American Society of Anesthesiologists classification I), both gen-ders, aged 18–35 years, with an indication for removal of two or four third molars (Fig. 1). The sub-jects were able and willing to cooperate with the pro-tocol and to sign an appropriate written informed consent form. Smokers, pregnant and/or lactating patients were excluded from the study. The with-drawal criterion adopted in the present study was a surgery exceeding 2 h. Patient data were recorded pre-operatively and according to a standardized clinical examination. Panoramic radiographs were used to establish the need for surgery.
Surgical overview
Following recruitment, patients were randomly assigned into either one of two groups by using Microsoft Excelâ
software (Microsoft, Redmond, WA, USA): group I (N= 12, three men and nine women; aged 18–32 years [mean, 24]) received 108 mg of mepivacaine with 54lg of epinephrine,
and group II (N= 9, three men and six women; aged
20–35 years [mean, 25]) received 216 mg of mepiva-caine with 108 lg of epinephrine. The established
dose was below the recommended maximum limit of 400 mg of mepivacaine with epinephrine.1 The required preoperative laboratory evaluation consisted of complete blood count, blood clotting tests, serum alanine aminotransferase test, serum aspartate amino-transferase, blood urea nitrogen, creatinine blood test and blood glucose test were performed at the Clinical Laboratory Analysis of the Dr Jose Frota Institute Hospital.
The same team performed all surgeries, and a stan-dardized technique was used. The same surgical tech-nique was used on the right and left sides of the mouth. Prior to local anaesthesia injection, vital signs were measured. Subsequently, LA was injected after careful aspiration for blood. A total amount of 5.4 mL (three dental cartridges) and 10.8 mL (six dental cartridges) of 2% mepivacaine solution with epinephrine 1:100 000 (DFL, Rio de Janeiro, Brazil) were respectively injected in a single session for the extraction of two unilateral or four third molars. All injections were sequentially performed in bilateral third molar surgeries. For the extraction of each max-illary third molar, a total quantity of 1.8 mL of anaesthetic solution were used as follows: 1.6 mL
Fig. 1 Flow chart of patient recruitment into the study groups, according
were administrated over 60 s into the vestibular area, whereas 0.2 mL were administrated over 30 s into the greater palatine nerve region. The extraction of each mandibular third molar required a total amount of 3.6 mL of the anaesthetic solution, out of which 3.1 mL were administrated into the inferior alveolar and lingual nerve regions over 120 s, and 0.5 mL were infiltrated over 60 s to anaesthetize the long buc-cal nerve. After surgery, all patients were medicated with analgesic, anti-inflammatory and antibacterial agents.
Primary outcome measure
The peak plasma concentration of mepivacaine was established as the primary outcome measure for the present study, and was measured by obtaining 10 samples containing 4 mL of venous blood at times 0 (before anaesthesia), 5, 10, 15, 20, 30, 40, 60, 90 and 120 min following LA administration. These samples were placed into test tubes containing ethylenediaminetetraacetic acid (Din^amica Quımica Contempor^anea Ltda, S~ao Paulo, Brazil), manually stirred and centrifuged at 590g for 10 min to extract the plasma fraction, and kept at –70°C until process-ing and future analysis of mepivacaine concentrations by high-performance liquid chromatography (HPLC).10
In order to calibrate the HPLC system and validate the present method, calibrating solutions were pre-pared from a standard stock solution of mepivacaine at a concentration of 1.0 mg/mL (Sigma-Aldrich, St Louis, MO, USA), dissolved in MILLI-Qâ
water (Mil-lipore, Bedford, MA, USA), diluted in white plasma (Hemocentro, Fortaleza, Brazil) to the final mepiva-caine concentrations of 1, 5, 10, 20, 30, 40 and 50 lg/mL. These solutions were kept at –20°C and
protected from direct light. Subsequently, 1 mL of acetonitrile was added to 1 mL of each of the diluted solutions to deproteinize the plasma, stirred on a vor-tex for 1 min, centrifuged at 1920g for 10 min, and 1.5 mL aliquots of the supernatant were evaporated to dryness in a 40°C water bath under a flow of com-pressed air. The dry solid was reconstituted in 200lL
of Milli-Q water, stirred on a vortex for 30 s and then injected into the HPLC. Similarly, three isolated samples containing 1 mL of mepivacaine-free white plasma mixed with 1 mL of acetonitrile were pro-cessed, reconstituted and injected into the HPLC to investigate the presence of endogenous interferences in the plasma and reagents. This method was validated by the HPLC system calibration, assessing the preci-sion, accuracies and linearity in the recovery of mepi-vacaine, demonstrating efficiency in the detection of small fluctuations in the mepivacaine plasma concen-trations, as recommended by the Resolution 899/2003
of the Brazilian Sanitary Vigilance Agency based on the Food and Drug Administration regulation.11–13
Sample size
Sample size was calculated based on the study by Goebelet al.9When considering an increase in plasma mepivacaine concentration of 0.30 0.35 mg after injection of 54 mg of mepivacaine, at least 12 patients would be needed per group in order to attain a statis-tical power of at least 80% within a 95% confidence interval (95% CI), and a type I error of 0.05 (v2-test
without any correction). In addition, considering an increase of 0.80 0.43 mg in the concentration of plasma mepivacaine following injection of 108 mg of mepivacaine, at least nine patients would be needed per group in order to attain a statistical power of at least 80% within a confidence interval of 95%, and a type I error of 0.05 (v2-test without any correction).
Randomization
The method to generate the random allocation sequence used the Microsoft Excel software RAND-BETWEEN function. The type of randomization was simple without any restriction. In order to implement the random allocation sequence, a sealed envelope containing random numbers was used. An external collaborator (who was unaware of the study protocol and had no further participation in this study) imple-mented random allocation sequence generation and participant enrolment/assignment.
Blinding
In order to guarantee the blinding, the statistical anal-ysis was initially carried out with coded groups. The information was only accessed once both the statisti-cal analysis had been concluded. At this time, each experimental group was identified.
Statistical analysis
Data were initially submitted to the Kolmogorov–
Smirnov normality test. Parametric data were ana-lyzed by one-way repeated-measuresANOVA/Bonferroni
test. All analyses were performed with GraphPad Prism 5.0 software (GraphPad Software, San Diego, CA, USA). The level of significance was set as
P < 0.05 for all of the evaluations.
RESULTS
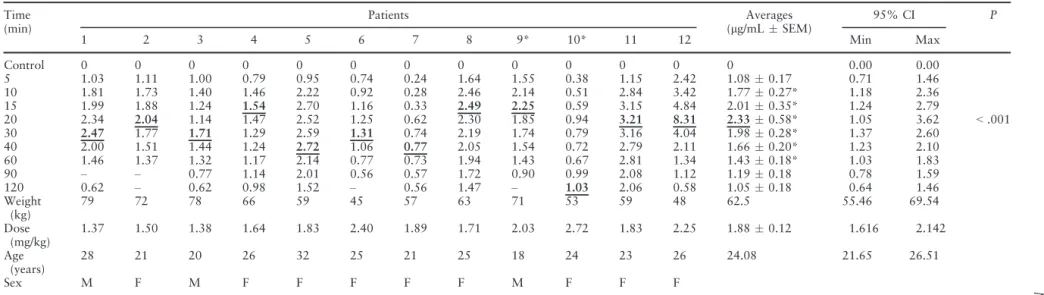
Table 1 shows the weights, doses, ages, genders, indi-vidual and mean plasma values observed after inject-ing a total of 108 mg of mepivacaine with 54lg of
448 ©2016 Australian Dental Association
Table 1. Individual mepivacaine mean (lg/mLstandard error of the mean) and peak plasma concentrations after injection of mepivacaine (108 mg) with epinephrine (1 lg/mL) in surgeries to remove two third molars (n = 12)
Time (min)
Patients Averages
(lg/mLSEM)
95% CI P
1 2 3 4 5 6 7 8 9* 10* 11 12 Min Max
Control 0 0 0 0 0 0 0 0 0 0 0 0 0 0.00 0.00
<.001 5 1.03 1.11 1.00 0.79 0.95 0.74 0.24 1.64 1.55 0.38 1.15 2.42 1.080.17 0.71 1.46
10 1.81 1.73 1.40 1.46 2.22 0.92 0.28 2.46 2.14 0.51 2.84 3.42 1.770.27* 1.18 2.36 15 1.99 1.88 1.24 1.54 2.70 1.16 0.33 2.49 2.25 0.59 3.15 4.84 2.010.35* 1.24 2.79 20 2.34 2.04 1.14 1.47 2.52 1.25 0.62 2.30 1.85 0.94 3.21 8.31 2.330.58* 1.05 3.62 30 2.47 1.77 1.71 1.29 2.59 1.31 0.74 2.19 1.74 0.79 3.16 4.04 1.980.28* 1.37 2.60 40 2.00 1.51 1.44 1.24 2.72 1.06 0.77 2.05 1.54 0.72 2.79 2.11 1.660.20* 1.23 2.10 60 1.46 1.37 1.32 1.17 2.14 0.77 0.73 1.94 1.43 0.67 2.81 1.34 1.430.18* 1.03 1.83 90 – – 0.77 1.14 2.01 0.56 0.57 1.72 0.90 0.99 2.08 1.12 1.190.18 0.78 1.59 120 0.62 – 0.62 0.98 1.52 – 0.56 1.47 – 1.03 2.06 0.58 1.050.18 0.64 1.46 Weight
(kg)
79 72 78 66 59 45 57 63 71 53 59 48 62.5 55.46 69.54
Dose (mg/kg)
1.37 1.50 1.38 1.64 1.83 2.40 1.89 1.71 2.03 2.72 1.83 2.25 1.880.12 1.616 2.142
Age (years)
28 21 20 26 32 25 21 25 18 24 23 26 24.08 21.65 26.51
Sex M F M F F F F F M F F F
Numbers represents patients, and asterisk (*) represents individuals that received an additional dose of mepivacaine (36 mg). Underlined and bold typed values represent individual mepiva-caine peak plasma concentrations and mean values of mepivamepiva-caine.
*P<0.05 versus control (repeated-measuresANOVA/Bonferroni).
CI, confidence interval; F, female; M, male; Max, maximum; Min, minimum; SEM, standard error of the mean.
Australian
Dental
Association
449
Mepiv
acaine
con
centrations
in
surger
epinephrine and monitoring patients over a 2-h per-iod. The mean plasma concentration reached a maxi-mum value of 2.330.58 lg/mL (95% CI, 1.05–
3.62) at 20 min in comparison with the levels of LA obtained before anaesthesia (control), subsequently decreasing to a residual level of 1.05 0.18lg/mL
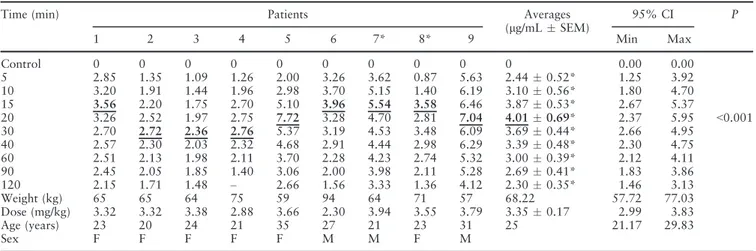
(95% CI, 0.64–1.46) at the end of the second hour. Similarly, Table 2 shows that following injections of 216 mg of mepivacaine with 108lg of epinephrine,
the mean serum level of LA increases to a peak plasma concentration of 4.010.69 lg/mL (95% CI,
2.37–5.95) at 20 min and then decreases to a residual level of 2.300.35 lg/mL (95% CI, 1.46–3.13).
Hence, administration of 216 mg of mepivacaine ren-ders peak plasma concentrations of approximately twice the amounts achieved after injecting 108 mg of mepivacaine. Both tables show that not all patients reached peak plasma levels 20 min after LA injection, as described in Tables 1 and 2 in bold underlined val-ues.
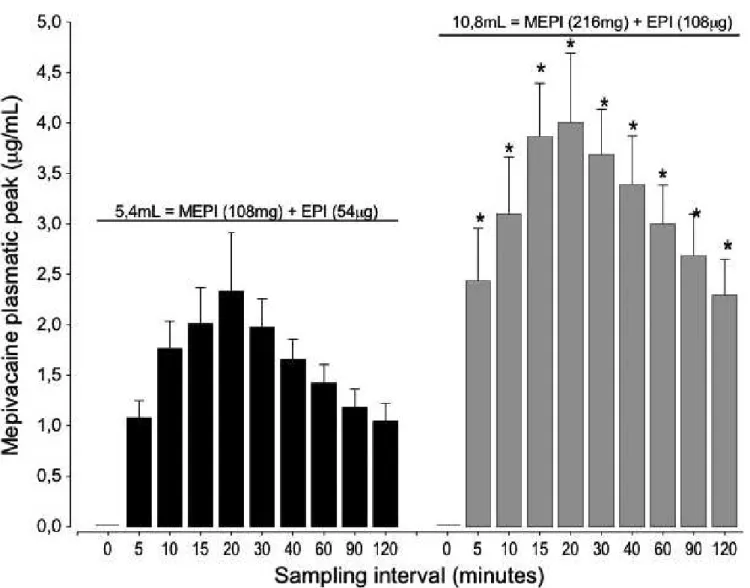
Figure 2 shows the mean mepivacaine plasma val-ues observed in different evaluation intervals. The mean peaks of 2.330.58 and 4.01 0.67lg/mL
occurred at 20 min, and this finding can be inter-preted as a result of the injected mepivacaine doses of 1.88 and 3.35 mg/kg with epinephrine during extrac-tion of two unilateral or four third molars, respec-tively. Despite the observed intrinsic variability in individual biological response, statistically, the mean values show the same pattern on the observed increase (due to higher peak plasma levels) and decrease (due to lower peak plasma levels) of the bars on Fig. 2 when doubling the dose of mepivacaine. This pattern
was also noted when different patients received 108 or 216 mg of mepivacaine, demonstrating a certain proportionality between the mean values obtained in their respective evaluation intervals, which persisted throughout the 2 h of evaluation.
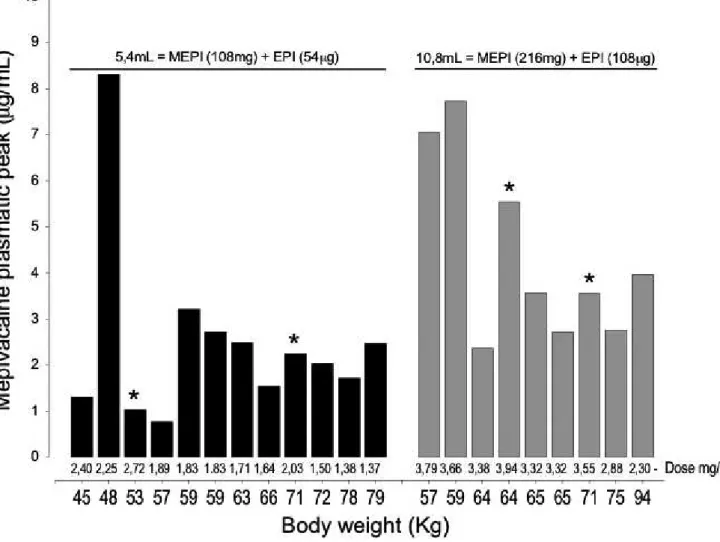
Figure 3 shows the peak plasma concentration for each study participant as it associates with body-weight and dose (mg/kg). Patients identified with an asterisk (*) in Tables 1 and 2 received additional doses of 1.8 mL of LA (Table 1, patient #9 received a supplemental dose after 15 min and patient #10 after 11 min; Table 2, patient #7 received an additional dose after 20 min and patient #8 after 23 min). These individuals were maintained in the present study because they did not influence negatively the interpre-tation of the results, or the main study goal. Of the 12 patients who received 108 mg of mepivacaine, five individuals showed peak plasma values greater than the lowest peak plasma concentrations presented by those who received 216 mg of mepivacaine. Out of the nine patients receiving 216 mg of mepivacaine, three subjects reached peak plasma concentrations greater than 5.0lg/mL, above the previously
estab-lished levels of toxicity. Twenty-one patients showed peak plasma concentrations of 8.31 lg/mL after
injec-tion of 108 mg of mepivacaine. Patients did not show signs of toxicity throughout the 2-h follow-up period of this study, including those with peak plasma levels above 5 lg/mL.
Table 3 compares the differences in mean mepiva-caine plasma levels (%) at different evaluation inter-vals. Throughout the various times of evaluation, the differences were statistically significant at P< 0.05 as
Table 2. Individual mepivacaine mean (lg/mL standard error of the mean) and peak plasma concentrations after injection of mepivacaine (216 mg) with epinephrine (1lg/mL) in surgeries to remove four third molars (n= 9)
Time (min) Patients Averages
(lg/mLSEM)
95% CI P
1 2 3 4 5 6 7* 8* 9 Min Max
Control 0 0 0 0 0 0 0 0 0 0 0.00 0.00
<0.001
5 2.85 1.35 1.09 1.26 2.00 3.26 3.62 0.87 5.63 2.440.52* 1.25 3.92
10 3.20 1.91 1.44 1.96 2.98 3.70 5.15 1.40 6.19 3.100.56* 1.80 4.70
15 3.56 2.20 1.75 2.70 5.10 3.96 5.54 3.58 6.46 3.870.53* 2.67 5.37
20 3.26 2.52 1.97 2.75 7.72 3.28 4.70 2.81 7.04 4.010.69* 2.37 5.95
30 2.70 2.72 2.36 2.76 5.37 3.19 4.53 3.48 6.09 3.690.44* 2.66 4.95
40 2.57 2.30 2.03 2.32 4.68 2.91 4.44 2.98 6.29 3.390.48* 2.30 4.75
60 2.51 2.13 1.98 2.11 3.70 2.28 4.23 2.74 5.32 3.000.39* 2.12 4.11
90 2.45 2.05 1.85 1.40 3.06 2.00 3.98 2.11 5.28 2.690.41* 1.83 3.86
120 2.15 1.71 1.48 – 2.66 1.56 3.33 1.36 4.12 2.300.35* 1.46 3.13
Weight (kg) 65 65 64 75 59 94 64 71 57 68.22 57.72 77.03
Dose (mg/kg) 3.32 3.32 3.38 2.88 3.66 2.30 3.94 3.55 3.79 3.350.17 2.99 3.83
Age (years) 23 20 24 21 35 27 21 23 31 25 21.17 29.83
Sex F F F F F M M F M
Numbers represents patients, and asterisk (*) represents individuals that received an additional dose of mepivacaine (36 mg). Underlined and bold typed values represent individual mepivacaine peak plasma concentrations and mean values of mepivacaine.
*P<0.05 versus control (repeated-measuresANOVA/Bonferroni).
CI, confidence interval; F, female; M, male; Max, maximum; Min, minimum; SEM, standard error of the mean.
450 ©2016 Australian Dental Association
indicated with an asterisk (*) on the vertical bars seen in Fig. 2. A 44% increase in the mean dose generated a 43% rise in the mean peak plasma concentration, showing an increase of similar magnitude when dou-bling the amount of mepivacaine. In addition, this dif-ference in percentage values is observed between the maximum peak concentration (42%) and the mean value of all individual plasma peaks (43%). This 1% difference can be neglected, because if the same patients had been exposed to these two different doses of mepivacaine (108 and 216 mg), the results would hardly differ. However, unlike the statistical analysis that shows mean doses of 1.880.12 mg/kg (95% CI, 1.61–2.14) and 3.35 0.17 mg/kg (95% CI, 2.99–3.83) leading to proportionally relative mepiva-caine mean peak plasma concentrations of 2.49 and 4.36lg/mL, individual results show that plasma
peaks were not dose dependent. Thus, there was no
direct relation between the attained plasma concentra-tions and bodyweight (Tables 1,2).
DISCUSSION
Local anaesthetics are the most widely used drugs in dentistry,1,2,14–17 with an estimated number of 11
million dental cartridges containing LA solutions administrated per year in Australia.14 A previous study that investigated dental LA adverse reactions from the Australian Office of Product Review of the Therapeutics Goods Administration showed that sev-ere adverse reactions are rare and multifactorial in origin.14 In this context, the present study evaluated the plasma levels of mepivacaine after injections of 108 and 216 mg of mepivacaine with epinephrine (1 lg/mL) for the respective extraction of two or four
third molars. Four out of the 21 patients (group I,
Fig. 2 Plasma mepivacaine (MEPI) concentrations after injection of 5.4 and 10.8 mL of mepivacaine at 2% with epinephrine (EPI) diluted to 1:100 000
in surgeries to extract two (black, n=12) and four (grey, n=9) third molars, respectively. Peak plasma values of mepivacaine are expressed in meanstandard error of the mean (vertical bars), number of surgeries per patients is indicated by“n”. Results are statistically significant at *P<0.05,
N = 2; group 2, N= 2) received an additional dose of 1.8 mL of anaesthetic solution containing 36 mg of mepivacaine and 18lg of epinephrine. Because the
additional dose did not influence the analysis of the results, these subjects were not removed from the study sample.
The mepivacaine mean plasma values produced a graphic pattern that showed certain proportionality between the groups when compared with their respec-tive experimental times. The same pattern of propor-tionality was obtained after the injection of 54 and 108 mg of 3% mepivacaine plain in the upper premo-lar region.9 Similar curves have been previously obtained by gas chromatography18 and in mepiva-caine pharmacokinetic studies following epidural injection.19 Similar plasma concentrations were observed after p.o. injection of mepivacaine following extraoral, epidural, intercostal, brachial plexus and sciatic femoral nerve blocks3in adults20and children.8 These results were also reported in studies evaluating
the plasma levels of lidocaine after p.o. injections.6,21 In spite of the observed similarity between previous plasma concentration curves and our data, previous studies show discrepant peak plasma concentrations and demonstrate that many factors may influence LA absorption.
Previous studies investigated the circulating serum levels of lidocaine following dental infiltration injec-tions.6,7,20–23 In these studies, administration of
lido-caine doses varying 20–160 mg rendered plasma concentrations ranging 0.22–2.00lg/mL. These
results differed from the present mepivacaine groups (group I, 0.77–8.31lg/mL; group II, 2.36–7.72lg/
mL). Cannell and Beckett5 showed that the applica-tion of a second dose of 2% lidocaine with epinephr-ine 60 min after the first dose induced an additional plasma peak when injected into the buccal region adjacent to the upper second molar; however, this finding was not observed after inferior alveolar nerve blocks. Interestingly, when the anaesthetic dose
Fig. 3 Individual peak plasma concentrations of mepivacaine (MEPI) after injection of 5.4 and 10.8 mL of mepivacaine at 2% with epinephrine (EPI)
diluted to 1:100 000 in surgeries to extract two (black, n=12) and four (grey, n=9) third molars, respectively. The number of procedures is indicated by“n”and the asterisk (*) identifies patients that received an additional dose of 36 mg of mepivacaine and 18lg of epinephrine (1.8 mL). The values
under the bars show the doses of mepivacaine in mg/kg of bodyweight.
452 ©2016 Australian Dental Association
increases twofold, but the injection site remains unchanged, plasma levels tend to increase at a similar rate. A study with five adult volunteers who received 54 and 108 mg of 3% mepivacaine plain injected into the buccal mucosa region of the upper premolars, respectively, reported 30 min after injection mean peak plasma concentrations of 0.59 and 1.11lg/mL.9
Wood et al.23 evaluated intraosseous and infiltration injections for venous lidocaine and observed an approximate mean peak plasma level of 0.44lg/mL.
These results are in agreement with the present study, which demonstrated that a twofold increase in the dose of mepivacaine from 108 to 216 mg elevated the mean peak plasma concentrations from 2.33 to 4.01lg/mL, 20 min after injection, respectively.
However, to our knowledge no previous studies have shown the mean plasma levels of mepivacaine during third molar extractions, which did not allow a direct confrontation with our results.
There is strong evidence suggesting that the degree of vascularization in the injection site influences plasma levels of LAs.3,5 Vasoconstrictors were added into anaesthetic solutions to compensate local vascu-larization and LA vasodilator effects by reducing the speed of absorption and plasma levels of these drugs. Epidural injection of mepivacaine with or without epi-nephrine showed that the presence of a vasoconstric-tor did not reduce the plasma levels of mepivacaine.24
Interestingly, in the present group I, mepivacaine injection resulted in a mean peak plasma concentra-tion above 1.11lg/mL. This concentration was
obtained after injecting the same amount of mepiva-caine without vasoconstrictor in the upper premolar region,9 conflicting with the idea that the presence of a vasoconstrictor would reduce plasma levels of mepi-vacaine.
Individual biological variability is a remarkable feature among patients when considering time and peak plasma values. The present data showed that out of the 12 patients who received 108 mg of mepi-vacaine, three patients reached peak plasma levels 15 min after LA injection, three at 20 min, three at 30 min, two at 40 min and one individual achieved maximum plasma concentrations at 120 min after LA administration. These peak concentrations fluctu-ated from 0.77 to 8.31lg/mL. Nine patients received
216 mg of mepivacaine, four of these patients achieved peak plasma levels of LA at 15 min, two at 20 min and three at 30 min after injection, with peak serum levels ranging 2.36–7.71lg/mL.
Statisti-cally, patients who received 216 mg of mepivacaine expressed mean peak plasma levels higher than those who received 108 mg, both at 20 min. Unexpectedly, the individual data showed a lack of consistency between plasma levels of mepivacaine and the applied doses. Five of the patients who received
108 mg of mepivacaine reached higher peak plasma concentrations than the lowest peak serum levels observed after the injection of mepivacaine 216 mg. Extreme biological variability was also previously observed when one patient who received mepivacaine at 54 and 108 mg at different occasions, expressed the same peak serum concentration of 1.27lg/mL,
respectively, at 30 and 90 min after injection, show-ing that the dose does not influence the plasma peak.9 These results emphasize that the dose can be standardized, but not the biological response. Thus, an imminent and unpredictable risk of systemic toxi-city must always be considered, and no precautions can be previously suggested in these situations, while rigorously respecting the manufacturers’ recommen-dations. The magnitude of risk is difficult to be safely quantified and caution should be exercised even with submaximal doses of LAs.
CONCLUSIONS
In summary, toxic levels of mepivacaine are possible, even when a submaximal dose is used. A twofold increase in the dose of mepivacaine caused the mean peak plasma concentration to increase proportionally, indicating that they may be predicted based on the relation of dose per bodyweight.
REFERENCES
1. Barash PG, Cullen BF, Stoelting RK, Cahalan MK, Stock MC. Handbook of Clinical Anesthesia. 6th ed. Wolters Kluwer Health: Philadelphia, 2009.
2. Malamed SF. Handbook of local anesthesia. 6th ed. Elsevier: Mosby, 2005.
3. Tucker GT, Moore DC, Bridenbaugh PO, Bridenbaugh LD, Thompson GE. Systemic absorption of mepivacaine in com-monly used regional block procedures. Anesthesiology 1972;37:277–287.
4. Scott DB, Jebson PJ, Braid DP, Ortegren B, Frisch P. Factors affecting plasma levels of lignocaine and prilocaine. Br J Anaesth 1972;44:1040–1049.
5. Sortino F, Romano G, Vassallo G. Plasmatic value curves of mepivacaine in plexal anesthesia of the upper jaw, the spine of Spix and intraligamentary. Stomatol Mediterr 1989;9:87–90. 6. Cannell H, Beckett AH. Peri-oral injections of local anaesthetic
into defined sites. Br Dent J 1975;139:242–244.
7. Perovic J, Petrovic V, Obradovic O, Todorovic L. The influ-ence of vasoconstrictor in local anaesthetic solutions and injec-tion sites on blood levels of lidocaine after intraoral application. Bull Group Int Rech Sci Stomatol Odontol 1980;23:113–117.
8. Chin KL, Yagiela JA, Quinn CL, Henderson KR, Duperon DF. Serum mepivacaine concentrations after intraoral injection in young children. J Calif Dent Assoc 2003;31:757–764.
9. Goebel W, Allen G, Randall F. Circulating serum levels of mepivacaine after dental injection. Anesth Prog 1978;25:52–56. 10. Tanaka E, Nakamura T, Inomata S, Honda K. Simultaneous
11. Adams HA, Biscoping J, Ludolf K,et al. The quantitative anal-ysis of amide local anaesthetics using high pressure liquid chro-matography and ultraviolet detection (HPLC/UV). Reg Anaesth 1989;12:53–57.
12. Vleeter AA, Olieman W, Burm AGL, Groen K, van Kleef JW. High-performance liquid chromatographic assay of mepivi-caine enantiomers in human plasma in the nanogram per milliliter range. J Chromatogr B Biomed Appl 1996;678:369–
372.
13. Grouls RJ, Ackerman EW, Korsten HH, Hellebrekers LJ, Brie-mer DD. Partition coefficients (n-octanol/water) of N-butyl-p-aminobenzoate and other local anaesthetics measured by reversed-phase high-performance liquid chromatography. J Chromatogr B Biomed Appl 1997;694:421–425.
14. Sambrook PJ, Smith W, Elijah J, Goss AN. Severe adverse reac-tions to dental local anaesthetics: systemic reacreac-tions. Aust Dent J 2011;56:148–153.
15. Subramaniam S, Tennant M. A concise review of the basic biol-ogy and pharmacolbiol-ogy of local analgesia. Aust Dent J 2005;50: S23–30.
16. Sambrook PJ, Goss AN. Severe adverse reactions to dental local anaesthetics: prolonged mandibular and lingual nerve anaesthe-sia. Aust Dent J 2011;56:154–159.
17. Kingon A, Sambrook P, Goss A. Higher concentration local anaesthetics causing prolonged anaesthesia. Do they? A litera-ture review and case reports. Aust Dent J 2011;56:348–351. 18. Pratt EL, Warrington HP, Grego J. The gas chromatographic
determination of mepivacaine in blood with a note on other local anesthetics. Anesthesiology 1967;28:432–437.
19. Laguarda Rodrigo M, Sanchez Alcaraz A, Sangrador Garcia G, Botelho Miro J, Herrero Gracia C. Pharmacokinetics of mepi-vacaine and lidocaine after epidural administration. Rev Esp Anestesiol Reanim 1990;5:269–272.
20. Goebel WM, Allem G, Randal F. Comparative circulating serum levels of mepivacaine with levo-nordefrin and lidocaine with epinephrien. Anesth Prog 1979;26:93–97.
21. Cannell H, Walters H, Beckett AH, Saundes A. Circulating levels of lignocaine after peri-oral injections. Br Dent J 1975;138:87–93.
22. Goebel WM, Allen G, Randall F. Comparative circulatory serum levels of 2 percent mepivacaine and 2 per cent ligno-caine. Br Dent J 1980;148:261–264.
23. Wood M, Reader A, Nusstein J,et al. Comparison of intraoss-eous and infiltration injections for venous lidocaine blood con-centrations and heart rate changes after injection of 2% lidocaine with 1:100,000 epinephrine. J Endod 2005;31:435–
438.
24. Takasaki M, Oh-Oka T, Doi K, Kosaka Y. Blood levels of mepivacaine during continuous epidural anesthesia. Anesth Analg 1987;66:337–340.
25. Clark RB, Jones GL, Barclay DL, Greifenstein FE, Mcaninch PE. Maternal and neonatal effects of 1% and 2% mepivacaine for lumbar extradural analgesia. Br J Anaesth 1975;47:1283–
1289.
26. Neal JM, Bernards CM, Butterworth JF 4th,et al. ASRA prac-tice advisory on local anesthetic systemic toxicity. Reg Anesth Pain Med. 2010;35:152–161.
27. Ciechanowicz S, Patil V. Lipid emulsion for local anesthetic sys-temic toxicity. Anesthesiol Res Pract 2012;2012:131784. 28. Singh P. An emphasis on the wide usage and important role of
local anesthesia in dentistry: A strategic review. Dent Res J (Isfahan) 2012;9:127–132.
Address for correspondence: Adjunct Professor Fabio Wildson Gurgel Costa Rua Alexandre Barauna
949 Rodolfo Teofilo
CEP 60430-160 Fortaleza-CE, Brazil Email: [email protected]
454 ©2016 Australian Dental Association