ABSTRACT:Objective: It was to identify trends of traumatic and non‑traumatic causes of lower limb amputations, as well as the role played by population aging, traic violence increase, public health policy of diabetes control program and drivers anti‑alcohol laws on these amputations. Method: Hospitalization data recorded in the discharge forms of 32 hospitals located in the region of Ribeirão Preto, Brazil, from 1985 to 2008 were analyzed. Result: A total of 3,274 lower‑limb amputations were analyzed, of which 95.2% were related to non‑traumatic causes, mainly infectious and ischemic complications of diabetes mellitus. Cancer (2.8%) and congenital (1.3%) causes were included in this group. Only 4.8% were related to traumatic causes. Traumatic amputation average rate was 1.5 amputations in 100,000 habitants with a slight tendency of increase in the last 5 years. Non‑traumatic causes showed an average rate of 30.0 amputations for 100,000 habitants and remained relatively constant during the whole period. Non‑traumatic were much more predominant in patients older than 60 years and traumatic amputations occurred more frequently in patients younger than 39 years. Conclusion:
The overall rates of amputation and the rates of traumatic and non‑traumatic amputations remained nearly constant during the study period. The impact of diabetes control policies and the introduction of traic safety laws could not be identiied on the amputation rates.
Keywords: Amputation. Traic accidents. Diabetes mellitus. Diabetes complications. Observational study. Leg injuries.
Incidence and causes of lower-limb amputations
in the city of Ribeirão Preto from 1985 to 2008:
evaluation of the medical records from 3,274 cases
Incidência e causas de amputações dos membros inferiores em
Ribeirão Preto de 1985 a 2008: avaliação de 3.274 casos
Bruna Maria Bueno BarbosaI, Rosane Aparecida MonteiroII, Lucas Françolin SparanoI,
Rodolfo Fabiano Niz BareiroI, Afonso Dinis Costa PassosII, Edgard Eduard EngelI
ORIGINAL ARTICLE / ARTIGO ORIGINAL
IDepartment of Biomechanics, Medicine and Rehabilitation of the Locomotor System, Ribeirão Preto Medical School, Universidade de São Paulo – São Paulo (SP), Brazil.
IIDepartment of Social Medicine, Ribeirão Preto Medical School,Universidade de São Paulo – São Paulo (SP), Brazil.
Corresponding author: Edgard Eduard Engel. Hospital das Clínicas. Avenida Bandeirantes, 3900, 11º andar, CEP: 14049-900, Ribeirão Preto, SP, Brazil. E-mail: [email protected]
INTRODUCTION
The incidence rates of amputations vary among diferent countries1. Approximately 134,000 procedures are annually referred in the USA, and more than 100,000 of these cor‑ respond to lower‑limb amputations2. In Brazil, amputations have an incidence of 13.9 per 100,000 inhabitants3, with 85.0% of the cases occurring in the lower limbs4. The most com‑ mon causes of lower‑limb amputation include peripheral arterial occlusive disease (PAOD) mainly consequent to diabetes, trauma and malignant tumors1,5‑7.
Diabetes is increasing rapidly all around the world, and reducing its complications is a relevant public health policy issue8. Amputation is a major complication of it and the rela‑ tive risk is up to 9 times that of the nondiabetic population. Approximately 9.0 to 20.0% of patients who already had an amputation require another one within one year9.
Diabetes control programs have dropped the amputation incidence in Finland, Scottland and UK8,10,11. All these programs are based on early diagnosis, systemic control and multi‑ disciplinary teamwork focusing on foot care. A diabetes control program was introduced in Ribeirão Preto in 2002 mainly focused on facilitating spontaneous search for diagnosis and free drug distribution.
The second most important cause of amputation is trauma due to traic accidents, mainly those involving motorcycles, which are the main cause of trauma injuries in Brazil2. In Ribeirão Preto, a Brazilian southeastern city with an estimated population of 600,000 inhabitants, the number of registered vehicles and speciically motorcycles increased, in the period of 2002
RESUMO:Objetivo:Identiicar as tendências temporais de causas traumáticas e não traumáticas de amputações de membros inferiores, e os efeitos do envelhecimento da população, do aumento de violência no trânsito, da política de saúde pública do programa de controle de diabetes e das leis de controle do uso de álcool em motoristas sobre as taxas de amputações. Método: Foram analisados os dados das folhas de alta de pacientes submetidos a amputações de todos os 32 hospitais localizados na região de Ribeirão Preto, Brasil, de 1985 a 2008. Resultado:
De 3.274 amputações de membros inferiores, 95,2% estavam relacionadas a causas não traumáticas, principalmente complicações do diabetes mellitus. Câncer (2,8%) e causas congênitas (1,3%) foram incluídos neste grupo. Apenas 4,8% estavam relacionados às causas traumáticas. A taxa média de amputação traumática foi de 1,5 amputações por 100.000 habitantes, com uma ligeira tendência de aumento nos últimos 5 anos. As causas não traumáticas mostraram uma taxa média de 30 amputações por 100.000 habitantes e mantiveram‑se relativamente constantes durante todo o período. As causas não traumáticas foram predominantes em pacientes com mais de 60 anos, e as amputações traumáticas ocorreram mais frequentemente em pacientes com menos de 39 anos. Conclusão:
A taxa total de amputações e as taxas de amputações traumáticas e não traumáticas permaneceram praticamente constantes durante o período de estudo. O impacto das políticas de controle do diabetes e da introdução de leis de repressão do uso de álcool no trânsito não pode ser identiicado nas taxas de amputação.
to 2008, from 38.2 to 111.8% respectively. In the same period, the incidence of traic acci‑ dents and injuries increased from 27.3 to 61.9% respectively12. It is worth to mention that a law restricting the use of alcohol by drivers was implemented in Brazil in 2008.
The aim of this study was to analyze some epidemiological aspects of lower‑limb ampu‑ tation causes in Ribeirão Preto in a period of 23 years, and the impact of the improvements in the clinical management of diabetic patients and the legislative interventions on driver’s safety on these occurrences. The role played by population aging and traic violence increase was considered as well. The high relevance of studies of the main epidemiological character‑ istics of amputations lies in the large variation in the proiles and demands of amputees due to diferent causes, as the repercussions of those variations focus on personal (life expectancy and functionality) and social aspects, including absenteeism, early retirement and treatment costs13. Notwithstanding, there is a signiicant lack of data on the evolution of amputation causes, which complicates the adoption of efective measures against the causative factors.
METHODOLOGY
Data from hospitalized patients in any of the 34 public and private hospitals in the 25 munic‑ ipalities that form the region of Ribeirão Preto who resided in the municipality of Ribeirão Preto during the period from 1985 to 2008 were analyzed. The hospital discharge forms listed the protocol used for data collection in the hospitals and were electronically recorded and analyzed by the Hospital Data Processing Center (Centro de Processamento de Dados Hospitalares – CPDH) Information System. This service is currently managed by the Regional Observatory for Hospital Care (Observatório Regional de Atenção Hospitalar – ORAH) of the Department of Social Medicine, Ribeirão Preto Medical School, Universidade de São Paulo (USP).
Only patients who were admitted for surgical lower‑limb amputation were selected for this study. The International Classiication of Diseases (ICD) was used to separate the diag‑ noses into traumatic and non‑traumatic groups. The ninth revision (ICD‑9) was used for the period from 1980 to 1997, and the tenth revision (ICD‑10) was used for the period during and after 1998. Chapter XIX (“Injury, poisoning and certain other consequences of external causes” (S00‑T98)) codes from the ICD‑10 were used to identify the traumatic injuries. Chapter XVIII from the ICD‑9 (“Injury and poisoning” (codes 895‑897)) was also used. The following variables were also assessed from the discharge records: patient age and gender, level of amputation, year of hospital discharge, health plan (SUS [Sistema Único de Saúde/Brazilian National Health System] or non‑SUS) and patient discharge condition (hospital discharge or death).
Resident population data from Ribeirão Preto, which were generated by the Brazilian Institute of Geography and Statistics (IBGE), were used to calculate the rate of hospital admissions14. Possible associations between qualitative and quantitative stratiied variables were assessed with the χ2 test, and a p‑value of 5% was adopted as the threshold for statistical signiicance.
RESULTS
A total of 3,274 lower‑limb amputations were performed between 1985 and 2008 on inhabitants of the city of Ribeirão Preto; 157 of them were traumatic (4.8%) and 3,117 were non‑traumatic (95.2%), all concentrated in 9 hospital units within the same city. The HCFMRP performed 40.1 and 33.6% of the traumatic and non‑traumatic amputa‑ tions, respectively.
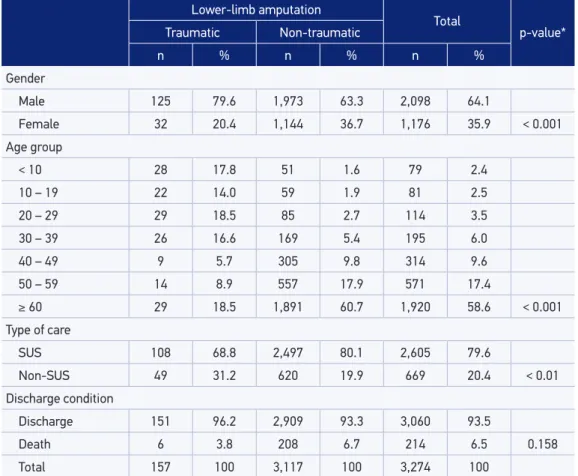
Table 1 shows the distribution of traumatic and non‑traumatic amputations according to gender, age group, type of care and discharge conditions. The distribution according to age groups shows a marked diference between the reasons for amputation, with a con‑ centration of non‑traumatic causes among older people, especially above 59 years, and predominance of traumatic among those up to 39 years of age (p < 0.001). These difer‑ ences are more easily observed in Figure 1.
Lower‑limb amputation
Total
p‑value*
Traumatic Non‑traumatic
n % n % n %
Gender
Male 125 79.6 1,973 63.3 2,098 64.1
Female 32 20.4 1,144 36.7 1,176 35.9 < 0.001
Age group
< 10 28 17.8 51 1.6 79 2.4
10 – 19 22 14.0 59 1.9 81 2.5
20 – 29 29 18.5 85 2.7 114 3.5
30 – 39 26 16.6 169 5.4 195 6.0
40 – 49 9 5.7 305 9.8 314 9.6
50 – 59 14 8.9 557 17.9 571 17.4
≥ 60 29 18.5 1,891 60.7 1,920 58.6 < 0.001
Type of care
SUS 108 68.8 2,497 80.1 2,605 79.6
Non‑SUS 49 31.2 620 19.9 669 20.4 < 0.01
Discharge condition
Discharge 151 96.2 2,909 93.3 3,060 93.5
Death 6 3.8 208 6.7 214 6.5 0.158
Total 157 100 3,117 100 3,274 100
Table 1. Distribution of amputations for traumatic and non‑traumatic causes among residents of the city of Ribeirão Preto according to gender, age group, type of care and hospital discharge condition from 1985 to 2008.
In total, 79.6% of the amputations occurred at the expense of the SUS, nearly the same pro‑ portion as that for non‑traumatic amputations (80.1%). Among the traumatic amputations, however, the proportion of cases covered by the SUS was reduced to 68.8% (p < 0.01, comparing traumatic and non‑traumatic causes). A total of 214 post‑surgery deaths occurred (6.5%), which comprised 3.8 and 6.7% of the traumatic and non‑traumatic amputations, respectively (p = 0.158).
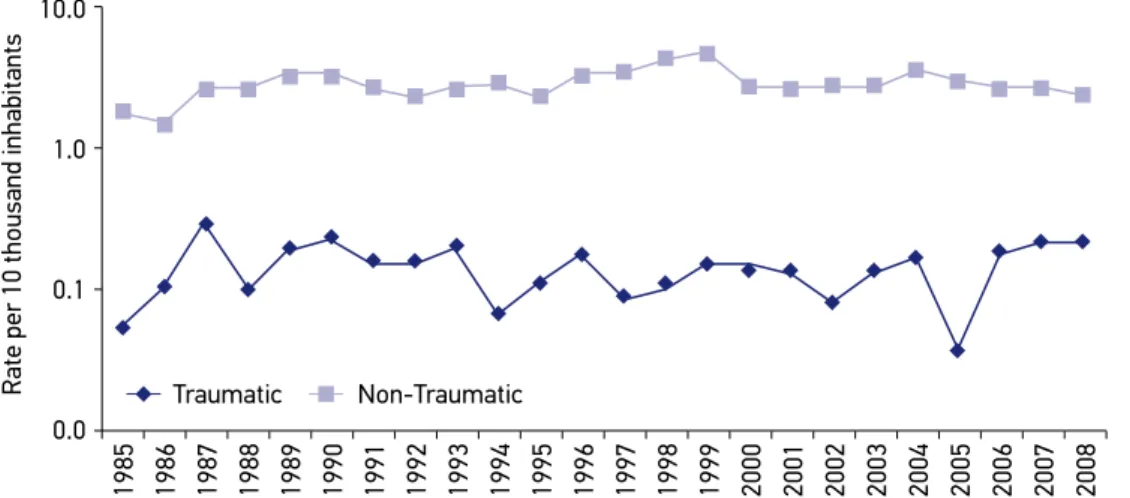
Figure 2 demonstrates the logarithmic evolution of the amputation incidence rates throughout the study period. Although the absolute number of procedures due to both
70
Age group (years)
<9 10 – 19 20 – 29 30 – 39
Traumatic Non‑Traumatic
40 – 49 50 – 59 ≥ 60
60
50
40
30
% of amputations 20
10
0
Figure 1. Number of amputations for traumatic and non‑traumatic causes among residents of the city of Ribeirão Preto according to age group from 1985 to 2008.
10.0
Traumatic Non‑Traumatic
1.0
0.1
0.0
Rate per 10 thousand inhabitants
1985 1986 1987 1988 1989 1990 1991 1992 1993 1994 1995 1996 1997 1998 1999 2000 2001 2002 2003 2004 2005 2006 2007 2008
Amputation rates are represented in logarithmic scale for aesthetic reasons.
causes increased from 1985 to 2008, the transformation into coeicients revealed a general trend of stability, particularly for non‑traumatic amputations. In this group, the extremes were 225 occurrences in 1999 and 58 in 1986, representing a maximum ratio of 3.9. Conversely, the traumatic amputations showed greater instability, ranging from a maximum of 12 in the last 2 years of the study, to a minimum of 2 (in 1985 and 2005), for a ratio of 6.
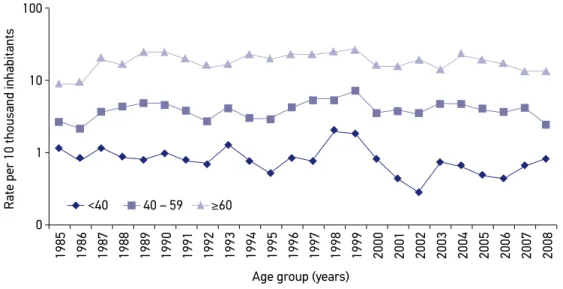
Subdivision of the age variable into 3 categories revealed that the risk of amputation increased with age, as the values were signiicantly higher among individuals above 60 years of age (Figure 3).
DISCUSSION
This study shows that there was no increased risk of lower‑limb amputation in the city of Ribeirão Preto during the period from 1985 to 2008, as relected by the stability of the incidence coeicients during those years. It also shows that 4.8% of amputations were caused by trauma, including traic accidents, work accidents and aggression, and 95.2% were the result of non‑traumatic causes, including cancer (2.81%) and congenital disor‑ ders (1.31%). This data difers slightly from that of Spichler et al.6 who found PAOD as being responsible for 90.7% of lower‑limb amputations studied in Rio de Janeiro, mainly related to diabetes, and percentages of 5.6 and 0.8% of trauma and malignant tumors, respectively. The amputation rates were not afected by other population proile charac‑ teristics, like aging, as well.
Figure 3. Rates of amputations for traumatic and non‑traumatic causes among residents of the city of Ribeirão Preto according to age group from 1985 – 2008.
Amputation rates are represented in logarithmic scale for aesthetic reasons.
100
Age group (years) 10
1
0
Rate per 10 thousand inhabitants
1985 1986 1987 1988 1989 1990 1991 1992 1993 1994 1995 1996 1997 1998 1999 2000 2001 2002 2003 2004 2005 2006 2007 2008
The speciic causes of amputations could not be accurately assessed in the non‑trau‑ matic group given the limitations of the instrument used. This stems from the fact that it is impossible to discriminate similar diagnoses that lead to amputations based on the ICD. The causes of diabetes‑related amputations, for example, can be described in several ways, including ischemia, infection or diabetes, resulting in multiple entries for the same clinical condition. Concurrently, the hospital discharge forms are not always completed by the phy‑ sician responsible for the patient, resulting in a loss of reliability with regard to the exact reason for the procedure. However, considering the high prevalence of diabetes‑related amputations, it is reasonable to assume that the vast majority of amputations were caused by ischemic changes related to diabetes mellitus, a problem increasingly common given the rapid increase in the elderly population in Brazil, following a worldwide trend8. This might also be the explanation for the higher frequency of non‑traumatic amputations in the pres‑ ent study9,13 and the higher frequency of case‑fatalities among them. It is worth noting the possibility that attempts to preserve limbs in patients above 60 years of age might be less indicated or show less favorable results.
It is important to stress the fact that the populations used to calculate the rates for the peri‑ ods between censuses are estimates that depart from the growth observed during the decade that preceded the last census. This possibly explains the downward trend in non‑traumatic amputations observed during the census years (1990 and 2000) and those immediately following, as estimates in the years preceding the census might underestimate the actual population size. The denominator is increased when corrected according to the census count, and, therefore, the rates are reduced. This efect was more pronounced in 2000 and was more evident for non‑traumatic causes (Figure 2) and between the diferent age groups (Figure 3). The small number of amputations due to trauma makes that efect less notice‑ able among those cases (Figure 2).
In 2002, the São Paulo State Department of Health launched a project to distribute med‑ ications for the control of chronic diseases. In 2005, The National Department of Health launched a similar project that came into efect in 2007 with the extensive distribution of medications. A possible efect of those projects cannot yet be assessed because this research study encompassed data until 2008, and, thus, prospective evaluations, including more years of monitoring, are required16.
The inding that approximately 80% of the amputations from all causes were performed in hospitals that served patients who were covered by the SUS is consistent with data from the 2000 census of the IBGE, which indicated that 24.5% of the Brazilian population had private health system coverage16. The lower occurrence of traumatic amputations in SUS provided health care, compared to that of non‑traumatic amputations (68.8 and 80.1%, respectively), is an interesting inding for which the causes must be examined.
in the city of São Paulo increased by 50% between 2006 and 2010, and now corresponds to 21% of the total number of motor vehicles12. In the present study, the mean rate of trau‑ matic amputations in the post‑2006 period doubled in comparison to the previous period (from 1985 to 2005), increasing from 6.2 to 11.3/100,000 inhabitants per year. Data from the State System for Data Analysis Foundation (Fundação Sistema Estadual de Análise de Dados
(SEADE)) show that in 2007 deaths caused by traic accidents surpassed those caused by homicides in the capital of São Paulo17. The rate of deaths caused by motorcycle accidents increased from 0.2 to 3.4/100,000 inhabitants per year, despite the drop in mortality rates in traic from 15.3 to 9.5 deaths/100,000 inhabitants17. Had that study included the years immediately following 2008, it would have most likely detected more evidence of such an increase, which justiies new studies that include more recent years.
The hypothesis that greater clinical control of chronic diseases and the increase in urban violence could lead to changes in the proportions of amputations from traumatic and non‑trau‑ matic causes was not conirmed during the study period. However, recent events are likely to afect amputation rates in the coming years. The new government policies to control diabetes have the potential to reduce disease complications and diabetes‑related amputations. Conversely, the increasing use of motorcycles in large urban areas, which has led to increased numbers of severe lower‑limb trauma cases, might be accompanied by higher amputation rates. Given the relevance of this topic, such events should be carefully monitored in the future, and data from the present study might serve as a baseline for future comparisons that have already been planned from information routinely collected by the CPDH.
CONCLUSIONS
The overall rates of amputation and the rates of traumatic and non‑traumatic ampu‑ tations remained nearly constant during the study period. These rates did not accompany the increasing traic‑related deaths rates neither the aging of the population. The impact of diabetes control policies and the introduction of traic safety laws could not be identi‑ ied on the amputation rates. The growing trend of traumatic amputation rates observed after 2006 and its relation to the motorcycle leet increase deserves more detailed studies.
1. Cassefo V, Nacaratto DC, Chamliant R. Perfil epidemiológico dos pacientes amputados do Lar Escola São Francisco – Estudo comparativo de 3 períodos diferentes. Acta Fisiátrica 2003; 10(2): 67‑71. Portuguese.
2. Zanni GR, Wick JY. Understanding amputation. Consult Pharm 2008; 23(12): 944‑8.
3. Harness N, Pinzur MS. Health related quality of life in dysvascular transtibial amputation. Clin Orthop 2001; 383: 208‑13.
4. Spichler ERS, Spichler D, Lessa I, Costa e Forti A, Franco LJ, LaPorte RE. Capture‑recapture method to estimate lower extremity amputation rates in Rio de Janeiro, Brazil. Rev Panam Salud Publica 2001; 10(5): 334‑40.
5. Tooms RE. General principles of amputation. In: Campbell WC. Campbell’s operative orthopedics. 7th
ed. New York: Mosby; 1987. p.180‑187.
6. Spichler D, Miranda F, Spichler ERS, Franco LJ. Major lower extremity amputations related to peripheral arterial disease and diabetes mellitus in the city of Rio de Janeiro. J Vasc Br 2004; 3(2): 111‑22.
7. Caromano FA, Castelucci P, Lebre LPM, Takahashi SY, Tanaka C. Incidence of lower limb amputation, one side: medical history analisis. Rev Ter Ocup 1992; 3(1/2): 44‑53. Portuguese.
8. Ikonen TS, Sund R, Venermo M, Winell K. Fewer major amputations among individuals with diabetes in Finland in 1997‑2007: a population‑based study. Diabetes Care 2010; 33(12): 2598‑603.
9. Reiber GE. The epidemiology of diabetic foot problems. In: Bowker JO, Pfeifer MA. Levin and O’Neal’s The Diabetic Foot. 6th ed. Rio de Janeiro: Di‑ Livros Editora; 2001. p.13‑23.
10. Schoield CJ, Yu N, Jain AS, Leese GP. Decreasing amputation rates in patients with diabetes‑ A population‑based study. Diabet Med 2009; 26: 773‑7.
11. Krishnan S, Nash F, Baker N, Fowler D, Rayman G. Reduction in diabetic amputations over 11 years in a deined U.K. population. Beneits of multidisciplinary team work and continuous prospective audit. Diabetes Care 2008; 31(1): 99‑101.
12. Município de Ribeirão Preto. Empresa de Trânsito e Transporte Urbano (Transerp). Estatísticas de acidentes
de trânsito [on‑line]. [Accessed in March 2012]. Available at: http:// www.ribeiraopreto.sp.gov.br/transerp/.
13. Brasileiro JL, Oliveira WTP, Monteiro LB, Chen J, Pinho Jr EL, Molkenthin S, Santos MA. Diabetic foot: Clinical aspects. J Vasc Br 2005; 4(1): 11‑21. Portuguese.
14. Instituto Brasileiro de Geograia e Estatística (IBGE). Censos de 1980 a 2010 e estimativas preliminares para os anos intercensitários dos totais populacionais, estratificadas por idade e sexo pelo MS/SGEP/ DATASUS [on‑line]. [Accessed in March 2012]. Available at: http://www.ibge.gov.br.
15. Estado de São Paulo. Secretaria da Saúde. Programa de dispensação de insumos para diabetes. [Accessed in March 2012]. Available at: http://www.saude. sp.gov.br/ses/acoes/assistencia‑farmaceutica/ programa‑de‑dispensacao‑de‑insumos‑para‑diabetes
16. Instituto Brasileiro de Geograia e Estatística (IBGE). Censo 2000 [on‑line]. [Accessed in March 2012]. Available at: http://www.ibge.gov.br.
17. Fundação Sistema Estadual de Análise de Dados (SEADE). Acidentes de transporte passam a ser a principal causa de mortes não natural do Estado de São Paulo [on‑line]. [Accessed in March 2013]. Available at: http://www.seade.gov.br/produtos/spdemog/ mar2010/spdemog_mar2010.pdf
Received on: 05/09/2014