Letícia Maria Sousa Fernandes
Bachelor Degree in Biomedical Engineering SciencesLearning Human Behaviour Patterns by
Trajectory and Activity Recognition
Dissertation submitted in partial fulfillment of the requirements for the degree of
Master of Science in
Biomedical Engineering
Adviser: Doutor Hugo Filipe Silveira Gamboa, Assistant Professor, NOVA School of Science and Technology, NOVA University of Lisbon
Examination Committee
Chairperson: Doutor Ricardo Nuno Pereira Verga e Afonso Vigário Raporteur: Doutor Ricardo da Costa Branco Ribeiro Matias
Learning Human Behaviour Patterns by Trajectory and Activity Recognition Copyright © Letícia Maria Sousa Fernandes, Faculty of Sciences and Technology, NOVA University Lisbon.
The Faculty of Sciences and Technology and the NOVA University Lisbon have the right, perpetual and without geographical boundaries, to file and publish this dissertation through printed copies reproduced on paper or on digital form, or by any other means known or that may be invented, and to disseminate through scientific repositories and admit its copying and distribution for non-commercial, educational or research purposes, as long as credit is given to the author and editor.
Ac k n o w l e d g e m e n t s
The accomplishment of this important stage of my academic life would not be possible without the support of several people who were always with me during these past few years.
First of all, I would like to express my gratitude to my adviser, Professor Hugo Gamboa, for giving me the opportunity of developing my Master thesis under his guidance and for all his advice and insights. Thank you for introducing me to the wonderfulness of the world of data science and signal processing. I would like to thankAssociação Fraunhofer Portugal Research for giving me the opportunity of developing my thesis on their facilities, for the amazing environment and for allowing me to participate in different projects that lead to my professional growth. I will be eternally grateful to the person who followed me up during this journey, Marília Barandas, thank you for being always available to clarify my doubts, for the transmitted knowledge about data science, for all the patience, guidance and for the unconditional support during the most stressful times of this thesis. Thank you! I am also grateful to Ricardo Leonardo for all the availability to clarify my doubts, for all the suggestions and for sharing deep learning knowledge. For everyone at the Lisbon office, thank you, especially to my master thesis colleagues for making this journey much more fun.
For those who lived with me at RUFS, thank you for all the great moments, adventures, dinners and parties that we experience together. To the friends that I carry always in my heart from my lovely home, thank you for being always there for me. To the person who always accompanied me during this past 5 years, that always had my back during the bad and good moments of this journey, always ready to cheer me up when I most needed, my study-mate, room-mate, cooking-mate, my deepest friendship, Ana Elisa Oliveira, my sincere thanks, without you this would, certainly, not be the same. I would also like to express my gratitude to Sérgio Gonçalves, for being always present in the most important times of my life, for all the support, care and dedication for making me a happier person.
To the people responsible for who I am today, my parents, you always did your best for giving me all the opportunities that I had during my whole life, thank you for transmitting me important values such as effort, dedication, respect and modesty. Thank you for all the love. Finally, to my two annoying sisters, thank you for making me the strong person that I am today, for the role-model, for always being there for me when I needed the most and for believing that I was capable of getting here.
A b s t r a c t
The world’s population is ageing, increasing the awareness of neurological and behavioural impairments that may arise from the human ageing. These impairments can be mani-fested by cognitive conditions or mobility reduction. These conditions are difficult to be detected on time, relying only on the periodic medical appointments. Therefore, there is a lack of routine screening which demands the development of solutions to better assist and monitor human behaviour. The available technologies to monitor human behaviour are limited to indoors and require the installation of sensors around the user’s homes presenting high maintenance and installation costs. With the widespread use of smart-phones, it is possible to take advantage of their sensing information to better assist the elderly population. This study investigates the question of what we can learn about hu-man pattern behaviour from this rich and pervasive mobile sensing data. A deployment of a data collection over a period of 6 months was designed to measure three different human routines through human trajectory analysis and activity recognition comprising indoor and outdoor environment. A framework for modelling human behaviour was developed using human motion features, extracted in an unsupervised and supervised manner. The unsupervised feature extraction is able to measure mobility properties such as step length estimation, user points of interest or even locomotion activities inferred from an user-independent trained classifier. The supervised feature extraction was de-sign to be user-dependent as each user may have specific behaviours that are common to his/her routine. The human patterns were modelled through probability density func-tions and clustering approaches. Using the human learned patterns, inferences about the current human behaviour were continuously quantified by an anomaly detection algorithm, where distance measurements were used to detect significant changes in be-haviour. Experimental results demonstrate the effectiveness of the proposed framework that revealed an increase potential to learn behaviour patterns and detect anomalies. Keywords: Human Behaviour, Pattern Recognition, Anomaly Detection, Ambient As-sisted Living, Probability Density Function, Clustering
R e s u m o
A população mundial está a envelhecer, o que aumenta a conscientização de imparidades neurológicas e comportamentais que podem surgir com o envelhecimento humano. Estas imparidades podem se manifestar através de condições cognitivas ou da redução da mobi-lidade, sendo dificilmente detetadas a tempo, quando dependentes de consultas médicas periódicas. Portanto, existe falta de monitorização da rotina humana, o que exige o desen-volvimento de soluções que permitam assistir e monitorizar o comportamento humano. As tecnologias disponíveis são limitadas a espaços interiores, e requerem a instalação de sensores no interior da casa dos utilizadores, o que apresenta elevados custos de manuten-ção e instalamanuten-ção. A ampla utilizamanuten-ção dos telemóveis, tornou possível o aproveitamento dos seus sensores para assistir a população envelhecida. Este estudo investiga a questão de o que podemos aprender do comportamento humano a partir da informação rica dos sen-sores dos telemóveis. Ao longo de um período de 6 meses foram adquiridos dados de três rotinas humanas diferentes, através da análise da trajetória e do reconhecimento humano, compreendendo espaços interiores e exteriores. Foi desenvolvida uma ferramenta para modelar o comportamento humano que permite extrair características do movimento humano de uma forma não-supervisionada e supervisionada. A extração não supervisio-nada consiste na medição de propriedades da mobilidade, tal como, o comprimento do passo, os pontos de interesse, ou atividades da locomoção do utilizador, inferidas através de um classificador de atividades que não depende do utilizador. A extração supervi-sionada foi projetada para ser dependente do utilizador, visto que, cada utilizador tem comportamentos específicos que são comuns à sua rotina. Através dos padrões humanos aprendidos, o comportamento inferido foi quantificado de forma contínua, através de um algoritmo para a deteção de anomalias, onde uma medida de distância foi utilizada para detetar alterações significativas no comportamento humano. Resultados experimentais demonstraram a eficiência da ferramenta desenvolvida, revelando um elevado potencial para aprender padrões no comportamento humano e para detetar anomalias.
Palavras-chave: Comportamento Humano, Reconhecimento de Padrões, Deteção de Ano-malias, Ambiente de Vida Assistida, Função Densidade de Probabilidade, Agrupamento
C o n t e n t s
List of Figures xiii
List of Tables xvii
Acronyms xix
1 Introduction 1
1.1 Motivation . . . 1
1.2 Applications . . . 2
1.3 Literature Review . . . 3
1.3.1 Human Activity Recognition . . . 3
1.3.2 Location Technologies . . . 4 1.3.3 Motion Patterns . . . 4 1.3.4 Anomaly Detection . . . 5 1.3.5 Summary . . . 6 1.4 Objectives . . . 7 1.5 Document Structure . . . 7 2 Theoretical Background 9 2.1 Human Behaviour . . . 9
2.1.1 Motion patterns discovery . . . 10
2.1.2 Anomaly detection . . . 11
2.2 Motion detection using pervasive sensing . . . 12
2.2.1 Human Activity Recognition . . . 12
2.2.2 Location Technologies . . . 12 2.2.3 Smartphone Sensors . . . 15 2.3 Machine Learning . . . 16 2.3.1 Pre-processing . . . 17 2.3.2 Feature Extraction . . . 18 2.3.3 Feature Selection . . . 18 2.3.4 Classification . . . 19 2.3.5 Validation . . . 24 2.4 Similarity distances . . . 26
C O N T E N T S
2.4.1 Euclidean Distance . . . 26
2.4.2 Dynamic Time Warping . . . 26
2.4.3 Subsequence - Dynamic time Warping . . . 28
3 Framework for Learning Human Patterns Behaviour 29 3.1 Feature Extractor . . . 30
3.1.1 Unsupervised Feature Extraction . . . 30
3.1.2 Supervised Feature Extraction . . . 33
3.2 Pattern Discovery . . . 36
3.2.1 Kernel Density Estimation . . . 37
3.2.2 Clustering . . . 38
3.3 Anomaly Detection . . . 40
3.3.1 Anomalies in distributions . . . 41
3.3.2 Anomalies in clustering . . . 43
4 Results and Discussion 45 4.1 Signal Acquisition . . . 45
4.1.1 Annotation Procedure . . . 46
4.1.2 Sensor Placement . . . 46
4.1.3 Ethical and privacy considerations . . . 47
4.2 Human mobility on daily walks dataset . . . 47
4.2.1 Feature Extractor . . . 48
4.2.2 Pattern Discovery . . . 55
4.2.3 Anomaly Detection . . . 61
4.3 Morning daily living routine dataset . . . 62
4.3.1 Feature Extractor . . . 63
4.3.2 Patterns Discovery . . . 67
4.3.3 Anomaly Detection . . . 69
4.4 Lunchtime routine dataset . . . 71
4.4.1 Pattern Discovery . . . 72
4.4.2 Anomaly Detection . . . 74
5 Conclusion and Future Work 77 5.1 Conclusions . . . 77
5.2 Future Work . . . 78
Bibliography 79
A TSFEL Features Description 89
B Informed Consent to Participants 93
L i s t o f F i g u r e s
1.1 Percentage of population aged over 60 years by region, from 1980 to 2050. . 1
1.2 Document structure overview . . . 7
2.1 Representation of partitioned trajectories with outlying t-partitions identified. 11 2.2 Illustration of the lateration technique. . . 14
2.3 Illustration of the angulation technique. . . 14
2.4 Wi-Fi RSSI map of an office building. . . 15
2.5 Smartphones coordinate system. . . 16
2.6 Machine learning classification architecture. . . 17
2.7 Hidden Markov Models chain representation. . . 20
2.8 Representation of a dendrogram and corresponding clusters. . . 22
2.9 Representation of a core, border and noise points according to DBSCAN. . . 22
2.10 Illustration of symmetric kernel functions. . . 24
2.11 Euclidean Distance between two time series. . . 26
2.12 Dynamic Time Warping between two time series. . . 27
3.1 Framework overview representation. . . 29
3.2 Process for correcting GPS trajectories. . . 31
3.3 Modelled feature using KDE. . . 37
3.4 Trajectory similarity representation using DTW distance. . . 38
3.6 Learning patterns continuously and anomaly detection fluxogram. . . 41
3.7 Illustration of a KDE distribution with likely and unlikely measurements rep-resented. . . 42
3.8 Clustering approaches illustration. . . 43
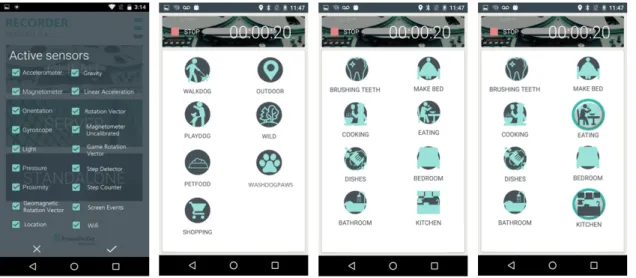
4.1 Recorder application mobile layout. . . 46
4.2 Sensors placement. . . 47
4.3 Playing with the dog, washing the dog paws and feeding the dog activities acqui-sition time. . . 48
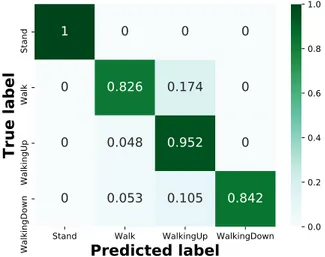
4.4 Normalised confusion matrix of locomotion recognition activities using DT classifier. . . 50
4.5 Post-processing illustration by majority voting. . . 51
L i s t o f F i g u r e s
4.7 Normalised confusion matrix for routine activities classification, using KNN classifier, after post-processing. . . 52 4.8 Search for the ideal number of hidden states through BIC. . . 53 4.9 Illustration of the searchedwashing the dog paws activity before and after the
application of a smoothing filter. . . 54 4.10 Illustration of the 8 found subsequences in the search forwashing the dog paws
activity. . . 54 4.11 Human mobility on daily walks activities duration distribution using true and
predicted labels. . . 56 4.12 Locomotion percentage time distribution from human mobility on daily walks
dataset. . . 57 4.13 Illustration of the walk time, walk distance, number of steps and step length
distributions from human mobility on daily walks dataset. . . 57 4.14 Velocity and altitude variation distributions from human mobility on daily
walks dataset. . . 58 4.15 Log-likelihood distributions for true and predicted activities sequences from
human mobility on daily walks dataset. . . 58 4.16 Representation of the trajectory clusters by spatial similarity from human
mobility on daily walks dataset. . . 60 4.17 Illustration of the points of interest from human mobility on daily walks
dataset. . . 60 4.18 Sensory signatures location from human mobility on daily walks dataset. . . 61 4.19 Anomaly detection representation from human mobility on daily walks dataset. 62 4.20 Making the bed, cooking, eating, washing the dishes and brushing teeth activities
acquisition time. . . 63 4.21 Normalised confusion matrix of a room-level indoor location recognition. . . 65 4.22 Representation of the activities location correspondence. . . 66 4.23 Normalised confusion matrix for morning daily living routine activities
clas-sification, using RF classifier, after post-processing. . . 66 4.24 Horizon plot of morning daily living routine activities. . . 66 4.25 Morning daily living routine activities duration distribution using true and
predicted labels. . . 67 4.26 Illustration of the distribution of the time spent in each location from true and
predicted labels. . . 68 4.27 Locomotion percentage time distribution on morning daily living routine
dataset. . . 69 4.28 Illustration of number of steps and step length distributions on morning daily
living routine dataset. . . 69 4.29 Log-likelihood distributions for true and predicted activities and location
se-quences on morning daily living routine dataset. . . 70 xiv
L i s t o f F i g u r e s
4.30 Anomaly detection using true and predicted labels for morning daily living dataset. . . 71 4.31 Locomotion percentage time distribution on lunchtime routine dataset. . . . 72 4.32 Illustration of the walk time, walk distance, number of steps and step length
distributions from lunchtime routine dataset. . . 73 4.33 Velocity and altitude variation distributions from lunchtime routine dataset. 73 4.34 Representation of the trajectory clusters by spatial similarity from lunchtime
routine dataset. . . 74 4.35 Illustration of the points of interest from lunchtime routine dataset. . . 74 4.36 Anomaly trajectories detection from lunchtime routine dataset. . . 75 4.37 Individual anomaly trajectory detection from lunchtime routine dataset. . . 75
L i s t o f Ta b l e s
2.1 Confusion Matrix representation. . . 25
4.1 Human mobility on daily walks dataset information. . . 49
4.2 Accuracy of machine learning classifiers for simple activities recognition. . . 49
4.3 Results of supervised learning classifiers tested in all days of the user from human mobility on daily walks dataset, in terms of accuracy and F1-score before and after post-processing. . . 51
4.4 Results of the activity search algorithm tested in 41 days. . . 55
4.5 Results of HMM training with the true and predicted activities from human mobility on daily walks dataset. . . 59
4.6 Morning daily living routine dataset information. . . 64
4.7 Results of supervised learning classifiers tested in all days of the morning daily living routine dataset in terms of accuracy and F1-score before and after post-processing. . . 65
4.8 Results of HMM training with the true and predicted activities from morning daily living routine dataset. . . 70
4.9 Lunchtime routine dataset information. . . 72
A.1 Temporal domain features implemented in TSFEL. . . 89
A.2 Spectral domain features implemented in TSFEL. . . 90
Ac r o n y m s
ADA AdaBoost.
ADLs Activities of Daily Living.
AP Access Point.
AUC Area Under the Curve. BIC Bayesian Inference Criterion. BSSID Basic Service Set Identifier.
CHMM Continuous hidden markov model.
DBSCAN Density-based spatial clustering of applications with noise.
DR Dead Reckoning.
DT Decision Tree.
DTW Dynamic Time Warping. ED Euclidean Distance. EMD Earth Mover’s Distance. GPS Global Positioning System. HAR Human Activity Recognition.
AC R O N Y M S
HDBSCAN Hierarchical Density-based spatial clustering of applications with noise. HMM Hidden Markov Models.
KDE Kernel Density Estimate. KNN K Nearest Neighbor.
LCS Longest Common Sequence. LDA Latent Dirichlet Allocation.
MFCC Mel Frequency Cepstral Coefficients.
ML Maximised Likelihood.
NARX Non-linear Autoregressive netwoRk with eXogenous.
NB Naive Bayes.
POI Points of Interest.
RF Random Forest.
RNN Recurrent Neural Networks.
ROC Receiver Operating Characteristics. RSSI Received Signal Strength Indicator. S-DTW Subsequence-DTW.
SVM Support Vector Machine. TOI Times of Interest.
AC R O N Y M S
C
h
a
p
t
e
r
1
I n t r o d u c t i o n
1.1
Motivation
The increase in life expectancy leads to the ageing population growing worldwide. Ac-cording to United Nations [1], the global population over 60 years in 2017 was more than twice as large as in 1980, and the number of elderly people is expected to double again in 2050, as it can be seen in Figure 1.1. As a consequence, common health conditions associated with ageing, that affects human behaviour, such as physical declining, psycho-logical and cognitive alterations are increasing. This is the case of people suffering from dementia that according to the World Alzheimer report of 2018 [2], 50 million people worldwide were living with dementia in 2018 and the estimation is to increase to 152 million in 2050.
Physical declining of elderly people is observed through the decrease of walking speed, mobility disability that is associated with falls, social isolation, difficulty in performing
Africa Oceania Asia Latin America and the Caribbean Northern America Europe World Estimates Projections Pr opor tion aged 60 y ears (per cen tage) 1980 1990 2000 2010 2020 2030 2040 2050 0 5 10 15 20 25 30 35
Figure 1.1: Percentage of population aged over 60 years by region, from 1980 to 2050. Adapted from [1].
C H A P T E R 1 . I N T R O D U C T I O N
activities of daily living such as cooking, using the toilet and dressing. On the other hand, cognitive alterations, that includes cognitive ageing, dementia and depression are more difficult to be detected in early stages of the disease [3]. For example, early symptoms of dementia that include memory impairment, may not be detected by doctors in periodical visits, given that there is a lack of routine screening. So the role of the caregiver is very important for the early diagnosis of these health conditions [4]. However, a significant portion of these people live home alone [5], and it may be difficult to either detect and monitor the disease leading to its progression. Thus, a reliable tool for learning more about the person’s daily living for helping the diagnose and follow-up these impairments is needed. The assessment of human behaviour is the basis for understanding people’s needs and problems, subsequently, helping them improve their lives. Human behaviour tends to promote well-defined motions which are repeated every day, suchlike trajec-tory patterns and sequences of performed activities. With the widespread of technology, specifically smartphones, it is possible to recognise human motions and to monitor hu-man daily routines, since they possess multiple accurate sensors to better assist huhu-mans. Moreover, smartphones allow the monitoring of routines in a cheap and unobtrusive way.
1.2
Applications
The understanding of human behaviour patterns has a considerable impact in health-care [6], however, it has other meaningful applications such as marketing analysis, secu-rity and even tourist management.
• Health-Care
In healthcare, the analysis of human behaviour is important for understanding changes in behaviour that are associated with different health conditions such as dementia, depression, memory loss or even unhealthy daily habits. The quantifi-cation of these changes can assist doctors to diagnose diseases or even evaluate its progression.
• Marketing
In the marketing point of view, companies intent to influence consumers to buy their products, to do so, they need to understand people’s needs, what are the kind of products do they buy, at which specific times and places [7]. For the improvement of marketing strategies, it is important the understanding of consumers behaviour to describe the several types of consumers, predict their behaviour and thus to develop marketing strategies that are directly constructed to affect each particular behaviour.
• Security
The analysis of human behaviour for security purposes has a significant role to guarantee the well being of society. This analysis allows to find patterns of normal
1 . 3 . L I T E R AT U R E R E V I E W
human behaviours and from these patterns detect suspicious behaviours potentially indicative of terrorism, robberies or even cyberattacks [8, 9].
• Tourist Management
Understanding tourist behaviour by mobility patterns is a key goal in tourist man-agement, as understanding the favourites places visited by tourists may be impor-tant for marketing purposes, urban planning and transportation [10].
1.3
Literature Review
The focus of this study is to learn human motion patterns on an everyday basis by human trajectory analysis and activity recognition, that are detected by several sensors embedded in smartphones. In the following, the related work regarding activity recognition, location technologies, human patterns and anomaly detection is reviewed.
1.3.1 Human Activity Recognition
In the context of activity recognition using smartphones, the available studies in the literature are mainly divided into simple and complex activities. Simple activities are focused on recognising locomotion activities such aswalking, standing, sitting, walking up andwalking down. The complex ones are more concerned in detecting activities such as brewing coffee, cooking, taking shower, teeth brushing, among others. For human behaviour analysis, both simple and complex activities will be addressed in this study.
Regarding simple activities, Ronao et al. [11], by stating that activities are hierarchical, proposed a two-stage Continuous hidden markov model (CHMM) using accelerometer and gyroscope data from a smartphone to recognise six human activities (walking, walk-ing up, walkwalk-ing down, sittwalk-ing, standwalk-ing, lywalk-ing). Although several classification methods were tested during this study, CHMM showed competitive performance and low errors, resulting in an accuracy of 91.76%. Chernbumroong et al. [12] proposed a study for the recognition of five human activities (standing, lying, walking and running) using a single wrist-worn accelerometer. By selecting a total of 13 features from temporal and frequency domain, the highest accuracy obtained was 94% using a Decision Tree (DT) classifier. San-tos [13] focus on detecting 10 complex activities, suchlikeopening a door, brushing teeth andtyping the keyboard. The developed framework uses signals from accelerometer, gyro-scope, magnetometer and microphone sensors, and the classifier was based on multiple hidden Markov models, one per activity. The developed solution was evaluated in the offline context, where it achieved an accuracy of 84±4.8%. Shoaib et al. [14] evaluated the performance of combining wrist and pocket positioning motion sensors for recognising both simple and complex activities with seven different windows sizes by using K Nearest Neighbor (KNN), DT and Naive Bayes (NB) classifiers. They concluded that for complex activities the recognition performance is increased with increasing window size and the three classifiers presented similar behaviours.
C H A P T E R 1 . I N T R O D U C T I O N
1.3.2 Location Technologies
For the purpose of detecting trajectories at the outdoor level the most common method is Global Positioning System (GPS). However, it is not a feasible solution for indoor location because inside buildings the GPS signal is attenuated by the building structure. In the last two decades, the effort from the scientific community to develop a robust and precise indoor location system resulted in a large number of solutions. Indoor location systems can be divided into infrastructure-free and infrastructure-based. The most common sources of information about infrastructure-based solutions are radio frequency signals, such as Bluetooth, ultrasounds or light [15]. Normally, the used infrastructure transmits a specific signal to the device being located. On the other hand, infrastructure-free solutions use opportunistic readings from signals that are pervasively available in the majority of environments, like a magnetic field, atmospheric pressure, ambient light, Wi-Fi or sound [16, 17, 18].
An example of an infrastructure-free solution is the study conducted by Guimarães et al. [16] that relies on a human motion tracking algorithms combined with an oppor-tunistic sensing mechanism. The human motion tracking algorithm is based on multiple gait-model based filtering techniques that include sensor fusion, movement detection, direction of movement and floor changes detection. The evaluation process resulted in overall median localisation errors between 1.11m and 1.68m. Leornardo et al. [18] devel-oped a framework for determining the user’s location through the sound recorded by the user’s device. The proposed algorithm for room-level location purposes used a Support Vector Machine (SVM) classifier and obtained an accuracy of 90%.
1.3.3 Motion Patterns
A pattern is defined as regularity in data, for instance, when data elements are repeated predictably. The search for patterns is a common subject in a variety of engineering and scientific areas [19]. The pattern discovery that is dedicated to learning motion patterns is the focus of this study since motion patterns can be used to infer about human behaviour. Common human behaviour can be found either in trajectory or activity recognition. In the following, some studies that find human motion patterns through trajectory or activity recognition are described.
Zheng et al. [20] proposed a heuristic method combining Dynamic Time Warping (DTW) and Earth Mover’s Distance (EMD) to understand tourist mobility through the measurement of trajectory similarity. Trajectory similarity was calculated based on the weighted sum of spatial and temporal similarity, and types of tourist trajectory were ob-tained through KNN algorithm. The resulting method proved to be accurate and noise resistant. Shou and Di [21] created a methodological framework to analyse the similarity of activity patterns using multi-person multi-day GPS trajectories, which helps to ana-lyze people’s frequent travel patterns. Pattern similarity was measured using the Longest Common Sequence (LCS) and hierarchical clustering was applied to obtain clusters based
1 . 3 . L I T E R AT U R E R E V I E W
on a dissimilarity measure, without the need of a predefined cluster number. This work presents some limitations because temporal-spatial information is not considered. Mah-moud et al. [22] used Recurrent Neural Networks (RNN) to identify behavioural patterns, based on activity recognition, in an intelligent environment constituted by binary sensors from which data is converted to temporal sequences of activities. By comparing two models of RNN , Non-linear Autoregressive netwoRk with eXogenous (NARX) inputs and Elman network, it was concluded, by the authors, that NARX performed better than Elman network to predict and extract behavioural patterns. The study conducted by Farrahi and Gatica-Perez [23] discovers human routines, characterising both individual and group behaviours, using location data collected by mobile phones in an unsuper-vised manner. This study uses topic models that are probabilistic generative models for documents. An individual’s day is represented by a bag of location sequences (or words) that is the histogram of the location sequence present in the day, these bags consider location transitions and fine-grain, coarse-grain time considerations. These bags are used as an input for topic models including Latent Dirichlet Allocation (LDA) that is used to find routine patterns characteristic of all days in the dataset, and author topic model that discovers routines of individual users considering the user identity.
1.3.4 Anomaly Detection
Anomalies are characterised as a non-conformity of the expected behaviour that follows a specific pattern. Anomalies detection is an important subject matter, and it is widely used for fraud detection, health-care, intrusion detection or even military surveillance [24]. Hence, besides learning motion patterns, some authors focus on detecting anomalies.
Suzuki et al. [25] proposed an unsupervised learning method to learn motion patterns and detect anomalies by the analysis of human trajectory recorded in a real store by cam-eras. Hidden Markov Models (HMM) were used to model spatial and temporal features of trajectory to detect patterns and anomalies. Through probabilistic distances between HMM the method detects anomalies and classifies several behaviour patterns. Trajecto-ries were projected onto a low-dimensional space applying Multi-Dimensional Scaling and grouped using the k-means clustering method. The result of clustering showed trajectory patterns, and those trajectories whose maximum likelihood of clusters was smaller than a certain threshold was considered an anomaly. Forkan et al. [26] developed a context-aware change detection model using machine learning and statistical models. This study models behaviour through daily activity and vital signals. They created a HMM to detect anomalies in sequences of daily activities in an ambient assisted living. To detect behavioural changes in a user’s lifestyle related to the time duration of activities or activities frequency a statistical model measuring Gaussian distribution of activities was used. To detect increasing or decreasing trend of vital signals a Holt’s linear trend method was implemented. By combining anomalies from all domains they obtained a final decision either is a true anomaly or not using a fuzzy rule-based model categorised
C H A P T E R 1 . I N T R O D U C T I O N
in four stages including normal, warning, alert and emergency. A study conducted by Tomforde et al. [27] developed models to learn the user’s behaviour in a health enabling living environments equipped with multiple sensors, by detecting the user’s location and activities sequences. Two multinomial HMM were trained with the normal course of the user’s days, the first relying on the user’s location sequence and the second the user’s activities sequence using the locations as hidden states. The resulting log-likelihood of the HMM were modelled into a Kernel Density Estimate (KDE) to signalise a deviation from the expected normal behaviour pattern.
An interesting technology that has been developed in the field of human behaviour modelling is Hive Link1. Hive Link is a recent innovating solution developed by Centrica Hive Limited that provides a home service that allows caregivers to check in and detect deviations on a person’s routine. This smart service involves the prior installation of smart-plugs and sensors around the home, that use pattern detection to get to know the person’s routine and detect any changes. The system takes seven days to learn a person’s routine and has the capability of getting smarter with experience. The system also com-prises a Hive app where caregivers can check the activity log and receive notifications if the person is not following their usual routine. Hive Link is an inspiring solution for this study because of its focus on finding out patterns and deviations from a person’s routine. However, the solution that is going to be developed in this study presents some advantages compared to Hive Link. Firstly, the use of data from smartphone/wearable sensors to model behaviour patterns, decreases the maintenance costs, since, there is no need for installation of sensors around home. Secondly, the Hive Link solution is limited to indoors and the covered area by the installed sensors. This study extends the range of application to outdoors and uses a large number of metrics (both indoors and outdoors) that can be applied in different contexts such as health-care, security or management. 1.3.5 Summary
The widespread use of mobile devices is producing a huge amount of data, making the discovery of human actions, activities and interactions possible. The challenge now is no longer that of obtaining data, but that of using these vast amounts of data from different sources and recognising patterns that could give us a better understanding of human behaviour. Although there are some studies in the literature about modelling human behaviour, the people’s behaviour changes are often hard to quantify. Moreover, the aggregation of both activity recognition and trajectory analysis remains relatively unexplained. Furthermore, most of the studies that found patterns by activity recognition rely on the installation of sensors around the home, which presents higher installation and maintenance cost compared to the use of smartphone sensors that are going to be used in this study. Finally, with this study, it will be evaluated the possibility to detect and quantify anomalies in humans routines by continuously learning their daily patterns.
1Available in https://www.hivehome.com/services/connected-care-hive-link (visited on 27/02/2019)
1 . 4 . O B J E C T I V E S
1.4
Objectives
The main goal of this study is to develop a solution for learning human behaviour patterns by the analysis of trajectory and activity recognition. For reaching this goal, models for learning human behaviour patterns, to classify and quantify changes in human behaviour considering the learned behavioural patterns are proposed. We also intend to explore the extraction of relevant features suitable for learning a wide variety of human behaviour patterns through an unsupervised manner, i.e. features that can be extracted without the need for any annotation effort, and a supervised manner, once more detailed information about the human daily living is required.
The main goals are the following: (1) conduct a deep exploration of how smartphone’ sensors can be used to extract information about human behaviour; (2) design and acquire a complete and extensive dataset of human routines comprising different challenges, such as indoor or outdoor environment; (3) create an algorithm to extract human motion features through unsupervised and supervised methods; (4) develop a framework to learn and model human behaviour using the extracted features; (5) propose an unsupervised anomaly detection algorithm for an earlier detection of human behaviour changes.
By modelling human behaviour it will be possible to help in the early diagnosis of pathologies that cause changes in behaviour, providing timely treatment and improving quality of life.
1.5
Document Structure
The document structure is divided into five chapters as illustrated in Figure 1.2. The first chapter is the introduction starting with this study motivation, real-context appli-cations, the literature review, and the study objectives. The second chapter addresses the theoretical background needed for the development of this study. The third chapter contains a detailed description of the implemented framework for learning human be-haviour patterns. The fourth chapter regards the main results achieved by evaluating real case scenarios using the developed framework. The fifth and last chapter comprises these study conclusions and future work.
Document Structure Introduction Theoretical
Background Framework Results Conclusion
Figure 1.2: Document structure overview. The document comprises five chapters namely the introduction, theoretical background, framework, results and conclusion.
C
h
a
p
t
e
r
2
T h e o r e t i c a l Ba c k g r o u n d
This chapter contains the essential theoretical background to develop this project, it is composed by four sections. The first section includes the description of human behaviour, and motion patterns and anomalies detection concepts. The second section presents some notions of activity recognition and location technologies, followed by the description of smartphone sensors that are going to be used in this study. The third embraces machine learning concepts that are going to be used for learning human behaviour patterns. The fourth and last section comprises similarity measures.
2.1
Human Behaviour
Understanding human behaviour is not a trivial task, as it is stated by Skinner [28] "Be-haviour is a difficult subject matter, not because it is inaccessible, but because it is ex-tremely complex. Since it is a process, rather than a thing, it cannot easily be held still for observation.". Human behaviour is defined as the response of an individual to internal or external stimuli, involving cognition, emotion and executive functions.
Cognitive Functions:Cognition refers to functional proprieties of an individual that may be inferred from behaviour, namely receptive functions that corresponds to the in-dividual capability to acquire, classify and integrate information, memory and learning functions referring to information storage and retrieval, thinking that involves mental or-ganisation and reoror-ganisation of information, and expressive functions that are defined as how the information is communicated or acted upon. Cognitive impairments are related to the degree of consciousness of the person, the attention level and the activity rate that affects the speed of mental processes and consequently the speed of motor responses [29].
C H A P T E R 2 . T H E O R E T I C A L BAC KG R O U N D
and motivations. Impairments in these functions are usually associated with brain in-juries and the most severe impairments may be related to brain diseases. Emotional and personality changes are dependent on the severity of the brain impairments. Direct effects of brain injuries include disinhibition, diminution of anxiety and mild eupho-ria. Profound emotional and personality changes involve chronic frustration and radical changes in lifestyle, these changes are usually expressed by human depression [29].
Executive Functions:Executive functions correspond to the capabilities that enable humans to have independent, purposive and self-serving behaviour. Obvious defects of executive functions are the ones that are observable by naive persons, for example, emotional lability, irritability or excitability. The most serious defects are the ones that may be missed or not recognised by experts due to the lack of routine monitoring of these patients. These defects include the impaired capacity to initiate an activity, decreased or absent motivations and defects in planning and carrying out the sequence of activities that express high-level behaviours [29].
To assess human behaviour it is important to understand that human behaviour also relies on subject variability, where humans in the same situation can take different actions. Human behaviour variability may be influenced by cultural, ecological, socio-political and education contexts, and by biological and genetic transmissions [30]. Variability types are divided into variability within-subject and across-subject. Within-subject variability corresponds to a situation where an individual takes different actions at different times in the same situation. Across-subject variability refers to different actions taken by two different people in the same circumstance [31].
Human behaviour variability increases the complexity of this study because humans do not always behave in the same way. Therefore, one human may have multiple be-haviour patterns and the bebe-haviour patterns found for one subject may not have the same meaning for defining if the behaviour is or not normal comparing to other subjects. It only has meaning comparing to the subject behaviour pattern. Thus, the model for finding human behaviour patterns should be learned for each subject, because each subject will have its specific behaviour patterns.
The assessment of human behaviour, in this study, is going to be done through the analysis of motion patterns that derive from responses involving cognitive, emotional and executive functions describing human behaviour.
2.1.1 Motion patterns discovery
Motion patterns are repeated observations of motion that can be used to infer about human behaviour, including patterns in trajectories and activities. Human trajectory patterns can be assessed by the similarity between trajectories, based on location, velocity between locations and permanence time in a specific place [32]. Common features used in literature for trajectory analysis are subject Points of Interest (POI) and Times of Inter-est (TOI) [33]. Measuring trajectory similarity through POI has the purpose of finding
2 . 1 . H U M A N B E H AV I O U R
Figure 2.1: Representation of a set of trajectories being partitioned into a set of t-partitions. The outlying t-partitions are identified based on the distance from neighbouring trajecto-ries [36].
specific interests of the subject being analysed in his/her normal routine. This type of analysis can be done in a more restrictive environment, such as a home, using indoor loca-tion methods. For instance, the time passed in the kitchen can give us informaloca-tion about personal interest in cooking. The motion patterns discovery can also be done on a wider scale, such as a commuting routine, using for this purpose a combination of indoor and outdoor location methods. Clustering methods are frequently used to divide trajectories into clusters of similar trajectory considering spatial or spatio-temporal similarity [34].
Motion patterns are also found in human activities, by analysing the sequence of performed activities, their duration and the number of times each activity is executed [26]. The pursuit for activity patterns is based on efficient methods in pattern data mining such as HMM to evaluate the probability of activities sequences and statistical models to evaluate duration and activities occurrence.
2.1.2 Anomaly detection
Once motion patterns are defined, it is possible to detect anomalies on those patterns that are characterised as a pattern deviation. Atallah and Yang [35] define anomalies as a deviation from learned models of behaviour and also state that classes distance can provide information about the anomaly level. Anomalous trajectories can be detected, for example, through distance [36] and clustering-based methods [37]. Distance-based outliers were defined by Knorr et al. [38] as "An object O in a dataset T is a DB(p, D)2 -outlier if at least fraction p of the objects in T lies greater than distance D from O". An example of a distance-based outlier trajectory is shown in Figure 2.1.
Clustering-based methods cluster trajectories into groups by first measuring trajectory similarity and defining the clustering method. Anomalous clusters are the ones that contain only one trajectory [37].
Considering a trained HMM by activities or indoor locations sequences, the log-likelihood output can be modelled through a statistical distribution and an anomaly will
C H A P T E R 2 . T H E O R E T I C A L BAC KG R O U N D
be given by the behaviour that generates a HMM log-likelihood output with a probability value that is too different compared with the expected behaviour [27].
2.2
Motion detection using pervasive sensing
Learning human motion patterns on everyday basis compromises activity recognition methods and trajectory analysis. In this section, a brief description of Human Activity Recognition (HAR) and location technologies is introduced, as well as the sensors used for this detection.
2.2.1 Human Activity Recognition
HAR is an important and challenging research area in computer vision and machine learning that studies gestures and human motions through the use of sensors for the recognition of activities. It contains many important applications in health-care, life-care, smart environments, and homeland security [39]. The existing studies of HAR suggest the existence of two main classes of activity recognition, namely simple and complex activities. Simple activities are characterised by different body posture and locomotion of humans, comprising more repetitive motions, such aswalking, standing, lying, sitting, walking up and walking down [11]. Complex activities are constituted by multiple simple activities and a specific function involving cognitive functioning [40].
Activities of Daily Living (ADLs) belongs to the set of complex activities and includes daily activities such asbathing, toileting, brushing teeth, eating and cooking. With the recog-nition and analysis of these activities, it is possible to infer about cognitive and physical capabilities of elderly people [41]. Thus, pathological behaviour related to physical activ-ity can be detected, allowing early diagnosis of diseases and intervention procedures [42]. There are different approaches for HAR, some studies recognise human activity using cameras [43], external and wearable sensors [44]. HAR using cameras has obvious pri-vacy issues associated because not everyone is willing to be continuously monitored by a camera. Intelligent homes using a wireless sensor network allows to observe what goes on in the house and infer human activities from sensor data [44], an issue associated to this method is maintenance of the sensors which are usually expensive, moreover, nothing can be done to recognise human activity if the person is out of the sensors range [45]. In recent years, smartphones usability has increased and because of the availability of various sensors in these devices, for being unobtrusive and also an affordable asset, there has been a shift towards smartphones to perform HAR [46, 47].
2.2.2 Location Technologies
Outdoor location positioning uses GPS to calculate users exact location by using signal in-formation transmitted through a satellite-based navigation system [48]. Regarding indoor location, GPS based approaches are less effective because GPS signal is attenuated and
2 . 2 . M O T I O N D E T E C T I O N U S I N G P E RVA S I V E S E N S I N G
scattered by roofs, walls and other objects inside buildings [49]. Indoor location solutions created to overcome this problem are divided into two main categories: Infrastructure-free and infrastructure-based. Radio frequency signals such as Bluetooth, where beacons are used to transmit a specific signal to the device being located, are one of the most com-mon applications of infrastructure-based solutions [50]. Although Wi-Fi signals depend on infrastructure, they can be considered as an infrastructure-free solution, due to its wide implementation inside buildings. Inertial sensors, magnetic field and atmospheric pressure are commonly used for infrastructure-free solutions [16].
The indoor location has been a useful tool for many applications such as tracking of medical equipment’s or visitors in hospitals, locate books in libraries, shopping mall navigation, fire emergency rescue and assistant living systems for elderly people. For the analysis of human trajectory, the main location technologies used in this study are the GPS, Wi-Fi and Dead Reckoning (DR) approach.
2.2.2.1 Global Positioning System
GPS is a satellite-based navigation system that allows calculating user’s location expressed by latitude, longitude and altitude together with timing information. GPS is constituted by three segments: the space segment, the control segment and the user segment. The space segment consists of a constellation of 24 to 32 satellites [51], where each GPS satellite transmits a microwave radio signal composed by two carriers frequencies, two digital codes and a navigation message. The carriers and codes are used to determine the distance between the GPS receiver and the satellite and the navigation message contains the coordinates of the satellites as a function of time. The control segment is a worldwide network of tracking stations that track GPS satellites providing multiple control infor-mation [52]. The user segment includes all users with a GPS receiver. User’s location is determined by employing a triangulation process that considers distances from GPS receiver to three GPS satellites along with the satellites’ locations. If a fourth satellite is available, altitude information can also be determined. GPS enabled smartphones are accurate within a 5-meter radius under open sky [53]. However, GPS accuracy is reduced near buildings, tunnels, bridges because GPS signal is attenuated and scattered by roofs, walls and other objects [49].
2.2.2.2 Wi-Fi Technology
Wi-Fi devices are used for location estimation due to its wide implementation inside buildings. Taking into account that all Wi-Fi Access Point (AP) has a unique ID called Basic Service Set Identifier (BSSID) that is transmitted periodically to any Wi-Fi client, it is possible to estimate client’s position by mainly 3 technologies: Proximity, Triangulation and Scene Analysis (Fingerprinting):
• Proximity is the most simple method that uses AP’s location with the strongest signal to estimate the user’s position. It is a simple, fast real-time positioning
C H A P T E R 2 . T H E O R E T I C A L BAC KG R O U N D
Figure 2.2: Lateration technique. P posi-tion is obtained based on the distance from P to three reference points A, B, C [55].
Figure 2.3: Angulation technique. P po-sition can be found by the intersection of several pairs of angle direction lines [55].
method, however, it has limited accuracy, since it returns the position within the range of the nearest AP, and in the case of multi-floor buildings, it can not provide accurately in which floor the user is located due to signals overlap [54].
• Triangulation uses geometric properties of triangles to estimate the user’s position. It includes lateration (Figure 2.2) and angulation (Figure 2.3) techniques. Lateration estimates position by measuring the user’s distance to multiple reference points. On the other hand, angulation locates the user by measuring angles relative to multiple reference points [55].
• Scene analysis includes algorithms based on fingerprints. This method is divided into two stages: online and offline stages. The offline stage comprises features collection of a scene, where fingerprints store the signal strength of each location co-ordinate, as it is presented in Figure 2.4. The online stage allows estimating location by comparing currently observed signals strengths with the closest a priori location fingerprints, collected during the offline stage [55]. For fingerprinting methods to correctly estimate the position it is needed a sufficient amount of collected informa-tion beforehand, these acquisiinforma-tions are time-consuming and error prone [56]. The main challenge of this technique remains in the fact that Received Signal Strength Indicator (RSSI) can be affected by diffraction, reflection and scattering during its propagation [55]. Therefore, the search for a more accurate and efficient indoor position system still continues.
2.2.2.3 Dead Reckoning technology
DR is an inertial navigation estimation technology that uses data collected from the ac-celerometer, magnetometer and gyroscope to estimate user’s current position by using a previously determined position, heading and velocity [16, 57]. The accelerometer is used to detect steps and step length. The magnetometer is used to determine the Earth magnetic north to be used as a reference to determine movement direction. Gyroscope is
2 . 2 . M O T I O N D E T E C T I O N U S I N G P E RVA S I V E S E N S I N G
Figure 2.4: Wi-Fi RSSI map of an office building. Signal intensity is represented by colours, red colour means more intense [16].
usually used together with a magnetometer to improve the estimation of movement di-rection mainly in indoor environments since ferromagnetic materials cause disturbances in magnetometer readings [58].
2.2.3 Smartphone Sensors
To recognise human activity and location, smartphones are going to be used since they contain several sensors capable of measuring physical quantities in our surrounding. In the context of this study, the most relevant sensors are described bellow.
• Accelerometer measures acceleration in m/s2. Smartphones use a tri-axial ac-celerometer sensor that can measure linear acceleration, relative to the Earth’s, in three orthogonal axes determining the acceleration parts of each spatial direction (x,y and z-axis), as it can be seen in Figure 2.5. The obtained signal contains a dy-namic component caused by smartphone movement and a static component that is gravity acceleration force.
• Gyroscope provides angular velocity information in rad/s in three orthogonal axis. Orientation over time can be calculated by the integration of gyroscope data result-ing in rotation angles around x, y and z-axis, namely pitch, roll and yaw (Figure 2.5).
• Light Sensor provides the measurement of surrounding illumination intensity in SI lux units.
• Microphone records a sound signal using a transducer that converts a sound wave, that consists in a pressure wave, into an electrical signal proportional to its pres-sure [59].
• Magnetometer provides the orientation of the device relative to the Earth’s mag-netic north pole by measuring the strength of the local magmag-netic field along three orthogonal axes in µT. The local magnetic field obtained combines the geomagnetic field and magnetic field from the environment.
C H A P T E R 2 . T H E O R E T I C A L BAC KG R O U N D
Figure 2.5: Smartphones coordinate system [61].
• Barometer pressure sensor provides the altitude of the device relative to its initial position by measuring the atmospheric pressure, in hPa or mbar, to infer about altitude above the sea [60].
• Wi-Fi is a wireless networking technology, that contains devices called AP that use radio waves to establish a communication between the Wi-Fi device and a wired network, typically the Ethernet. Smartphones contain a Wi-Fi receiving module that allows the connection to a wired network, from which we can extract the RSSI, BSSID and the frequency over which the client is communicating with the AP in MHz.
The previous section detailed the main areas and the types of sensors that can be used to obtain relevant information that reflects a change in subjects or surrounding. However, developing methods that can accurately model the true nature of human behaviour re-mains a challenge [35]. Using the previous knowledge of HAR and location technologies, behaviour can be modelled, through which patterns and deviations to those patterns can be detected.
2.3
Machine Learning
Machine learning is the field of computer science derived from artificial intelligence that gives the capability to computer programs to learn without being explicitly programmed. According to Tom M. Mitchel [62] machine learning definition is "A computer program is said to learn from experience E with respect to some class of tasks T and performance measure P , if its performance at tasks in T , as measured by P , improves with experience E". Machine learning includes several algorithms based mainly in four types of learning: Supervised learning, Unsupervised learning, Semi-supervised learning and Reinforce-ment learning.
• Supervised learning uses a labelled dataset to train the classifier, which means, the input, samplex, of the classifier has the output, prediction y, already defined. After the training procedure, the classifier is capable of predicting new outputs.
2 . 3 . M AC H I N E L E A R N I N G
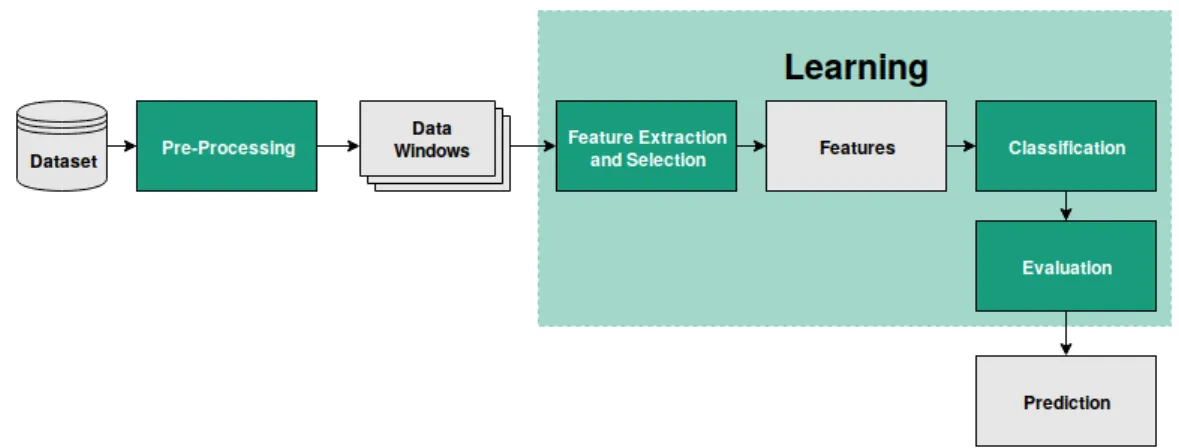
Figure 2.6: Machine learning classification architecture. The grey objects represent the variables inputs/outputs from the processes coloured in green.
• Unsupervised learning trains the classifier with an unlabelled dataset, finding patterns in the dataset relying on data similarity.
• In Semi-supervised learning the classifier is trained using a labelled and unla-belled dataset, containing more unlaunla-belled data than launla-belled.
• Reinforcement learning trains the classifier that learns by interacting with a dy-namic environment using the experience gathered to optimise its performance. In other words, by a trial and error method, it must reach a certain goal in the interact-ing environment such as winninteract-ing a game.
Figure 2.6 represents the machine learning classification architecture. The dataset is segmented into equal-sized data windows from which features are extracted, followed by the implementation of a machine learning classifier, a validation procedure, and lastly, the prediction result.
2.3.1 Pre-processing
Before employing a machine learning algorithm, data needs to be processed to enhance relevant signal properties. In the case of a continuous stream of data, segmentation techniques are usually used to process this data. Data is segmented into equal-sized windows, whose length can be defined according to the recognition problem at state. Additionally, data windows may or not overlap depending if it is important to detect transitions between activities [63] or to enhance relevant features properties that may be overshadowed by segmenting the signal into a fixed window size.
Determining the appropriate window size is a common challenge in the scientific community [64, 65]. Shorter windows may be useful for the recognition of repetitive activities or activities with short duration [66] and it has the advantage of reducing energy consumption and faster recognition. On the other hand, the short window size is not
C H A P T E R 2 . T H E O R E T I C A L BAC KG R O U N D
appropriate for the recognition of long complex activities that are not so repetitive. Thus, longer complex activities need to be recognised using a larger window size that allows enhancing relevant features of the activity [67]. Hence, it is important the selection of the window size, depending on the recognition problem.
After data is segmented into windows it is important to properly balance the dataset. An imbalanced dataset contains more samples of some classes than others. This is a common problem when working with standard machine learning algorithms because these algorithms expect a balanced dataset. When a complex and imbalanced dataset is provided, they tend to choose the classes with more samples and ignore the small ones [68]. Several solutions were developed to solve this problem at the data level including re-sampling methods and the algorithm level involving the adjustment of the cost of the various classes [69, 70].
2.3.2 Feature Extraction
Feature extraction is an important stage of machine learning algorithms, it is when each data window is transformed into a low dimensional subspace preserving most of the relevant information [71]. Features are typically extracted from time, spectral and statis-tic domains. A python library developed by Fraunhofer Portugal, named Time Series Feature Extraction Library (TSFEL)3, extracts a total of 43 features including 12 from the temporal domain, 18 from the spectral domain and 13 from the statistical domain. A detailed description of TSFEL is presented in Appendix A. After feature extraction, features need to be normalised to a common scale so that new extracted features can contribute equally to the classifier. In this work, features were normalised by a Z-score normalisation, resulting in a zero mean and standard deviation of one, as it can be seen in Equation 2.1:
Zn=Xn−µ
σ (2.1)
Where, Xn is the feature, µ the mean and σ the standard deviation. The mean and standard deviation from the training set are parameters that need to be learned to be used for the normalisation of the new data for prediction.
2.3.3 Feature Selection
Feature selection algorithms are one of the most important in a classification process because they allow to remove features with redundant, misleading and irrelevant infor-mation, reducing computation time, overfitting, complexity and improving the learning process of the classifier. Feature selection methods can be subdivided into Filters, Wrap-pers and Embedded methods.
3Available in https://github.com/fraunhoferportugal/tsfel (visited on 03/09/2019)
2 . 3 . M AC H I N E L E A R N I N G
• Filters: Filter methods, have low computational cost and time, they do not rely on the classifier being used, and evaluates features based on general characteristics of the data [72].
• Wrappers: Wrappers methods are dependent on the machine learning classifier being used, having a better performance than filter methods. However, they present higher computational cost and time, because each feature set needs to be evaluated with the trained classifier [73].
• Embedded: These methods use both advantages of wrappers and filter methods.
2.3.4 Classification
In a machine learning classification process the training procedure can be divided into supervised and unsupervised learning methods.
2.3.4.1 Supervised Learning
This subsection describes the commonly used classifiers in supervised recognition prob-lems.
Decision Treeconstitution comprises nodes and a hierarchy of branches. There are three types of nodes, the root or decision node, the internal or chance node and the leaf or end node. The root node consists in the choice that leads to the subdivision of all samples in two or more exclusive subsets. The internal node corresponds to one of the possible choices available, its top edge is connected to the parent node and the bottom to the sun node. The outcomes of root and internal nodes are named branches. At each node, if-then-else rules are applied and after all the decision events, the leaf node is reached representing the final result [74].
K-Nearest Neighborsalgorithm can be divided into mainly two stages, the first con-sists in determining the nearest neighbours and the second, according to the determined nearest neighbours, to decide the corresponding class. The nearest neighbours are se-lected by computing the distance, for example, the euclidean distance [75], between an unlabelled sample and a training labelled dataset with a class label. The nearest neigh-bours will be those at the shortest distance. The most straightforward approach to decide the corresponding class is to assign the majority class of the nearest neighbours.
Random Forestis a combination of decision trees, where each tree node contains a set of features randomly selected from the whole set of attributes, as employed in the bagging method [76]. The classification result arises from majority voting.
AdaBoost classifier combines many weak classifiers and it is based on an iterative algorithm [77]. It first starts with an unweighted training set, according to the classifica-tion results, the weight of the miss-classified samples, in the next iteraclassifica-tion, is increased, i.e boosted. This way, the next classifier has no longer equal-weighted samples. The
C H A P T E R 2 . T H E O R E T I C A L BAC KG R O U N D X 1 S1 X 2 S2 X 3 S3 . . . . . . Observations Markov chain (unobserved)
Figure 2.7: Hidden Markov Models chain, where S refers to hidden states and X to observations. Adapted from [79].
procedure continues, each classifier gets a score, and the final classifier will be a linear combination of the classifier’s scores at each stage.
Naive Bayesclassifier assigns the most likely class, y, for a sample , x, according to Equation 2.2: ˆ y = argmax y P (y) x Y i=1 P (xi|y) (2.2)
Where ˆy is the assigned class, x is a feature sample, and P (y) is estimated using the Maximum A Posteriori estimation and the likelihood of features is assumed to be Gaussian:
P (xi|y) = 1 q 2πσy2 exp(−(xi −µy)2 2πσy2 ) (2.3)
Where σy and µy are estimated by maximum likelihood. This classifier works by assuming, in a naive way, the independence between features given a class, according to Bayes rule (Equation 2.4), wherey is the predicted class, and (x1, x2, ..., xn) is the feature vector.
P (y|x1, x2, ..., xn) =
P (y)P (x1, x2, ..., xn|y) P (x1, x2, ..., xn)
(2.4) Hidden Markov Modelsare effective to infer about hidden states (S) of a system that gives rise to a time series of observations. It is constituted by a set of hidden states, which variables are discrete, called Markov Chain, observations generated by some process whose state is hidden from the observer, by the probability of transitioning from one state to another, including self-transitions and by emission probabilities (see Figure 2.7) [78].
HMM satisfies Markov property, well described by Ghahramani [80], which states that "an n-th order Markov process is one in which St given St−1... St−nis independent of Sτ for τ<t-n.". This means that the Markov chain bases its state choice only in transition probabilities from the previous state.
According to Rabiner [81], hidden states sequence can be estimated from a given model λ = (A, B, π), where A corresponds to state transition probability matrix, B refers to emission probability matrix and π the initial state distribution vector.
2 . 3 . M AC H I N E L E A R N I N G
However, to properly estimate the hidden states the following three basic problems are addressed:
• Problem 1: Viewed as an evaluation problem, how do we compute the probability of a given sequence and the model, P (O|λ), where O is a sequence of observations and λ a model. In other words, how well a given model matches a given observation sequence.
• Problem 2: Attempt to uncover the hidden states of the model, given the observation sequences O and the model λ, how do we find the optimal state sequence.
• Problem 3: Optimisation of the model parameters λ = (A, B, π) to maximise P (O|λ). 2.3.4.2 Unsupervised Learning
Unsupervised learning comprises clustering methods and allows to model probability densities of input data.
Clustering methodsdivide data into groups according to their similarity, without the need of knowing previous knowledge of the group definitions. Each group of similar data is called a cluster. Clustering techniques satisfies two conditions, the objects in each group need to be similar to each other and different from objects contained in other clusters. Clustering techniques are divided into hierarchical methods, partitioning methods and density-based algorithms.
• Hierarchical Methods: In hierarchical methods, clusters are divided hierarchically, not in a single step. Thus, it is possible to obtain different partitions of data, from only one cluster containing all objects, to x clusters containing only one object [82]. Hierarchical methods are subdivided into agglomerative and divisive hierarchical clustering [83]. In agglomerative hierarchical clustering, initially each object repre-sents one cluster, then clusters are grouped to originate the desired cluster structure. Meanwhile, in divisive hierarchical clustering, initially all objects belong to one sin-gle cluster and then the cluster is subdivided into smaller clusters until the desired cluster structure is obtained. The result of the hierarchical clustering methods is a dendrogram that illustrates the grouping or divisions made at each successive stage of the clustering analysis, an example is shown in Figure 2.8.
• Partitioning Methods: Partitioning methods start with an initial partitioning, where the number of clusters is pre-selected by the user. For the adequate partitioning, iterative optimisation of the cluster centres is performed [83].
• Density Based Methods: Density-based methods are used for discovering clus-ters with arbitrary shape. The objects are grouped according to a specific density function. In this method, it is necessary to define the minimum number of objects contained in a given neighbourhood radius, and the cluster keeps growing as long
C H A P T E R 2 . T H E O R E T I C A L BAC KG R O U N D p4 p1 p3 p2 p4 p1 p2 p3
Figure 2.8: Representation of a dendrogram and corresponding clusters. The left part of the figure illustrates the dendrogram, whose dashed coloured lines represent the divi-sions giving origin to the corresponding coloured cluster on the right part of the figure. Adapted from [84].
Figure 2.9: Representation of a core, border and noise points according to DBSCAN, considering Minpts <= 7. A point is a core point since its density region, coloured in green, contains 7 points, B point is a border point as it is on the edge of a density region and C point is a noise point since is neither a border or core point. Adapted from [84].
as the density, number of objects, in the neighbourhood exceeds a given parameter. Density-based methods are useful to find outlier objects [83]. Common density based methods include Density-based spatial clustering of applications with noise (DBSCAN) and Hierarchical Density-based spatial clustering of applications with noise (HDBSCAN).
1. DBSCAN is an effective method for separating a dataset with different density regions. The density of a specific point of the dataset is given by the number of objects within a given radius from that point, this radius is an input parameter in DBSCAN methods called Eps. The minimum number of objects inside a re-gion, minP ts, is also an input for DBSCAN algorithm [84]. DBSCAN algorithm works as described in the following.
Initially, each point in the dataset is going to be classified as:
– Core pointif it is inside a density region, namely if the number of points within a given radius Eps exceed the minP ts (see Figure 2.9).
– Border pointif it is on the edge of the density region (see Figure 2.9). – Noise pointif it is in a sparsely occupied region (see Figure 2.9).
Next, noise points will be eliminated. An edge will separate all core points that are within Eps of each other into density-based clusters. Finally, each border