J. L. B. C. Veiga
Department of Mechanical Engineering Catholic University of Rio de Janeiro (PUC-RJ) P.O. Box 38097 22453-900 Rio de Janeiro, RJ. Brazil [email protected]
A. A. de Carvalho
I. C. da Silva
and J. M. A. Rebello
Department of Metallurgical and Materials Engineering Federal University of Rio de Janeiro (UFRJ) P.O. Box 68505 21945-970 Rio de Janeiro, Rj. Brazil [email protected] [email protected]
The Use of Artificial Neural Network
in the Classification of Pulse-Echo
and TOFD Ultra-Sonic Signals
The present work evaluates the application of artificial neural networks for pattern recognition of ultrasonic signals using pulse-echo and TOFD (Time of Flight Diffraction) techniques in weld beads.
In this study pattern classifiers are implemented by artificial neural network of backpropagation type using MATLAB. The ultrasonic signals acquired from pulse-echo and TOFD were introduced, separately, in the artificial neural network with and without preprocessing. The preprocessing was only used to smoothen the signal improving the classification.
Four conditions of weld bead were evaluated: lack of fusion (LF), lack of penetration (LP), porosity (PO) and non-defect (ND). The defects were intentionally inserted in a weld bead of AISI 1020 steel plates of 20 mm thickness and were confirmed using radiographic tests.
The results obtained show that it is possible to classify ultrasonic signals of weld joints by the pulse-echo and TOFD techniques using artificial neural networks. The results showed a performance superior a 72% of success for test. Although the preprocessing of the signal improved the classification performance of the signals acquired by the TOFD technique considerably, the same didn't happen with the signals acquired by the pulse-echo technique.
Keywords: Nondestructive tests, ultrasonic technique, artificial neural network, and pattern recognition
Introduction
For a long time, non-destructive tests (NDT) have been used to assure the quality of the products and equipment. The purpose of the NDT is to detect, locate and sizing discontinuities in materials.
Ultrasonic is one of the most used nondestructive tests for detection, localization and measurement of flaws present in engineering materials under inspection. Among ultrasonic techniques pulse-echo method is the most commonly used in industry, mainly due to its simplicity and efficiency. However, the accurate measurement of defects perpendicular to the inspection surface is one of the limitations of pulse-echo technique. In order to overcome this difficulty TOFD (Time of Flight Diffraction) technique is used, which apply to the interior of the material one angular ultrasound beam in relation to the surface of the inspection
[4,10].
Despite the advantages of the ultrasound, a high velocity of inspection, a high probability of detection and a low number of false results [3,9], the classification of defects based on ultrasonic signals is still frequently questioned, since the analysis and the identification of defect types depend exclusively on the experience
and knowledge of the operator.1
The correct classification of the type of flaw present in the material reduces measurement errors, increasing the confidence in the test and consequently the safety of the material in future applications.
The continued progress in computational techniques, mainly the development of neural networks has given a large impetus in the research development of automatic inspection systems and classification of defect patterns [6, 7, 14]. Neural networks consist of algorithms that learn how to mould some functions of the brain, such as the pattern recognition, creation of associations, signal processing and learning by experience or training. The use of computational tools for pattern recognition, as artificial neural
Paper accepted July, 2005. Technical Editor: Atila P. Silva Freire.
networks (ANN), offered a new way to classify the defects detected by the ultrasonic technique.
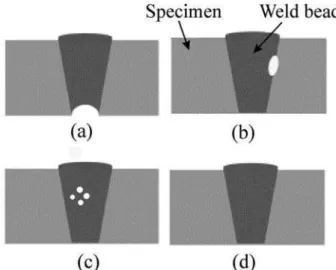
In this work, pattern classifiers are implemented using artificial neural networks (ANN) for the recognition of classes of ultrasonic signals obtained in the inspection of weld beads by the pulse-echo and TOFD techniques, with the aim to improve the reliability in the structural integrity of the materials. The performance of these classifiers is evaluated in the classification of signals in four conditions of weld joints: lack of penetration (LP), lack of fusion (LF), porosity (PO) and non-defect (ND), which was a class for control, Fig. 1. This work also used an optimized configuration of an ANN.
Figure 1. Schematic drawing of the four studied conditions of the weld bead: (a) lack of penetration, (b) lack of fusion, (c) porosity and (d) non-defect.
Pulse-Echo Technique
echo that is produced when an ultrasonic signal is reflected by a flaw present in the material being tested. However in this case only one transducer is used to emit (emitter) the ultrasonic pulses and receive the reflected signals (receptor). This method is used for the detection, localization and measurement of any defects present in the material. Based on the location of the defect an inspector makes its classification (Figure 2). The size of the defect is directly related to the amplitude of the signal reflected, if the ultrasonic beam meets a reflecting surface, part or all of the energy is reflected. The percentage of energy that is reflected is directly dependent on the size of the reflecting surface in relation to the size of the ultrasonic incident beam [1,8].
Figure 2. Ultra-sonic inspection using pulse-echo technique.
TOFD Technique
TOFD technique is not based in echoes amplitude, but uses the travel time of a diffracted wave at the tip of a discontinuity for determination of its depth. This method relies on the diffraction of ultrasonic energy from 'corners' and 'ends' of internal structures (primarily defects) in a component under test. This is in contrast to conventional pulse-echo methods, which rely on directly reflected signals.
TOFD technique is based on interaction of ultrasonic waves with the extremities of the flaws. This interaction results in emission of diffracted waves in many angles. The detection of these diffracted waves makes it possible to establish the presence of flaws. The difference in the time of flight of the diffracted signals is related to the flaw height, and consequently it allows to set its sizing. The amplitude of the signal is not used to estimate the size of the flaw.
The technique principle was demonstrated by Silk [11, 12, 13] during the 70's. The technique utilizes two transducers, one as a transmitter (1) and the other as a receiver (2), aligned at both sides of the weld bead, to cover the volume of material to be inspected (Figure 3). The first echo to reach the receiver transducer corresponds to the lateral wave. If there is no discontinuities the second signal will be the backwall echo. Any signals generated by discontinuities will be placed between the lateral wave and the backwall echo.
Figure 3. A typical layout for TOFD technique: (1) emitter, (2) receptor, (a) lateral wave, (b) diffracted wave by the top of the defect, (c) diffracted wave by the bottom of the defect and (d) back-wall echo.
A-scan mode is the most typical form of the ultrasound signal, and it consists of the signal itself, amplitude versus time, which is displayed on an ultrasound equipment screen. A typical signal (A-scan) of TOFD technique is shown in Fig. 4 and presents four echoes[2].
Figure 4. A typical model of an A-scan signal generated by TOFD technique obtained from a flaw.
Artificial Neural Networks
ANN are mathematical models whose purpose is to simulate the human brain in a simple and objective way. And so, a model should have the fundamental capacity of a brain – learning capacity, which permits carrying out tasks that are considered typical of the human brain, such as patterns recognition, creation of associations, systems identification and clustering etc.
Although they are less complex than the human brain, the neural networks can process great amounts of data in a short period of time that typically could only be analyzed by one specialist. The training or learning of the network from samples, like with the human brain, is one of its most important characteristics [5, 15].
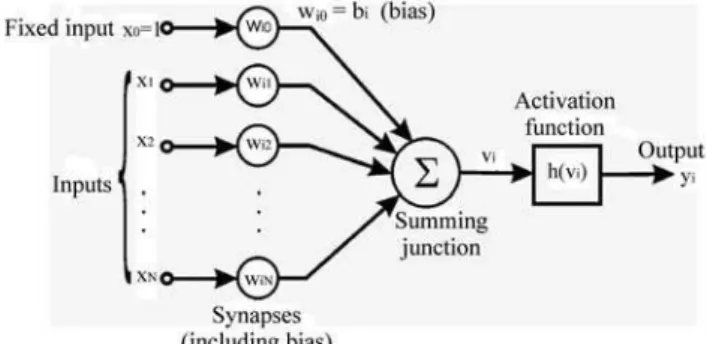
One artificial neuron may have many inputs (xi), each of them associated to a weight function, synapses (wij). The outputs of all added synapses (vi) are submitted to an activation function (h(vi)), in order to restrict the output signal amplitude. Any collection of input dates will generate a certain output (yi), as a boolean output, for example. One neural network is a neuron linkage arranged in interconnected layers (Figure 5).
Figure 5. Model of a neural network.
Where:
∑
= = N
j ij j i
w
x
u
1. (1)
)
(
u
b
x
w
v
jN
j ij i .
0
∑
=
= (3)
v
i=u
i+b
i (4)
y
(v
i)i=h (5)
Experimental Procedure
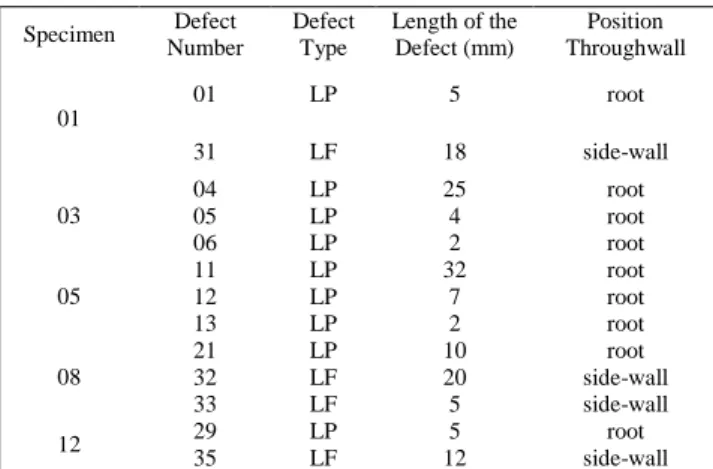
The ultrasonic tests, in this work, were performed on twelve specimens made of steel plates AISI 1020, thickness: 20mm and length: 300mm, V-type bevel with inclination: 50o, root distance of about 2mm and welded by shielded process. Different defects, such as lack of fusion, lack of penetration and porosity, were inserted in the specimen during welding. The LP defects are incomplete fill and the LF defects are side-wall fusion. From Table 1 is possible to know that the size of LP defects are between 2 and 32 mm, and the size of LF defects are between 5 and 20 mm.
Table 1. Defects and specimen features.
Specimen Defect Number
Defect Type
Length of the Defect (mm)
Position Throughwall
01 LP 5 root
01
31 LF 18 side-wall 04 LP 25 root
05 LP 4 root
03
06 LP 2 root
11 LP 32 root
12 LP 7 root
05
13 LP 2 root
21 LP 10 root 32 LF 20 side-wall 08
33 LF 5 side-wall
29 LP 5 root
12
35 LF 12 side-wall
Pulse-echo technique inspections used angular transducers with 4 MHz central frequency and 60o sonic beam incidence on the material and an ultrasound equipment with analog signal output were used in the test. The signals were digitized by oscilloscope in order to be treated in a PC-type microcomputer.
TOFD technique inspections were made using the same specimens as with the pulse-echo technique. Transducers of 5 MHz frequency and wedge for longitudinal waves of 60° sonic beam incidence in the material were used. The position, the type and the size of each of the defects inserted are known through the use of radiographic tests of the weld beads (Figure 6).
Figure 6. Radiography of the welded join.
For inspection of the ultrasonic TOFD test, an automatic inspection system was used in the acquisition of various signals A-scan, obtained by the normal dislocation of the transducer in relation to the direction of the sonic beam[15]. The automatic inspection
system consist in a device of magnetic wheels (Figure 7), especially projected to transport a pair of transducers, one conventional ultrasound equipment, an A/D converter board, a PC microcomputer and a software that carries out the control of the device and data recorded from the region of the weld being inspected.
Figure 7. Automatic inspection system for TOFD technique.
In the present study, for the pulse-echo signals, one non-linear (with hidden-layer) pattern classifier was implemented with a supervised feedforward neural network backpropagation type using
MATLAB software. By varying the number of neurons on the
hidden layer and observing the classifier performance and error at the end of the training, it was possible to obtain a suitable number of neurons from the hidden layer for this study. The neural network used has a hidden layer of 26 neurons, and 1 neuron (corresponding to the condition to be classified) on the output layer. For TOFD signals, a linear pattern classifier was implemented with a supervised feedforward neural network backpropagation type using
MATLAB software. The performance of this linear classifier
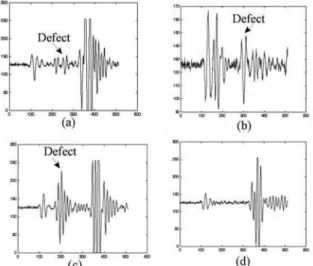
justified the non-utilization of a classifier with hidden layer. This neural network was fed with ultrasonic signals that represent the four conditions of the weld bead: ND, LF, LP and PO, for both techniques, separately. Each signal has its own characteristics, and this is the information that the network uses to resolve the different classes, as exemplified in Fig. 8 for pulse-echo signals and Fig. 9 for TOFD signals. For each condition of pulse-echo, 30 signals for training and 20 signals for tests were acquired, for TOFD, 40 signals for training and 20 signals for tests were acquired.
Figure 9. Example of characteristic TOFD signals: (a) LF, (b) LP, (c) PO and (d) ND.
The neural network was initially fed with pulse-echo signals. The performance of the ANN was evaluated and its configuration was optimized taking into consideration the time that the ANN dispensed for the classification, versus its performance. After this consideration the performance in classifying the four studied classes was evaluated. Another group of signals was acquired, this time for the TOFD technique and, again, the classifier performance was evaluated. Finally, both signals were preprocessed with the application of one low-pass filter to smoothen the signal. These preprocessed signals were used, again, as inputs for the classifier.
Results and Discussions
Tables 2 and 5 show the results of “confusion” between classes for training and test for the pulse echo and TOFD, respectively. This “confusion” is the mistakes that the ANN make during the classification process. The tables 3, 4, 6 and 7 show the general results for pulse echo signals, preprocessed pulse echo, TOFD and preprocessed TOFD in that order. All tables show the results of the classifier with the decision criteria at the output, which means that the signal can be classified even when the network doesn't indicate any class or indicates more than one class as true. When this occurs, the output class will be the one with the largest algebraic value at the output of the network. Table 3 shows that the results of the pulse echo signals for training (96.67%) were better than those for test (72.50%). This difference between the training signals and the test signals was also observed in the preprocessed pulse echo signals, rate of success of 100% for training and 78.75% for test (Table 4). The TOFD signals without preprocessing presented a rate of success of 96.25% for training and 77.50% for test (Table 6) and with preprocessing 98.75% for training and 97.5% for test (Table 7). This difference is due to the fact that it is easier for the ANN to classify a signal known during the training process, than a totally unknown signal (test signal).
Table 2 shows that for training data the LF and ND classes were separated, while the LP and PO classes presented error in classification. For test data the LF, PO and ND classes presented rate of success of 80%, 65% and 90% respectively. The good performance of ND class can be explained by the absence of echoes, making the signal cleaner. The LP class showed a rate of success of
55%. The low rate of success presented by this class can be
explained by the fact that the signalpresented a large variation in shape, with amplitude alterations of the peak of the defect, which caused a confusion, mainly, with FF and ND classes.
The results of preprocessed pulse echo signals presented in Table 4 show that all the classes were well separated during the training, which possible shows that some information from the original signal difficult the performance of the ANN. Test data also presented the same tendency of success as the pulse echo test without preprocessing, the ND class was the best separated with 95% of success, followed by LF (90%), PO (70%) and LP (60%). A possible reason for the low rate of success for the class LP is that during the processing some relevant information may have been suppressed from the signal, reducing the characteristics for the identification of the class by ANN.
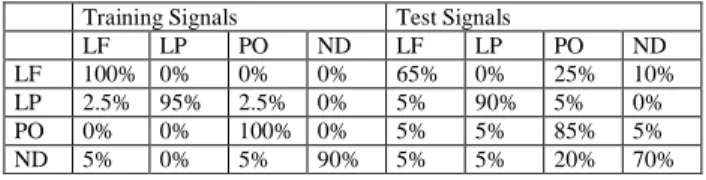
Table 5 presents the results of TOFD technique. It can be seen that during the training of LF classe showed no errors, and the worst classification was for the ND class with a rate of success of 90%. For the test data, the best results were obtained with LP class with 90% of success, followed by PO with 85% and ND with 70%. The worst result was for LF class with 65%. The good performance presented by LP class can be explained by the fact that the signal of this class did not have a back-wall echo, which caused low confusion with the other classes. While the low rate of success presented by LF class can be explained by the fact that when the defect is very small the diffraction of the upper and lower ends of the defect are closer to each other, becoming only one echo, increasing the confusion. It can also be seen that there was a considerable confusion between the classes by the ANN, the presence of noise is a possible explanation justifying the need of a preprocessing to smoothen the signal. This noise is the typical information that difficult the process of classification by the ANN.
In Table 7 can be observed that there was a considerable increase in the success rates of results for preprocessed TOFD technique for test data (97.5%) in relation to test data without preprocessing (77.50%). This confirms what was said previously, that is, the noise present in the signal (unnecessary information being supplied to the classifier) was creating difficulties for the classification.
Summarizing, it can be concluded that using a pattern classifier, implemented by ANN, it is possible to classify the classes of the signals from the welds as much by pulse echo technique as by TOFD technique, with a reasonable rate of success (72.50% for the pulse echo and 77.50% for the TOFD technique, both for test data). However, the application of preprocessing to the signal produces a considerable improvement in results of TOFD (97.5%), but the same did not occur for pulse echo technique (78.75%).
Table 2. Table of “confusion” – training and test signals – pulse-echo signals.
Training Signals Test Signals
LF LP PO ND LF LP PO ND LF 100% 0% 0% 0% 80% 10% 10% 0% LP 6.7% 90% 0% 3.3% 20% 55% 10% 15% PO 0% 0% 96.7% 3.3% 20% 0% 65% 15% ND 0% 0% 0% 100% 5% 0% 5% 90%
Table 3. Table of success and errors – training and test – pulse-echo signals.
Training Test
Success Rate
Error Rate
Success Rate
Error Rate
LF 100% 0% 80% 20%
LP 90% 10% 55% 45%
PO 96.7% 3.3% 65% 35%
ND 100% 0% 90% 10%
Table 4. Table of success and errors – training and test – preprocessed pulse-echo signals.
Training Test
Success Rate
Error Rate
Success Rate
Error Rate
LF 100% 0% 90% 10%
LP 100% 0% 60% 40%
PO 100% 0% 70% 30%
ND 100% 0% 95% 5%
TOTAL 100% 0% 78.75% 21.25%
Table 5. Table of “confusion” – training and test signals –TOFD signals. Training Signals Test Signals
LF LP PO ND LF LP PO ND LF 100% 0% 0% 0% 65% 0% 25% 10% LP 2.5% 95% 2.5% 0% 5% 90% 5% 0% PO 0% 0% 100% 0% 5% 5% 85% 5% ND 5% 0% 5% 90% 5% 5% 20% 70%
Table 6. Table of success and errors – training and test –TOFD signals.
Training Signals Test Signals
Success Rates
Error Rates
Success Rates
Error Rates
LF 100% 0% 65% 35%
LP 95% 5% 90% 10%
PO 100% 0% 85% 15%
ND 90% 10% 70% 30%
Total 96.25% 3.75% 77.50% 22.50%
Table 7. Table of success and errors – training and test – preprocessed TOFD signals.
Training Signals Test Signals
Success Rates
Error Rates
Success Rates
Error Rates
LF 100% 0% 100% 0%
LP 97.5% 2.5% 95% 5%
PO 97.5% 2.5% 95% 5%
ND 100% 0% 100% 0%
Total 98.75% 1.25% 97.5% 2.5 %
Conclusions
The implemented configuration of ANN showed a reasonable rate of success to classify patterns of ultrasonic signals from welds, in steel plates made of AISI 1020, by pulse echo technique and by TOFD technique.
Based on the analysis of the results it can be concluded that the signals evaluated: the pulse echo, with and without preprocessing and TOFD with and without preprocessing, the TOFD signal with preprocessing presented the best rate of success.
Preprocessing applied to the signal with the objective to reduce the levels of noise present produced a considerable improvement in
the classification of the signals acquired by the TOFD technique. The same was not observed for the pulse echo technique.
The increase in the number of training signals, adequately including representative data of all classes to be resolved, is a factor that can help to increase the ANN performance.
For a production system on-line, where processing time could be a problem, both the pulse-echo technique and the TOFD technique presented a rate of success similar for tests, without preprocessing. However, if the processing time is not a problem the TOFD technique showed better results with preprocessing signal.
Using a pattern classifier implemented by neural networks it is possible to classify patterns of ultrasonic signals from welds by the pulse echo technique and by the TOFD technique with a reasonable rate of success (72.50% for pulse echo and 77.50% for TOFD technique, both without preprocessing).
Acknowledgements
The authors wish to acknowledge CAPES, FAPERJ and UFRJ for their financial support.
References
[1] American Society for Nondestructive Testing, Nondestructive Testing Handbook, 2a. Edition, Vol. 7, 1991.
[2] British Standard BS7706, “Guide to Calibration and Setting-up of Ultrasonic time of Flight Diffraction
[3] Carvalho A A, Sagrilo L V S, Silva I C, Rebello, J M A, The PoD Curve for the Detection of Planar Defects Using a Multi-channel Ultrasonic System, Insight, Vol. 44, N°11, pp. 689-693, November 2002.
[4]. Erhard, A., Ewert, U., “The TOFD Method – Between Radiography and Ultrasonic in Weld Testing”, NDT.net, vol.4, N° 9, September, 1999.
[5] Haykin S., Neural Networks, “A Comprehensive Foundation”, Macmillan College Publishing. Inc., 1994.
[6] Margrave, F. W., Rigas, K., Bradley, D. A., Barrowcliffe, P., “The Use of Neural Networks in Ultrasonic Flaw Detection”, Measurement, 25, pp. 143-154, 1999.
[7] Masnata, A., Sunseri, M., “Neural Network Classification of Flaws Detected by Ultrasonic Means”, NDT & E International, Vol. 29, N°2, pp. 87-93, 1996.
[8] Nondestructive Evaluation and Quality Control, Metals Handbook, 3a. Edition, Vol. 17, 1994.
[9] Ogilvy J. A., Model for Predicting Ultrasonic Pulse-echo Probability of Detection, NDT & E International, Vol. 26, N°1, pp. 19-29, 1993.
[10] Raad, J. A., Dijkstra, F. H., “Mechanised UT on Girth Weld During Pipeline Construction – a Mature Alternative to Radiography”, The Journal of the British Institute of Non-Destructive Testing, pp. 435-438, Vol. 40, N°6, June, 1998.
[11] Silk, M.G., “Sizing Crack-like Defects by Ultrasonic Means”. In Research Techniques in Nondestructive
Testing. Vol. 3. Academic Press. 1997. pp.51-79.
[12] Silk, M.G., “The transfer of ultrasonic energy in the diffraction technique for crack sizing”. Ultrasonics. May
1979 pp.113-120
[13] Silk, M.G., LIDINGTON, B.H., “Defect sizing using an Ultrasonic Time Delay Approach”, British Journal of
NDT, pp. 33-36, March, 1975.
[14] Siquiera, M. H. S., “Long Distances Inspection Using Ultrasonic Guided Waves and Artificial Intelligence”, DSc. Thesis, Department of Metallurgical and Materials Engineering, COPPE/UFRJ, Brazil, 2002.