ACCEPTED version by the European Journal of Clinical Nutrition after peer-revision 1
2
Original Article 3
Body Composition and Body Fat Distribution are Related to Cardiac 4
Autonomic Control in Non-Alcoholic Fatty Liver Disease Patients 5
Running Title: Body composition and Cardiac Autonomic Control
6
Nuno M. Pimenta, MS1,2, Helena Santa-Clara, PhD1, Helena Cortez-Pinto, MD, PhD3, 7
José Silva-Nunes, MD4, Maria da Lapa Rosado, Bch1, Pedro J. Sousa, MD5, Rita Calé, 8
MD6, Xavier Melo, MS1,Luís B. Sardinha, PhD1, Bo Fernhall, PhD7 9
1
Exercise and Health Laboratory, Interdisciplinary Centre for the Study of Human 10
Performance, Faculty of Human Kinetics, Technical University of Lisbon, Cruz-11
Quebrada, Portugal; 2 Sport Sciences School of Rio Maior, Polytechnic Institute of 12
Santarém, Portugal; 3 Unidade de Nutrição e Metabolismo, FML, IMM. Departamento
13
de Gastrenterologia, Hospital Universitário de Santa Maria, Lisbon, Portugal; 4 Curry 14
Cabral Hospital, Lisbon, Portugal; 5 Santa Cruz Hospital, Carnaxide, Portugal; 6 Garcia de 15
Orta Hospital, Almada, Portugal; 7 College of Applied Health Sciences, University of 16
Illinois, Chicago, USA. 17
Correspondence: Nuno Manuel Pimenta, MS. Sport Sciences School of Rio Maior –
18
Polytechnic Institute of Santarém, Av. Dr. Mário Soares, 2040-413 Rio Maior - Portugal. 19
Phone: +351-243 999 280, Fax: +351-243 999, E-mail: npimenta@esdrm.ipsantarem.pt
20
Funding: The present study was funded by the Centre for the Study of Human
21
Performance, Portuguese Foundation for Science and Technology, Lisbon, Portugal. 22
ABSTRACT
23
Background/Objectives: Heart rate recovery (HRR), a cardiac autonomic control
24
marker, has been shown to be related to body composition (BC), yet this was not 25
tested in Non-Alcoholic Fatty Liver Disease (NAFLD) patients. The aim of this study was 26
to determine if, and to what extent, markers of BC and body fat (BF) distribution are 27
related with cardiac autonomic control in NAFLD patients. 28
Subjects/Methods: BC was assessed with Dual Energy X-ray Absorptiometry in 28
29
NAFLD patients (19 males, 51 ± 13 yrs, and 9 females, 47 ± 13 yrs). BF depots ratios 30
were calculated to assess BF distribution. Subjects’ HRR was recorded 1 (HRR1) and 2 31
minutes (HRR2) immediately after a maximum graded exercise test. 32
Results: BC and BF distribution were related to HRR, particularly weight, trunk BF as
33
well as trunk BF-to-appendicular BF ratio showed a negative relation with HRR1 (r=-34
0.613; r=-0.597 and r=-0.547; respectively, p<0.01) and HRR2 (r=-0.484; r=-0.446; 35
p<0.05 and r=-0.590; p<0.01, respectively). Age seems to be somewhat related to both 36
HRR1 and HRR2 except when controlled for BF distribution. The preferred model in 37
multiple regression should include trunk BF-to-appendicular BF ratio and BF to predict 38
HRR1 (r2=0.549; p<0.05), and trunk BF-to-appendicular BF ratio alone to predict HRR2 39
(r2=0.430; p<0.001). 40
Conclusions: BC and BF distribution were related to HRR in NAFLD patients. Trunk
BF-41
to-appendicular BF ratio was the best independent predictor of HRR and therefore 42
may be best related to cardiovascular increased risk, and possibly act as a mediator in 43
age related cardiac autonomic control variation. 44
Keywords: Regional Body Fat; Dual Energy X-ray Absorptiometry; Hepatic Steatosis;
45
Heart Rate Recovery; Parasympathetic Reactivation. 46
INTRODUCTION
47
Paragraph number 1 Non Alcoholic Fatty Liver Disease (NAFLD) is a condition present 48
in up to 30% of developed countries, with a considerably higher prevalence in the 49
obese populations, particularly in the presence of abdominal or morbid obesity (1-5). 50
NAFLD was shown to result from hepatic fat metabolism imbalance and encompasses 51
several stages, from the initial hepatocyte fat accumulation (hepatic steatosis), to 52
hepatic inflammation (non-alcoholic steatohepatitis) along with a constellation of 53
other disturbances, that ultimately can lead to advanced fibrosis, cirrhosis, liver failure 54
and death (6). NAFLD patients have also been reported to have increased 55
cardiovascular risk compared with the general population (7). Insulin resistance and 56
obesity are major risk factors for NAFLD, yet BF accumulation, particularly that of the 57
abdominal region, besides being strongly associated with NAFLD and found to precede 58
presence of insulin resistance (8), may mimic the same metabolic abnormalities 59
triggered by insulin resistance alone (9, 10) and is also associated with other metabolic 60
disorders that can also increase the risk of NAFLD, therefore, BF may be a key factor in 61
the etiology of NAFLD (6). 62
Paragraph number 2 Heart rate recovery (HRR) after exercise is a recognized cardiac 63
autonomic control marker mostly reflective of parasympathetic reactivation (11, 12). 64
Slow HRR is independently related to higher risk of mortality and other cardiovascular 65
and metabolic outcomes (13-20). Autonomic nervous system (ANS) imbalance, 66
including blunted HRR, has also been linked to obesity (21), higher body fat (BF) 67
accumulation (22, 23). Kreier and colleagues (24) presented a neuroanatomical 68
evidence for a reciprocal influence of BF, particularly intra-abdominal BF, and ANS, and 69
suggested a pathway for ANS mediated imbalance in several other biological functions 70
including liver fat metabolism, meaning it may be somewhat involved in the etiology, 71
progression, consequences and treatment of both obesity and NAFLD, however this 72
has been largely overlooked, particularly in the population of NAFLD, and research is 73
warranted in this field. Insulin resistance and obesity (main risk factors for hepatic fat 74
accumulation) have been shown to precede the presence of slow HRR (20, 25). Thus, 75
the BF accumulation and distribution has been suggested to be associated with ANS 76
imbalance (22, 26, 27), but this has not yet been tested in NAFLD patients. 77
Paragraph number 3 Very few studies have focused on BF distribution and HRR 78
associations and it is unknown if such a relationship exists in NAFLD patients. The 79
purpose of the present study was to determine if, and to what extent, specific markers 80
of BC and BF distribution, are related with reduced parasympathetic reactivation 81
following maximal exercise, as assessed by heart rate recovery (HRR), in NAFLD 82
patients. 83
84
SUBJECTS AND METHODS
85
Paragraph number 4 Subjects: 86
This study was conducted at Exercise and Health Laboratory, from the 87
Interdisciplinary Centre for the Study of Human Performance (Faculty of Human 88
Kinetics, Technical University of Lisbon, Portugal). To be selected for the present study 89
subjects had to be over 18 years of age without history of hepatotoxic substances 90
intake (eg. steroids) and tobacco consumption. Exclusion criteria included alcohol 91
consumption over 20 gr/day; the presence of other potential causes for fatty liver 92
disease (viral hepatitis, auto-immune disease and others); any physical and/or mental 93
disabilities or any condition that constituted an absolute restriction to exercise, or 94
other diagnosed diseases, with mandatory specific pharmacologic therapy. Not 95
included in the exclusion criteria is the presence of metabolic and cardiovascular 96
disease (insulin resistance, hypertension or dyslipidemia). We studied 25 NAFLD 97
patients (19 males, 51 ± 13 yrs, and 9 females, 47 ± 13 yrs) who were diagnosed 98
through liver biopsy or ultrasound. Subjects were recruited from the outpatient 99
medical departments in Santa Maria Hospital and Curry Cabral Hospital; 59 100
consecutive patients were selected based on selection criteria; 37 of the selected 101
subjects accepted to participate and 28 were found eligible to enter the study after 102
exclusion criteria was considered. Subjects were taking one or more of the following 103
medication: platelet inhibitors, angiotensin-converting enzyme inhibitors, nitrates, 104
statins, ezetimibe, nicotinic acid and biguanides with similar use among both genders. 105
All participants signed an informed consent before being included in the present study 106
and undergoing any study procedure. All methods used in the present study comply 107
with ethics and Portuguese laws and were approved by Faculty of Human Kinetics 108
institutional review board for human studies. The present investigation also complies 109
with the principles outlined in the Declaration of Helsinki. 110
Paragraph number 5 Body composition: 111
Body composition was assessed using Dual Energy X-ray Absorptiometry (DXA) 112
(Explorer W, Hologic; Waltham, MA, USA; Fan bean mode) whole body scans and 113
anthropometric measurements. Repeated measurements in 18 young adults showed a 114
coefficient of variation (CV) of 1.7% for total BF mass and 1.5% for total %BF. All scans 115
were performed in the morning after an overnight 12-hour fast. Quality control with 116
spine phantom was made every morning, and with step phantom every week. By 117
default the DXA software (QDR for windows, version 12.4) estimates the head, trunk, 118
arms and legs, both left and right, regional fat content, according to a three-119
compartment model (fat mass, lean tissue and bone mass). The trunk region of 120
interest (ROI) (CV = 0.005%) includes chest, abdomen and pelvis. Appendicular ROI (CV 121
= 0.004 %) includes both arms plus both legs. All scans were submitted to additional 122
analysis by ROI to assess fat content of the abdominal and central abdominal regions 123
(CV = 0.01 %). The upper and lower limits of the abdominal and central abdominal ROI 124
were determined as the upper edge of the second lumbar vertebra to the lower edge 125
of the fourth lumbar vertebra, respectively (28-30). The lateral limits of the abdominal 126
ROI were determined as to include all trunk length, but exclude any upper limb scan 127
area (29, 30), whereas the vertical sides of central abdominal ROI were the 128
continuation of the lateral sides of the ribs cage, as to exclude the lateral 129
subcutaneous fat of the trunk, including the anterior and posterior subcutaneous 130
abdominal fat, as well as the intra-abdominal fat (28). Absolute and relative BF content 131
results were registered to the nearest 0.01kg and 0.1%, respectively. All scans and 132
analyses were made by the same observer. 133
Paragraph number 6 Anthropometric measurements consisted of weight, height and 134
body mass index (BMI). Body weight was measured to the nearest 0.1kg, and height 135
was measured to the nearest 0.1 cm, on a scale with an attached stadiometer (model 136
770, Seca; Hamburg, Deutschland), according to standard protocol (31). Both weight 137
and Height were used to calculate the subject’s BMI, by dividing the weight, in kg, by 138
the squared height, in meters (BMI = weight [kg] / height [m]2). 139
Paragraph number 7 Body fat distribution: 140
BF distribution variables were calculated using ratios between BF content 141
absolute values of different fat depots, obtained by DXA, as done elsewhere (30). The 142
trunk BF-to-appendicular BF ratio, also called trunk-to-extremity fat ratio (32) or 143
central-to-peripheral fat mass ratio (33), was calculated as the trunk BF content 144
divided by the sum of the BF content of the arms and legs, both left and right. The 145
abdominal BF-to-trunk BF ratio was calculated as the fat content of the selected 146
abdominal ROI divided by the trunk BF. The abdominal BF-to-total BF was calculated as 147
the selected abdominal ROI fat content divided by the whole BF. Ratios were 148
registered to the nearest 0,01. 149
Paragraph number 8 Exercise testing: 150
All subjects underwent a treadmill (Q-65, Quinton, Cardiac Science Corp; Bothell, 151
WA, USA) graded exercise test (GXT) using Bruce standard protocol (34). All GXT were 152
monitored using a 12 lead electrocardiogram PC-based acquisition module (Welch-153
Allyn PCE-210, Welch Allyn Inc.; Skaneateles Falls, NY, USA) and the data, including 154
heart rate (HR), were monitored and recorded using Welch Allyn CardioPerfect 155
software (Welch Allyn Inc.; Skaneateles Falls, NY, USA). Oxygen uptake was monitored 156
during GXT using a MedGraphics CPX Ultima Cardio metabolic cart (Medical Graphics 157
Corp; St Paul, MN, USA) and data was recorded using Breeze Suite software (version 158
6.4.1, Medical Graphics Corp; St Paul, MN). Subjects exercised until at least two of the 159
following test termination criteria were reached (35): (1) subjects volitional fatigue; (2) 160
respiratory exchange ratio reached 1.1 or higher; (3) subjects reached age predicted 161
maximal HR (HRmax); (4) oxygen uptake did not increase in spite of increasing work 162
load. 163
Paragraph number 9 Heart Rate Recovery: 164
When GXT termination criteria were reached patients started exercise recovery 165
with a speed of 1.5mph and incline of 2.5% on the treadmill. Subjects remained 166
walking with the recovery treadmill mechanical load for 2 minutes. After 2 minutes of 167
recovery the treadmill was stopped and subjects continued their recovery seated in an 168
armless standard chair. HR was recorded beat-by-beat and was averaged at 15 seconds 169
intervals for identifying HRmax. HR at the end of the first and second recovery minutes 170
were recorded from beat-by-beat records (HR1 and HR2, respectively). HRR was 171
calculated as the difference between observed HRmax and HR1 (HRR1 = HRmax – HR1) 172
and HR2 (HRR2 = HRmax – HR2). Cut off value for identifying slow HRR was considered 173
12bpm for HRR1 (13-15, 19). The 22bpm cut off value for identifying slow HRR2 was 174
developed using a supine recovery protocol (18, 36), however it has been used with 175
diverse exercise recovery protocols, including seated (37) and walking (20) recovery 176
protocols and therefore was adopted in the present study for descriptive purposes 177
only. 178
Paragraph number 10 Statistical methods: 179
Descriptive statistics are presented as mean ± SD and range for all analyzed 180
variables. The Gaussian distribution of the data was assessed with the Shapiro-Wilk 181
goodness-of-fit test. Partial and part, also called semipartial (38), correlations were 182
performed to assess the relations between dependent and independent variables 183
controlling for age and sex. When age was an independent variable the correlation was 184
controlled for sex and fat distribution. In order to accomplish a statistical power of 80% 185
(β = 0.20) at a statistical significance level of 5% (α = 0.05), as has been used as a 186
convention (38), only coefficients of correlation equal or superior to 0.5, corresponding 187
to a large effect size, were considered significant and unexposed to type I and II errors 188
(38). Multiple linear regressions were conducted, using Enter method, between 189
dependent variables and correlated independent variables to analyze r square change 190
when using two predictors in the model. Stepwise regressions were performed to find 191
preferred models for the prediction of both dependent variables (HRR1 and HRR2). 192
The level of significance was set at P<0.05 (two-tailed). Statistical calculations were 193
performed using the IBM SPSS Statistics version 19 (SPSS, inc, Chicago, IL). 194
195
RESULTS
196
Paragraph number 11 Mean values for all studied variables are presented in Table 1. 197
No clinical test interruption criteria, such as electrocardiogram signs of ischemia, new 198
onset of arrhythmias, or excessive hypotensive/hypertensive response, were observed 199
in any GXT. All subjects met termination criteria for ending the GXT. From among the 200
25 studied NAFLD patients slow HRR1 was present in 6 (22.2%, 2 were female) and 201
slow HRR2 in 5 (18.5%, 2 were female) patients. Neither HRR1 nor HRR2 were different 202
between men and women (p=0.754 and p=0.631 obtained in an independent samples t 203
test comparison, respectively). Mean BMI of the studied sample was in the overweight 204
category, with no differences between sexes (p=0.075 on independent samples t test). 205
BMI was also not related with age (r= -0.218; p=0.285 on Pearson correlation). 206
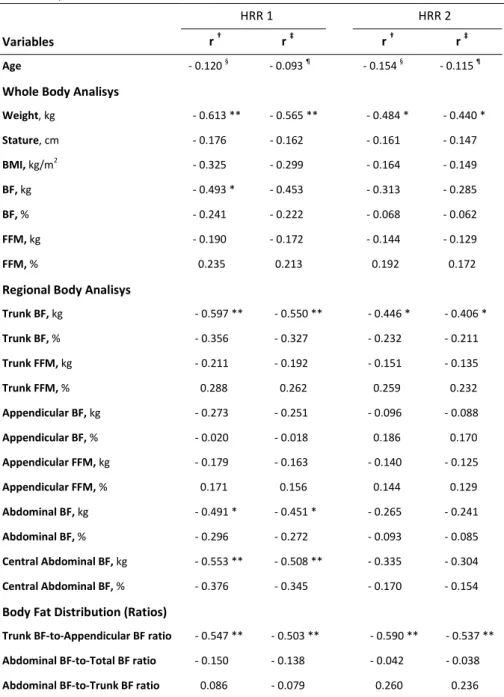
Paragraph number 12 Table 2 shows the results for partial and semipartial 207
correlations between each independent variable and each dependent variable (HRR1 208
and HRR2), controlled for sex and age (unless otherwise noted). Only the studied BF 209
compartments, not fat free mass, were related to HRR. On a whole body analysis only 210
weight was found negatively correlated with HRR1 (p=0.002), in partial correlations 211
and semipartial correlations. The regional BC analysis showed that trunk BF (p=0.003) 212
and central Abdominal BF (p=0.009) were negatively correlated with HRR1 but not 213
with HRR2, both in partial and semipartial correlations, independently of sex and age. 214
The analysis of BF distribution indicated that the trunk BF divided by appendicular BF 215
was the only studied BF distribution marker related to HRR1 (p=0.008) and the only 216
studied independent variable to be related to HRR2 (p=0.003) in both partial and 217
semipartial correlations, when controlled for sex and age. Age, when controlled for sex 218
and BF distribution, was not related to neither HRR1 nor HRR2 (p=0.596 and p=0.483, 219
respectively). 220
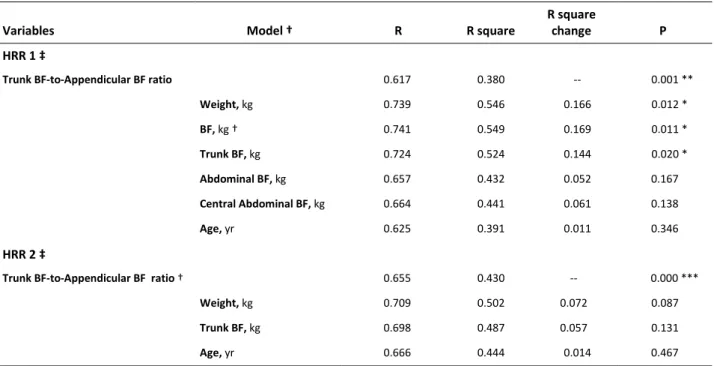
Paragraph number 13 All independent variables that showed significant relation with 221
HRR in partial and semipartial correlations were included in multiple linear regression 222
analysis shown in table 3. Regressions were performed using only trunk BF-to-223
appendicular BF ratio and age, which has been suggested to influence HRR in healthy 224
adults (20), as predictors of either HRR1 or HRR2, and also between pairs of 225
independent variables to predict HRR1. Because trunk BF-to-appendicular BF ratio was 226
the only independent variable correlated with both dependent variables, it was chosen 227
as a fixed independent variable in multiple linear regressions. The higher R square 228
change in the prediction of HRR1 seems to be that obtained by adding weight to trunk 229
BF-to-appendicular BF ratio in the prediction model. In the prediction of HRR2 Trunk 230
BF-to-appendicular BF ratio alone was found to predict over 40% of the variation of 231
HRR2, in this sample of NAFLD patients. 232
233
DISCUSSION
234
Paragraph number 14 To our knowledge this is the first study to focus on the 235
association between HRR, and BC and/or BF distribution, in NAFLD patients. Most 236
studies on HRR focus primarily on cardiovascular outcomes and have not included BC 237
variables (12-16). Some previous population-based reports showed slower HRR in 238
patients with higher BMI (25, 39). Nilsson and colleagues found similar results in elders 239
(27). In a recent report, BMI showed the highest odds ratio for slow HRR2 (OR=6.58) 240
over a 20 yr period, after controlling for baseline HRR (20). In our sample BMI was not 241
associated with either HRR1 or HRR2, after controlling for age and sex. Similar results 242
had also been found in a sample of type 2 diabetes mellitus patients (19). These 243
discrepancies may be explained by differences in studied samples as well as in research 244
protocols, including different HRR record timing criterion as well as considerable 245
exercise protocol differences either in the effort as in the recovery phase. Nevertheless 246
the development of slow HRR seems more likely in those who have more BF 247
accumulation (20, 25, 37). 248
Paragraph number 15 A recent report showed that the sum of skinfolds accounted for 249
the greatest variance of both HRR1 and HRR2, as compared with BMI, waist 250
circumference (WC) and maximal oxygen consumption (23). They used mainly skinfolds 251
from the trunk region, including the abdominal skinfold, which can reinforce the 252
importance of central BC for appropriate ANS function. In accordance to this, the 253
present results showed trunk BF and CAbd BF to be significant correlated with HRR1, 254
independent of age and sex. Few studies could be found using different BC markers, 255
besides BMI, when focusing on HRR, nevertheless some investigations have used WC 256
to assess central obesity or central as well as whole BF accumulation and found 257
concordant results to ours (20). Mean WC has been shown to be higher in patients 258
with slow HRR (20, 25). The association between slow HRR and WC has been shown to 259
be stronger than with BMI (adjusted for age, race and sex) (25) as well as with all 260
metabolic syndrome components (27). In the present study the results on central BF 261
variables, particularly abdominal fat and central abdominal fat, also show a negative 262
correlation with HRR1, but not with HRR2. Kim and colleagues (22) found somewhat 263
concordant results concerning the relation between visceral fat, particularly that 264
around the myocardium, and both HRR1 and HRR2. The only study we found focusing 265
on HRR and regional body composition analysis using DXA showed no differences in 266
HRR between overweight young adults and lean control subjects, in a sample of 267
overnight sleep apnea patients, even though overweight subjects were significantly 268
heavier, and had higher BMI, %BF and central abdominal BF (40). 269
Paragraph number 17 In the present study Trunk BF: Appendicular BF ratio was the 270
only BF distribution marker that was related to HRR, moreover this BF distribution 271
marker was the only studied independent variable to show correlation magnitudes 272
with both HRR1 and HRR2 that correspond to a large effect size, even after removing 273
the effect of sex and age. Multiple regression also revealed that other BC variables 274
added little predictive capacity to Trunk BF-to-Appendicular BF ratio. These results 275
emphasize that BF distribution may be more important for ANS function than the 276
absolute or relative amount of BF. Because HRR has been considered a powerful 277
predictor of cardiovascular, as well as overall, mortality (13, 14, 17, 19, 41-44), the 278
present results suggest that a central BF distribution, particularly Trunk BF-to-279
Appendicular BF ratio, can possibly relate more strongly to cardiovascular increased 280
risk. The importance of a central distribution of BF was noticed before, using HRV to 281
assess ANS function (26). In that study, abdominal-to-peripheral fat distribution, assess 282
by dividing abdominal by thigh DXA estimated fat contents, was found to explain a 283
significant variation of HRV (26). It is known that the ANS may influence adipocyte fat 284
metabolism by an endocrine pathway and a neuronal pathway (45, 46), and adipocytes 285
from different regions of the body respond differently to the intensity and duration of 286
the endocrine stimulation (47) and may also be controlled by different 287
branches/neurons of the ANS (24). Therefore, the fact that BF distribution was the 288
most consistent correlate with the studied autonomic markers, in the present study, 289
gives strength to the theory that ANS may be somewhat involved, either as a cause or 290
as a consequence, in BC and overall metabolic abnormalities associated with the 291
central BF accumulation phenotype, though this is still speculative at this point. The 292
potential implications of the ANS in the etiology, progression, consequences and 293
treatment of both adverse body fat accumulation patterns and NAFLD should warrant 294
further research. 295
Paragraph number 18 Carnethon et al. (20) showed an association of HRR with aging. 296
In our cross-sectional study the relation of HRR1 and HRR2 with patient’s age, was 297
absent if controlled for BF distribution. Christou and colleagues (26) had long proposed 298
that the changes in fat accumulation pattern that occurs with aging, resulting in BF 299
distribution changes, may contribute to the ANS variation commonly attributed to 300
aging. This is a matter that needs to be confirmed either in the general population as in 301
specific populations such as the NAFLD patients and other metabolic impaired sub-302
populations. 303
Paragraph number 19 The prevalence of slow HRR in the present study is in 304
accordance with most of the published data, including that from the Cleveland Clinic 305
Foundation (13-15) that focused on patients referred for symptom-limited exercise 306
testing, as well as in patients with metabolic impairments (17, 19) or in even more 307
heterogeneous populations (25), in accordance to the understanding that metabolic 308
impairments are somewhat linked to abnormal ANS. Accordingly, when confronted 309
with healthy cohort data, as shown recently by Carnethon and colleagues (20) the 310
prevalence of slow HRR in the present sample was fairly high. The prevalence of high 311
levels of BMI, including obese and morbidly obese patients, in the present sample was 312
expected since obesity, along with insulin resistance, have been identified as the 313
strongest risk factors for NAFLD, and therefore highly prevalent in this sub-population 314
(1-4). 315
Paragraph number 20 There are several strengths and limitations to this study. In the 316
present report autonomic nervous system assessment was restricted to HRR. Previous 317
studies have validated the use of HRR as a marker of parasympathetic reactivation, 318
however HRR is not a direct measure of autonomic nervous system dysfunction but 319
rather is an estimate of parasympathetic response to a specific physiologic challenge 320
(i.e., exercise) (11, 12). Further studies with measures of different components of 321
autonomic nervous system function (e.g., sympathetic input), as well as 322
sympathetic/parasympathetic balance and resting cardiac autonomic control, are 323
warranted to confirm our observations. Also our BC assessment method (DXA) albeit 324
being a gold standard instrument to assess BC in a three compartment model, is 325
unable to determine visceral adiposity independently from subcutaneous fat. 326
Nevertheless, recent studies indicate strong correlation between abdominal fat 327
estimated from selected ROI and visceral fat assessed by magnetic resonance imaging 328
(29) and computed tomography (48, 49). Because a cross-sectional approach was used, 329
a causal relation between cardiac autonomic control variation and BC or BF 330
distribution could not be established, based on the present results. Finally, the size of 331
the sample was rather constrained due to difficulties in the recruitment of such a 332
specific sub-population. 90 individuals were coveted to be included in the present 333
sample in the initial research project. This would allow coefficients of correlation as 334
low as 0.3, traditionally corresponding a moderate effect size, to be considered 335
significant and unexposed to type I and II errors (38). Unfortunately, despite all efforts 336
on behalf of everyone involved in this research project, only 28 NAFLD could be 337
recruited. This embodied acknowledged consequences in the statistical power of the 338
present results. Consequently, only associations equal or higher to r=0.50 could be 339
considered to attain minimal statistical power of 80% and statistical significance of 5%, 340
and could be considered fairly unexposed to type 1 and type 2 errors (38). However 341
the aim of the present study was not compromised, neither it’s importance. This study 342
sought to find the best markers, which are found at the higher end of correlational 343
range, so the inability to find significant associations lower than r=0.5, though 344
interesting are not the aim of the present study. Moreover, the present results 345
represent a relevant preliminary analysis to establish the importance of BC and BF 346
distribution in the cardiac autonomic control of NAFLD patients. 347
Paragraph number 21 In the present study BF content and distribution were 348
important contributors to HRR in NAFLD patients. Excess BF accumulated in the trunk 349
or abdominal regions is associated with poor HRR. BF distribution appears to be more 350
important than overall BF accumulation in explaining the variation of HRR and 351
therefore can possibly be a better predictor of cardiovascular risk in NAFLD patients. 352
Therefore, present results also highlight the importance of assessing BF distribution in 353
NAFLD patients, rather than just markers of generalized BF. 354
355
ACKNOWLEDGMENTS
The present study was funded by the Centre for the Study of Human Performance, 357
Portuguese Foundation for Science and Technology, Lisbon, Portugal. 358
359
CONFLICT OF INTEREST
360
The authors have nothing to disclosure. 361
362
REFERENCES
363
1. Bellentani S, Saccoccio G, Masutti F, Croce LS, Brandi G, Sasso F, et al. Prevalence 364
of and risk factors for hepatic steatosis in Northern Italy. Ann Intern Med. 2000 Jan 365
18;132(2):112-7. PubMed PMID: 10644271. 366
2. Nomura H, Kashiwagi S, Hayashi J, Kajiyama W, Tani S, Goto M. Prevalence of fatty 367
liver in a general population of Okinawa, Japan. Jpn J Med. 1988 May;27(2):142-9. 368
PubMed PMID: 3047469. 369
3. Browning JD, Szczepaniak LS, Dobbins R, Nuremberg P, Horton JD, Cohen JC, et al. 370
Prevalence of hepatic steatosis in an urban population in the United States: impact 371
of ethnicity. Hepatology. 2004 Dec;40(6):1387-95. PubMed PMID: 15565570. 372
4. Clark JM. The epidemiology of nonalcoholic fatty liver disease in adults. J Clin 373
Gastroenterol. 2006 Mar;40 Suppl 1:S5-10. PubMed PMID: 16540768. Epub 374
2006/03/17. eng. 375
5. Cortez-Pinto H, Moura MC, Day CP. Non-alcoholic steatohepatitis: from cell 376
biology to clinical practice. Journal of Hepatology. 2006;44:197-208. PubMed 377
PMID: 10553793. 378
6. Angulo P. Nonalcoholic fatty liver disease. N Engl J Med. 2002 Apr 379
18;346(16):1221-31. PubMed PMID: 11961152. 380
7. Targher G, Bertolini L, Padovani R, Rodella S, Zoppini G, Pichiri I, et al. Prevalence 381
of non-alcoholic fatty liver disease and its association with cardiovascular disease 382
in patients with type 1 diabetes. J Hepatol. 2010 Oct;53(4):713-8. PubMed PMID: 383
20619918. 384
8. Rector RS, Thyfault JP, Uptergrove GM, Morris EM, Naples SP, Borengasser SJ, et 385
al. Mitochondrial dysfunction precedes insulin resistance and hepatic steatosis and 386
contributes to the natural history of non-alcoholic fatty liver disease in an obese 387
rodent model. J Hepatol. 2010 May;52(5):727-36. PubMed PMID: 20347174. Epub 388
2010/03/30. eng. 389
9. Cote M, Mauriege P, Bergeron J, Almeras N, Tremblay A, Lemieux I, et al. 390
Adiponectinemia in visceral obesity: impact on glucose tolerance and plasma 391
lipoprotein and lipid levels in men. J Clin Endocrinol Metab. 2005 Mar;90(3):1434-392
9. PubMed PMID: 15598678. 393
10. Gnacinska M, Malgorzewicz S, Stojek M, Lysiak-Szydlowska W, Sworczak K. Role of 394
adipokines in complications related to obesity: a review. Advances in medical 395
sciences. 2009;54(2):150-7. PubMed PMID: 19875356. 396
11. Imai K, Sato H, Hori M, Kusuoka H, Ozaki H, Yokoyama H, et al. Vagally mediated 397
heart rate recovery after exercise is accelerated in athletes but blunted in patients 398
with chronic heart failure. J Am Coll Cardiol. 1994 Nov 15;24(6):1529-35. PubMed 399
PMID: 7930286. Epub 1994/11/15. eng. 400
12. Davrath LR, Akselrod S, Pinhas I, Toledo E, Beck A, Elian D, et al. Evaluation of 401
autonomic function underlying slow postexercise heart rate recovery. Med Sci 402
Sports Exerc. 2006 Dec;38(12):2095-101. PubMed PMID: 17146315. Epub 403
2006/12/06. eng. 404
13. Cole CR, Blackstone EH, Pashkow FJ, Snader CE, Lauer MS. Heart-rate recovery 405
immediately after exercise as a predictor of mortality. N Engl J Med. 1999 Oct 406
28;341(18):1351-7. PubMed PMID: 10536127. Epub 1999/10/28. eng. 407
14. Vivekananthan DP, Blackstone EH, Pothier CE, Lauer MS. Heart rate recovery after 408
exercise is a predictor of mortality, independent of the angiographic severity of 409
coronary disease. J Am Coll Cardiol. 2003 Sep 3;42(5):831-8. PubMed PMID: 410
12957428. Epub 2003/09/06. eng. 411
15. Diaz LA, Brunken RC, Blackstone EH, Snader CE, Lauer MS. Independent 412
contribution of myocardial perfusion defects to exercise capacity and heart rate 413
recovery for prediction of all-cause mortality in patients with known or suspected 414
coronary heart disease. J Am Coll Cardiol. 2001 May;37(6):1558-64. PubMed 415
PMID: 11345365. Epub 2001/05/10. eng. 416
16. Arena R, Guazzi M, Myers J, Peberdy MA. Prognostic value of heart rate recovery 417
in patients with heart failure. Am Heart J. 2006 Apr;151(4):851 e7-13. PubMed 418
PMID: 16569547. Epub 2006/03/30. eng. 419
17. Cheng YJ, Lauer MS, Earnest CP, Church TS, Kampert JB, Gibbons LW, et al. Heart 420
rate recovery following maximal exercise testing as a predictor of cardiovascular 421
disease and all-cause mortality in men with diabetes. Diabetes Care. 2003 422
Jul;26(7):2052-7. PubMed PMID: 12832312. Epub 2003/07/02. eng. 423
18. Lipinski MJ, Vetrovec GW, Froelicher VF. Importance of the first two minutes of 424
heart rate recovery after exercise treadmill testing in predicting mortality and the 425
presence of coronary artery disease in men. Am J Cardiol. 2004 Feb 15;93(4):445-426
9. PubMed PMID: 14969619. Epub 2004/02/19. eng. 427
19. Chacko KM, Bauer TA, Dale RA, Dixon JA, Schrier RW, Estacio RO. Heart rate 428
recovery predicts mortality and cardiovascular events in patients with type 2 429
diabetes. Med Sci Sports Exerc. 2008 Feb;40(2):288-95. PubMed PMID: 18202573. 430
Epub 2008/01/19. eng. 431
20. Carnethon MR, Sternfeld B, Liu K, Jacobs DR, Jr., Schreiner PJ, Williams OD, et al. 432
Correlates of heart rate recovery over 20 years in a healthy population sample. 433
Med Sci Sports Exerc. 2012 Feb;44(2):273-9. PubMed PMID: 21796053. Epub 434
2011/07/29. eng. 435
21. Bray GA. Obesity, a disorder of nutrient partitioning: the MONA LISA hypothesis. J 436
Nutr. 1991 Aug;121(8):1146-62. PubMed PMID: 1861165. Epub 1991/08/01. eng. 437
22. Kim MK, Tanaka K, Kim MJ, Matsuo T, Tomita T, Ohkubo H, et al. Epicardial fat 438
tissue: relationship with cardiorespiratory fitness in men. Med Sci Sports Exerc. 439
2010 Mar;42(3):463-9. PubMed PMID: 19952810. Epub 2009/12/03. eng. 440
23. Esco MR, Williford HN, Olson MS. Skinfold thickness is related to cardiovascular 441
autonomic control as assessed by heart rate variability and heart rate recovery. J 442
Strength Cond Res. 2011 Aug;25(8):2304-10. PubMed PMID: 21691230. Epub 443
2011/06/22. eng. 444
24. Kreier F, Kap YS, Mettenleiter TC, van Heijningen C, van der Vliet J, Kalsbeek A, et 445
al. Tracing from fat tissue, liver, and pancreas: a neuroanatomical framework for 446
the role of the brain in type 2 diabetes. Endocrinology. 2006 Mar;147(3):1140-7. 447
PubMed PMID: 16339209. Epub 2005/12/13. eng. 448
25. Kizilbash MA, Carnethon MR, Chan C, Jacobs DR, Sidney S, Liu K. The temporal 449
relationship between heart rate recovery immediately after exercise and the 450
metabolic syndrome: the CARDIA study. Eur Heart J. 2006 Jul;27(13):1592-6. 451
PubMed PMID: 16728422. Epub 2006/05/27. eng. 452
26. Christou DD, Jones PP, Pimentel AE, Seals DR. Increased abdominal-to-peripheral 453
fat distribution contributes to altered autonomic-circulatory control with human 454
aging. Am J Physiol Heart Circ Physiol. 2004 Oct;287(4):H1530-7. PubMed PMID: 455
15178547. Epub 2004/06/05. eng. 456
27. Nilsson G, Hedberg P, Jonason T, Lonnberg I, Ohrvik J. Heart rate recovery is more 457
strongly associated with the metabolic syndrome, waist circumference, and insulin 458
sensitivity in women than in men among the elderly in the general population. Am 459
Heart J. 2007 Sep;154(3):460 e1-7. PubMed PMID: 17719290. Epub 2007/08/28. 460
eng. 461
28. Kamel EG, McNeill G, Van Wijk MC. Usefulness of anthropometry and DXA in 462
predicting intra-abdominal fat in obese men and women. Obes Res. 2000 463
Jan;8(1):36-42. PubMed PMID: 10678257. 464
29. Park YW, Heymsfield SB, Gallagher D. Are dual-energy X-ray absorptiometry 465
regional estimates associated with visceral adipose tissue mass? Int J Obes Relat 466
Metab Disord. 2002 Jul;26(7):978-83. PubMed PMID: 12080453. 467
30. Pimenta NM, Santa-Clara H, Sardinha LB, Fernhall B. Body Fat Responses to a 1-468
Year Combined Exercise Training Program in Male Coronary Artery Disease 469
Patients. Obesity. 2013 Apr/2013;21(4):723-30. PubMed PMID: 22810978. Epub 470
2012/07/20. Eng. 471
31. Lohman TG, Roche AF, Martorell R. Anthropometric Standardization Reference 472
Manual. Champaign: Human Kinetics; 1988. 473
32. Savgan-Gurol E, Bredella M, Russell M, Mendes N, Klibanski A, Misra M. Waist to 474
hip ratio and trunk to extremity fat (DXA) are better surrogates for IMCL and for 475
visceral fat respectively than for subcutaneous fat in adolescent girls. Nutr Metab 476
(Lond). 2010;7:86. PubMed PMID: 21143876. Epub 2010/12/15. eng. 477
33. Ketel IJ, Volman MN, Seidell JC, Stehouwer CD, Twisk JW, Lambalk CB. Superiority 478
of skinfold measurements and waist over waist-to-hip ratio for determination of 479
body fat distribution in a population-based cohort of Caucasian Dutch adults. Eur J 480
Endocrinol. 2007 Jun;156(6):655-61. PubMed PMID: 17535865. Epub 2007/05/31. 481
eng. 482
34. Bruce RA. Exercise testing of patients with coronary heart disease. Principles and 483
normal standards for evaluation. Ann Clin Res. 1971 Dec;3(6):323-32. PubMed 484
PMID: 5156892. Epub 1971/12/01. eng. 485
35. Howley ET, Bassett DR, Jr., Welch HG. Criteria for maximal oxygen uptake: review 486
and commentary. Med Sci Sports Exerc. 1995 Sep;27(9):1292-301. PubMed PMID: 487
8531628. Epub 1995/09/01. eng. 488
36. Shetler K, Marcus R, Froelicher VF, Vora S, Kalisetti D, Prakash M, et al. Heart rate 489
recovery: validation and methodologic issues. J Am Coll Cardiol. 2001 490
Dec;38(7):1980-7. PubMed PMID: 11738304. Epub 2001/12/12. eng. 491
37. Carnethon MR, Jacobs DR, Jr., Sidney S, Sternfeld B, Gidding SS, Shoushtari C, et al. 492
A longitudinal study of physical activity and heart rate recovery: CARDIA, 1987-493
1993. Med Sci Sports Exerc. 2005 Apr;37(4):606-12. PubMed PMID: 15809559. 494
Epub 2005/04/06. eng. 495
38. Cohen J, Cohen P. Applied Multiple Regression/Correlation Analysis for the 496
Behavioral Sciences. 2nd ed. Hillsdale, NJ: Lawrence Erkbaum Associates, Inc.; 497
1983. 545 p. 498
39. Panzer C, Lauer MS, Brieke A, Blackstone E, Hoogwerf B. Association of fasting 499
plasma glucose with heart rate recovery in healthy adults: a population-based 500
study. Diabetes. 2002 Mar;51(3):803-7. PubMed PMID: 11872683. Epub 501
2002/03/02. eng. 502
40. Hargens TA, Guill SG, Zedalis D, Gregg JM, Nickols-Richardson SM, Herbert WG. 503
Attenuated heart rate recovery following exercise testing in overweight young 504
men with untreated obstructive sleep apnea. Sleep. 2008 Jan;31(1):104-10. 505
PubMed PMID: 18220083. Epub 2008/01/29. eng. 506
41. Chen MS, Blackstone EH, Pothier CE, Lauer MS. Heart rate recovery and impact of 507
myocardial revascularization on long-term mortality. Circulation. 2004 Nov 508
2;110(18):2851-7. PubMed PMID: 15505081. Epub 2004/10/27. eng. 509
42. Hadley DM, Dewey FE, Freeman JV, Myers JN, Froelicher VF. Prediction of 510
cardiovascular death using a novel heart rate recovery parameter. Med Sci Sports 511
Exerc. 2008 Jun;40(6):1072-9. PubMed PMID: 18460999. Epub 2008/05/08. eng. 512
43. Myers J, Tan SY, Abella J, Aleti V, Froelicher VF. Comparison of the chronotropic 513
response to exercise and heart rate recovery in predicting cardiovascular 514
mortality. Eur J Cardiovasc Prev Rehabil. 2007 Apr;14(2):215-21. PubMed PMID: 515
17446799. Epub 2007/04/21. eng. 516
44. Nishime EO, Cole CR, Blackstone EH, Pashkow FJ, Lauer MS. Heart rate recovery 517
and treadmill exercise score as predictors of mortality in patients referred for 518
exercise ECG. Jama. 2000 Sep 20;284(11):1392-8. PubMed PMID: 10989401. Epub 519
2000/09/16. eng. 520
45. Horowitz JF. Adipose Tissue Lipid Metabolism During Exercise. In: Hargreaves M, 521
Spriet L, editors. Exercise Metabolism. Champaign: Human Kinetics; 2006. p. 89-522
104. 523
46. Bartness TJ, Song CK. Thematic review series: adipocyte biology. Sympathetic and 524
sensory innervation of white adipose tissue. Journal of lipid research. 2007 525
Aug;48(8):1655-72. PubMed PMID: 17460327. 526
47. Lafontan M, Berlan M. Fat cell adrenergic receptors and the control of white and 527
brown fat cell function. Journal of lipid research. 1993 Jul;34(7):1057-91. PubMed 528
PMID: 8371057. 529
48. Bertin E, Marcus C, Ruiz JC, Eschard JP, Leutenegger M. Measurement of visceral 530
adipose tissue by DXA combined with anthropometry in obese humans. Int J Obes 531
Relat Metab Disord. 2000 Mar;24(3):263-70. PubMed PMID: 10757618. Epub 532
2000/04/11. eng. 533
49. Snijder MB, Visser M, Dekker JM, Seidell JC, Fuerst T, Tylavsky F, et al. The 534
prediction of visceral fat by dual-energy X-ray absorptiometry in the elderly: a 535
comparison with computed tomography and anthropometry. Int J Obes Relat 536
Metab Disord. 2002 Jul;26(7):984-93. PubMed PMID: 12080454. Epub 2002/06/25. 537 eng. 538 539 540 541 542 543 544 545
TABLES:
546 547
Table 1. Descriptive data of the studied sample.
548
NAFLD Patients (n=25)
Variables Mean + sd * Min. – Max.
Age, yr (median, yr) 48.6 ± 12.8 (49) 25 – 68
Sex, n female (% female) 8 (30.8)
VO2max, ml/kg/min 24.9 ± 6.4 13.8 – 38.0
Type 2 Diabetes Mellitus, n (%) 8 (28.6) Insulin resistance, n (%) 12 (42.9)
HRR1, bpm 19.4 ± 10.1 -4.0 – 37.0
HRR2, bpm 35.9 ± 16.7 -8.0 – 67.0
Whole Body Analisys
Weight, kg 88.0 ± 12.8 66.2 – 115.8
Stature, cm 167.3 ± 9.4 149.5 – 183.7
BMI, kg/m2 (% obese) 29.1 ± 4.1 (34.6) 22.6 – 42.2
BF, kg (%) 27.5 ± 9.4 (31.52 ± 8.29) 13.7 – 51.2 (18.84 – 46.28) FFM, kg (%) 58.8 ± 9.2 (68.48 ± 8.29) 39.6 – 77.7 (53.72 – 81.16)
Regional Body Analisys
Trunk BF, kg (%) 15.4 ± 5.2 (33.37 ± 7.71) 7.4 – 25.0 (20.87 – 48.01) Trunk FFM kg (%) 29.9 ± 4.0 (66.63 ± 7.31) 21.1 – 38.6 (51.99 – 79.13) Appendicular BF, kg (%) 11.0 ± 4.8 (30.63 ± 10.54) 5.2 – 25.7 (13.63 – 50.40) Appendicular FFM, kg (%) 28.5 ± 5.1 (80.40 ± 6.56) 19.2 – 36.7 (68.64 – 90.66) Abdominal BF, kg (%) 3.5 ± 1.2 (37.99 ± 6.67) 1.7 – 6.3 (26.09 – 49.40) Central Abdominal BF, kg (%) 2.9 ± 0.8 (35.94 ± 5.78) 1.6 – 5.0 (24.28 – 44.64)
Body Fat Distribution (Ratios)
Trunk BF-to-Appendicular BF ratio 1.478 ± 0.378 0.958 – 2.547 Abdominal BF-to-Total BF ratio 0.130 ± 0.026 0.045 – 0.185 Abdominal BF-to-Trunk BF ratio 0.233 ± 0.040 0.095 – 0.299
* results are presented as mean ± standard deviation, unless otherwise noted; VO2max – maximal oxygen
549
consumption; BF – body fat; BMI – body mass index; FFM – fat free mass; HRR1 – heart rate recovery at 1 min.;
550
HRR2 – heart rate recovery at 2 min.; Máx. – highest observed value; Min. – lowest observed value.
551 552 553 554
Table 2. Partial and semipartial correlations between dependent and 555 independent variables. 556 HRR 1 HRR 2 Variables r † r ‡ r † r ‡ Age - 0.120 § - 0.093 ¶ - 0.154 § - 0.115 ¶
Whole Body Analisys
Weight, kg - 0.613 ** - 0.565 ** - 0.484 * - 0.440 * Stature, cm - 0.176 - 0.162 - 0.161 - 0.147 BMI, kg/m2 - 0.325 - 0.299 - 0.164 - 0.149 BF, kg - 0.493 * - 0.453 - 0.313 - 0.285 BF, % - 0.241 - 0.222 - 0.068 - 0.062 FFM, kg - 0.190 - 0.172 - 0.144 - 0.129 FFM, % 0.235 0.213 0.192 0.172 Regional Body Analisys
Trunk BF, kg - 0.597 ** - 0.550 ** - 0.446 * - 0.406 * Trunk BF, % - 0.356 - 0.327 - 0.232 - 0.211 Trunk FFM, kg - 0.211 - 0.192 - 0.151 - 0.135 Trunk FFM, % 0.288 0.262 0.259 0.232 Appendicular BF, kg - 0.273 - 0.251 - 0.096 - 0.088 Appendicular BF, % - 0.020 - 0.018 0.186 0.170 Appendicular FFM, kg - 0.179 - 0.163 - 0.140 - 0.125 Appendicular FFM, % 0.171 0.156 0.144 0.129 Abdominal BF, kg - 0.491 * - 0.451 * - 0.265 - 0.241 Abdominal BF, % - 0.296 - 0.272 - 0.093 - 0.085 Central Abdominal BF, kg - 0.553 ** - 0.508 ** - 0.335 - 0.304 Central Abdominal BF, % - 0.376 - 0.345 - 0.170 - 0.154 Body Fat Distribution (Ratios)
Trunk BF-to-Appendicular BF ratio - 0.547 ** - 0.503 ** - 0.590 ** - 0.537 ** Abdominal BF-to-Total BF ratio - 0.150 - 0.138 - 0.042 - 0.038 Abdominal BF-to-Trunk BF ratio 0.086 - 0.079 0.260 0.236
BF – body fat; BMI – body mass index; FFM – fat free mass; HRR1 – heart rate recovery at 1
557
min.; HRR2 – heart rate recovery at 2 min.; † – partial correlations controlling for age and sex
558
(except when age is a variable); ‡ – semipartial correlations removing the effect of age and
559
sex (except when age is a variable); § – partial correlation controlling for trunk BF/ Limb BF
560
ratio and sex; ¶ – semipartial correlation removing the effect of trunk BF/ Limb BF ratio and
561
sex. * - significant for p<0.05; ** - significant for p<0.01; *** - significant for p<0.001.
562 563 564
Table 3. Linear regressions with R square change analisys (Enter method) between dependent and
565
related independent variables.
566
Variables Model † R R square
R square
change P
HRR 1 ‡
Trunk BF-to-Appendicular BF ratio 0.617 0.380 -- 0.001 **
Weight, kg 0.739 0.546 0.166 0.012 * BF, kg † 0.741 0.549 0.169 0.011 * Trunk BF, kg 0.724 0.524 0.144 0.020 * Abdominal BF, kg 0.657 0.432 0.052 0.167 Central Abdominal BF, kg 0.664 0.441 0.061 0.138 Age, yr 0.625 0.391 0.011 0.346 HRR 2 ‡
Trunk BF-to-Appendicular BF ratio † 0.655 0.430 -- 0.000 ***
Weight, kg 0.709 0.502 0.072 0.087
Trunk BF, kg 0.698 0.487 0.057 0.131
Age, yr 0.666 0.444 0.014 0.467
BF – body fat; HRR1 – heart rate recovery at 1 min.; HRR2 – heart rate recovery at 2 min.; † – Regressions were
567
conducted using pairs of independent variables, which include always Trunk BF/Appendicular BF ratio plus one
568
of the listed variables; ‡ – Dependent variable in the following regressions. * – significant for p<0.05; ** –
569
significant for p<0.01; *** – significant for p<0.001.
570 571 572