UNIVERSIDADE DE LISBOA Faculdade de Medicina
Detection of actionable mutations in ctDNA in advanced
breast cancer patients
Inês Isabel Vendrell Vidal Dias
Orientadores:
Prof. Doutor Luís António Marques da Costa
Prof. Doutora Maria do Carmo Salazar Velez Roque da Fonseca
Dissertação especialmente elaborada para obtenção de grau de mestre em Oncobiologia 2018
Faculdade de Medicina
Detection of actionable mutations in ctDNA in advanced
breast cancer patients
Inês Isabel Vendrell Vidal Dias
Orientadores:
Prof. Doutor Luís António Marques da Costa
Prof. Doutora Maria do Carmo Salazar Velez Roque da Fonseca
Dissertação especialmente elaborada para obtenção de grau de mestre em Oncobiologia 2018
Todas as afirmações efetuadas no presente documento são da exclusiva responsabilidade do seu autor, não cabendo qualquer responsabilidade à Faculdade de Medicina de Lisboa pelos conteúdos nele apresentados.
A impressão desta dissertação foi aprovada pelo Conselho Científico da Faculdade de Medicina de Lisboa em reunião de 23 de Novembro de 2018.
Agradecimentos
Por todo o apoio na realização deste projecto, gostaria de agradecer aos meus
orientadores, Prof. Doutor Luís Costa e Prof. Doutora Carmo Fonseca sem os quais o a
realização deste estudo não teria sido possível. Um especial agradecimento à Dr.ª
Catarina Silveira, por todo o tempo, disponibilidade e apoio ao longo de todo o percurso,
mesmo nos momentos mais desafiantes.
Agradeço ainda o apoio do Fundo iMM Laço cujo financiamento foi essencial.
A prossecução deste projecto concomitantemente com internato médico foi
particularmente complexa e só foi possível com o apoio e compreensão incondicionais
da minha família.
Aos doentes que participaram neste estudo e seus familiares que, de uma forma mais
ou menos directa me encorajaram durante todo o percurso gostaria de deixar o meu
agradecimento. São eles que de facto justificam todo o trabalho, dedicação e incessante
procura de conhecimento.
Agradeço ainda o apoio fundamental do Fundo iMM-LAÇO que permitiu financiar todas
as atividades laboratoriais conducentes aos resultados moleculares apresentados.
Abstract
Background: Breast Cancer (BC) is one of the most important causes of death by cancer in the world. Cancer mortality is directly related to the inability of curing advanced disease. Much has been the effort in the last decades to develop new drugs.
Precision oncology aims at delivering the most adequate treatment to each patient according to the specific characteristics of the disease at each time point. Nevertheless, considering tumor heterogeneity, both temporal and spatial, tissue biopsies might be less accurate than new emerging techniques such as circulating cell-free tumor DNA (ctDNA) analysis in blood – liquid biopsy. It is estimated that 80-90% of advanced cancer patients have genetic alterations that could potentially be targeted with a specific drug and some studies suggest that patients treated with these targeted drugs might have better outcomes, although there is controversy.
This is a proof-of-concept study. With this study we aimed to determine:
1. If ctDNA can be isolated from plasma samples of patients with metastatic BC;
2. If it is possible to detect specific druggable mutations and amplifications in ctDNA, namely: PIK3CA mutation and amplification, AKT1 mutation, AKT2 amplification, EGFR amplification, FGFR1 amplification;
3. If there is an association between genetic alterations detectable in plasma and tumor biopsies performed at the same time.
Methods: This is a single center prospective observational study with sample collection. We included patients with metastatic BC (MBC) de novo or after progression or relapse. We also included stage III BC patients with advanced unresectable disease. Only patients with clinical indication for re-biopsy and who gave consent for biopsy and blood sample collection were included. For each patient, analysis of the tumor and blood sample were performed with a maximum 8-week interval.
DNA was extracted from tissue samples and ctDNA was isolated from plasma. Digital droplet PCR (ddPCR) was used to detect amplifications and massive parallel sequencing (MPS) was used for mutations. We extracted germline DNA (gDNA) from leukocytes to screen for mutations in targeted genes, in order to prove a potential somatic origin for the detected mutations.
Results: We enrolled 2 patients who had undergone previous lines of treatment and progressed. While patient 001 had MBC (rebiopsy of a lung metastasis), patient 002 had locally advanced, unresectable disease (rebiopsy of the breast).
Regarding amplification of the genes tested, we detected an amplification in FGFR1 in patient 001, both in tissue (8.5-fold increase in copy number) and plasma samples (9.7-fold increase in copy number).
We also detected a PIK3CA mutation in exon 10 (coding exon 9) in patient 002, which is one of the most frequent mutations in PIK3CA found in BC [c.1633G>A p.(E545K)]. This mutation was detected only in tissue sample and not in ctDNA; this mutation was proven somatic since it was not present in the gDNA.
Conclusions: We succeeded to isolate ctDNA from plasma samples for both patients – proven by the finding of the somatic variants. We were able to detect one actionable alteration for each patient: FGFR1 amplification was present in both tissue and ctDNA of patient 001. Regarding patient 002 a mutation in PIK3CA was detected, although only in tumor tissue sample. We did not find a complete concordance between mutations detected in tumor tissue and plasma samples. This might be due to several reasons, either technical or biological.
Keywords: Metastatic Breast Cancer, Precision Oncology, Liquid Biopsies, Druggable mutations and amplifications
Resumo
Racional: O cancro da mama é, mundialmente, uma das principais causas de morte por cancro. A mortalidade relaciona-se directamente com a incapacidade de curar a doença avançada. Nas últimas décadas têm-se empreendido importantes esforços no desenvolvimento de novos fármacos.
A oncologia de precisão almeja providenciar a terapêutica mais adequada a cada doente de acordo com as características específicas da doença, em cada momento. Contudo considerando a heterogeneidade tumoral, quer temporal quer espacial, as biópsias tecidulares podem ser menos precisas que novas técnicas tal como a análise de DNA tumoral circulante no sangue (ctDNA) – biópsia líquida. Estima-se que 80-90% dos doentes com cancros avançados apresentem alterações genéticas a nível do tumor que poderiam potencialmente ser alvo de terapêutica com fármacos dirigidos. Na verdade, alguns estudos sugerem que os doentes tratados com fármacos dirigidos tenham melhores resultados em termos de saúde, embora seja controverso.
Este é um estudo de prova de conceito. Com este estudo procuramos determinar:
1. Se o ctDNA pode ser isolado de amostras plasmáticas de doentes com cancro da mama metastático;
2. Se é possível detectar determinadas mutações e amplificações que possam ser alvo terapêutico no ctDNA. Nomeadamente: mutação e amplificação PIK3CA, mutação AKT1, amplificação AKT2, amplificação EGFR, amplificação FGFR1;
3. Se há associação entre as alterações genéticas detectadas no plasma e em biópsias tecidulares realizadas simultaneamente.
Métodos: Este é um estudo observacional prospetivo unicêntrico com colheita de amostras. Incluímos doentes com cancro da mama metastático de novo ou após recidiva ou progressão. Também incluímos doentes com cancro da mama estadio III com doença irressecável. Foram apenas incluídos doentes com indicação clínica para re-biópsia e que consentiram quer a colheita de tecido quer de sangue. Para cada doente a análise tumoral e de plasma foram realizadas com um intervalo máximo de 8 semanas.
O DNA foi extraído de amostras de tecido e o ctDNA foi isolado a partir do plasma. Usámos
(MPS) para mutações. Extraímos DNA germinal (gDNA) de leucócitos e analisámos mutações em genes algo com MPS.
Resultados: Foram incluídos 2 doentes que tinham sido submetidos a linhas terapêuticas prévias com progressão. Enquanto o doente 001 tinha neoplasia da mama metastática (biópsia de metástase pulmonar), o doente 002 tinha doença localmente avançada, irressecável (biópsia da mama). O DNA foi isolado das amostras de plasma e quantificado; estava presente DNA em ambas as amostras plasmáticas. Foi extraído DNA de amostras congeladas obtidas por biópsia. Considerando a amplificação dos genes testados, detectámos amplificação no FGFR1 no doente 001, quer no tecido (aumento do número de cópias em 8.5 vezes), quer no plasma (aumento do número de cópias em 9.7 vezes).
No doente 002 foi detectada uma mutação no PIK3CA no exão 10 (exão codificante 9), que é a mutação mais frequente do PIK3CA encontrada no cancro da mama [c.1633G>A, p.(E545K)]. Esta mutação foi apenas detectada na amostra tecidular e não no ctDNA; esta mutação não estava presente no DNA germinal isolado a partir de leucócitos, pelo que se comprovou ser somática. Conclusões: Foi possível isolar DNA circulante do plasma de ambos os doentes – facto comprovado pela detecção de variantes somáticas. Foi possível detectar alterações passíveis de ser alvos terapêuticos em ambos os doentes: amplificação do FGFR1 (tecidular e plasmática) no doente 001 e mutação do PIK3CA no doente 002 – embora esta tenha sido apenas detectada em amostra tecidular.
Não observamos uma completa concordância das alterações genéticas detectadas no tecido tumoral e no plasma. Isto poderá dever-se a motivos técnicos ou biológicos.
Palavras-chave: Cancro da Mama Metastático, Medicina de Precisão, Biópsias Líquidas, Mutações e amplificações alvo
Abbreviations
AJCC American Joint Committee on Cancer AKT Alpha serine/threonine kinase AKT1 Alpha serine/threonine kinase 1 AKT2 Alpha serine/threonine kinase 2
BC Breast cancer
BIG Breast International Group
C Celsius
CNV Copy number variation
CHG Comparative genomic hybridization CTC Circulating tumor cells
ctDNA Circulating cell-free tumor DNA ctRNA Circulating tumor RNA
DDISH Dual-color dual-hapten brightfield in situ hybridization ddPCR Digital droplet PCR
ER Estrogen receptor
ErbB1 Avian erythroblastosis oncogene B1 ErbB2 Avian erythroblastosis oncogene B2 ErbB3 Avian erythroblastosis oncogene B3 ErbB4 Avian erythroblastosis oncogene B4 EGFR Epidermal growth factor receptor FGFR Fibroblast growth factor receptor FISH Fluorescence in situ hybridization GPCR G-protein coupled receptor HER1 Human epidermal receptor 1 HER2 Human epidermal receptor 2 HER3 Human epidermal receptor 3 HER4 Human epidermal receptor 4 IHC Immunohistochemistry
MA Microarray
MPS Massive parallel sequencing mAbs Monoclonal antibodies MDM2 Murine double minute 2
MET Methyl-N'-nitro-N-nitrosoguanidine (MNNG) HOS transforming gene mTOR Mammalian target of rapamycin
NST No special type
PBMC Peripheral blood mononuclear cells PDGFR Platelet derived growth factor receptor PS Performance status
PI3K Phosphoinositide 3-kinase
PIP2 Phosphatidylinositol 4,5-bipsphosphate PIP3 Phosphatidylinositol 4,5-bipsphosphate PFS Progression free survival
PKB Protein kinase -B PR Progesterone receptor
PTEN Phosphatase and tensin homolog RAS Rat Sarcoma virus
RNA Ribonucleic acid
RNAseq Ribonucleic acid sequencing SNV Single nucleotide variation TD-M1 Trastuzumab emtansine TKI Tyrosine kinase inhibitor TKR Tyrosine kinase receptor TNBC Triple negative breast cancer
Index
Abstract v
Resumo vii
Abbreviations ix
1. Introduction 1
1.1 Precision Medicine and oncology 1
1.2 Actionable mutations in breast cancer 3
1.2.1 PIK3CA 4
1.2.2 AKT1 7
1.2.3 AKT2 8
1.2.4 EGFR 8
1.2.5 FGFR1 10
1.3 The importance of tumor re-characterization in metastatic disease 10
1.4 Potential impact of liquid biopsy 12
1.4.1 Technologies to analyze ctDNA 15
2. Objectives 16
3. Methods 17
3.1 Study design and data source 17
3.2 Study population 17
3.3 Clinical data collection 17
3.4 Sample collection 18
3.5 Germline DNA extraction from PBMC 18
3.6 DNA extraction from tissue samples 19
3.7 Cell-free DNA extraction from plasma 19
3.8 ddPCR 19
3.9 Library preparation using HaloplexHS followed by MPS 20
3.10 Statistical analysis 21
3.11 Bioinformatic analysis 21
4. Results 22
4.1.1 Patient 001 22
4.1.2 Patient 002 23
4.2 DNA isolation from plasma samples of patients with metastatic BC 23
4.4 Determination of specific druggable mutations and amplifications in tissue samples and ctDNA
25
4.4.1 PIK3CA, AKT2, EGFR and FGFR1 amplification 25
4.4.2 AKT2 and PIK3CA mutations 27
4.5 Concordance of results between plasma and tumor biopsies 29 4.5.1 Association between amplifications detectable in plasma and tumor biopsies 29 4.5.2 Association between mutations detectable in plasma and tumor biopsies 29
5. Discussion 31
6. Conclusion and future perspectives 35
Index of figures
Figure 1 – Targetable genomic alterations in BC patients in SAFIR01/UNICANCER Figure 2 – PI3K family catalytic subunits, by class
Figure 3 – PIK3CA pathway
Figure 4 – Liquid biopsy advantages over tissue biopsy Figure 5 – Copy number variation determination formula
Figure 6 – Copy number variation normalized to reference sample in patient 001 Figure 7 – Copy number variation normalized to reference sample in patient 002 Figure 8 – FGFR1 in patient 001
Index of tables
Table 1 – Frequently found mutations in PIK3CA in patients with BC Table 2 – Drugs targeting EGFR and current approvals
Table 3 – Comparison between the applications of Exosomes, CTCs and ctDNA Table 4 – Patient characteristics at diagnosis and at rebiopsy
Table 5 – cfDNA concentrations obtained from plasma samples provided by patients with
metastatic BC
Table 6 – Quality control analysis
1. Introduction
Cancer is one of the main causes of death worldwide and its incidence is expected to increase along with an increase in the median life expectancy.1 Breast cancer (BC) is the most
common type of cancer among women in most regions of the world and its incidence has been increasing, now accounting for about 25% of all new cancer cases in women.1, 2
Regardless of the worldwide increase in BC incidence, its mortality rates in western countries have remained unchanged or even decreased, due to a combination of both early detection and improved treatment strategies. Nevertheless, BC is currently the leading cause of cancer death in developing countries, as well as the second leading cause of cancer death among women in developed countries. It accounted for an estimated 521 900 deaths worldwide in 2012.1
BC mortality derives from the inability to cure advanced disease. Nevertheless, much has been done in the past decades in which fundamental research has managed to identify several molecular mechanisms that are responsible for tumor origin and progression. In parallel, the pharmaceutical industry has been developing therapeutic strategies that can block the effect of these oncogenic alterations.3
1.1 Precision Medicine and oncology
The acquisition of characteristics that allow normal cells to progressively evolve into neoplastic cells (the hallmarks of cancer), is a multistep process which requires the acquisition of somatic abnormalities in the genome.4 Somatic mutations found in cancer cells are usually
classified according to the consequences they have on the cancer cell, into driver or passenger mutations.5 Some somatic mutations confer advantages to the cancer cells and are involved in
the development of malignant neoplasms. They are, therefore, called driver mutations. These types of mutations are implicated in oncogenesis and as they confer an advantage they are positively selected.5, 6 Other mutations, however, do not have functional consequences nor
confer an advantage to cancer cells and are therefore called passenger mutations, which were already present in the genome of a cell when driver mutations occurred and can be carried and be present in the final cancer, although frequently without functional consequences.5
Nevertheless, there are other subclasses of driver mutations, such as those that confer resistance to cancer treatment. These mutations might already be present in a limited
population of cancer cells, not conferring any particular advantage in the absence of a drug. In the presence of a specific therapeutic agent however, this resistant set of clones will have a selective characteristic and therefore will preferentially expand and be a driver of disease progression.5 There is increasing evidence that cancer is not only an heterogeneous but an ever
evolving entity, either by its intrinsic genomic instability or even by the selective pressure exerted by the treatment instituted.7
Knowledge of the cancer genome at different stages of the disease and how it influences cancer progression already has a big impact in cancer management and it is expected to have even a greater role in the future, as precision medicine evolves.
Precision medicine defines a concept in which prevention and treatment strategies take individual variability and the idea of clonal evolution into account.8 It is in fact a concept which
has been used for a long time in simple procedures (such as blood typing for blood transfusions), but with the technological advances we have witnessed we will be able to apply it in broader settings.8 Similarly, precision oncology is a science that aims at profiling tumors with the goal of
identifying alterations that can be targeted with therapeutic agents.9 These drugs would
therefore only be effective if the tumor shows a specific molecular signature. This is already a reality for hormonal receptor positive BC patients in whom hormonal therapy has been used for over 25 years.3 Another example of precision oncology in BC patients is the use of anti-Human
Epidermal Receptor 2 (HER2) agents for patients with HER2 amplification, which also lead to an improvement in survival.10 However it is widely known that BC harbors a range of genomic
alterations both in oncogenes or oncosuppressor genes and each could potentially be a target for cancer therapy.11 In fact, about 80-90% of advanced cancer patients who were tested seem
to have genetic alterations that could potentially be actionable, although only a minority of patients actually ends up receiving targeted therapy, which is generally given in a clinical trial.9 12, 13 In fact, BC patients, along with melanoma patients, are those who more frequently have an
approved targeted drug option for such an alteration, more frequently reported to be in mTOR and HER2.12 Nevertheless, in 2016, only nine genomic alterations were routinely assessed in
metastatic cancer patients of all types in order to make decisions regarding targeted therapy.14
The development of such drugs is of key importance as several studies suggest that patients treated with these targeted drugs might have better outcomes, such as an increase in progression free survival although there is some controversy.11, 14, 15
1.2 Actionable mutations in breast cancer
Solid cancers tend to have a higher median number of molecular alterations when compared to liquid tumors. Considering solid tumors, BC seems to be associated with a higher number of alterations.12 There is a strong correlation between the number of mutations found and factors
such as age at diagnosis of cancer, cancer histological grade16 and the presence of metastatic
disease at the time of biopsy.12
In 2010, Von Hoff et al. proved that it is possible to perform molecular profiling of tumors using immunohistochemistry (IHC), fluorescent in situ hybridization assays (FISH) and oligonucleotide microarray (MA).15 From all the patients included, 18 (27%) had a breast cancer
diagnosis. This study showed that 27% of patients who underwent treatment with targeted therapy had an improved progression free survival (PFS) when compared to the PFS for the most recent treatment regimen, greater or equal than 1.3.15 In the MOSCATO trial, the same outcome
was evaluated. In this trial 14% (n=135) had advanced BC and 19% of those (n=38) received matched treatment. 36% BC patients who received matched treatment for a detected molecular alteration also had a greater than 1.3 increase in PFS. The increase in PFS when compared to the last regimen received occurred in 33% of patients (95% CI: 26%-39%, p<0.001), regardless of tumor type, drug family administered, level of evidence for the target gene molecular abnormality and other factors such as year of inclusion in the study or Royal Marsden Hospital (RMH) score (prognostic score to evaluate patient’s life expectancy).14
Many efforts have been done with order to study the molecular profile of solid cancers. Most of the studies however include more than one tumor type. In these studies, several potentially targetable alterations are commonly described as frequently present. PIK3CA mutations and amplifications,11, 14, 17 ERBB2 mutations and amplifications,14, 17 PTEN mutations
and deletions,14, 17 FGFR1 mutations and amplifications,11, 14 EGFR mutations and
amplifications11, 14 and NOTCH1/2/3/4 mutations, amplifications or translocations.14
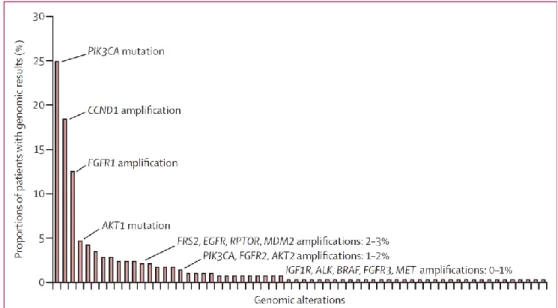
SAFIR01/UNICANCER is one of such initiatives, which included metastatic BC patients with at least a metastasis in a site accessible for a biopsy. Tissue was tested using Comparative Genomic Hybridization (CGH) array and Sanger sequencing for both PIK3CA (exons 10 and 21) and AKT1 (exon 4). The most frequent targetable genomic alterations identified occurred in
PIK3CA (25%), CCND1 (19%) and FGFR1 (13%). There were, nevertheless, several other genomic
alterations which occurred in less than 5% of patients, namely, AKT1 mutations, EGFR, MDM2,
Figure 1. Distribution of targetable genomic alterations in BC screened patients in the
SAFIR01/UNICANCER initiative. Adapted from: André, F. et al, Lancet Oncol 2014; 15: 267–74
Several other molecular profiling initiatives are taking place, including the AURORA initiative, by the Breast International Group (BIG) which is recruiting 1300 women with newly diagnosed or metastatic breast cancer. The initiative is assessing 411 genes included in a commercially available panel by next-generation sequencing (NGS) and RNA sequencing (RNAseq).7 Preliminary results are currently available. In an analysis of 41 enrolled patients, 73%
had at least one clinically actionable mutation and 88% had either an actionable mutation or a copy number alteration.18 Patients with actionable mutations can be treated in the context of
downstream clinical trials.
The plasmaMATCH trial is including patients with advanced breast cancer in order to assess the safety and activity of targeted therapies in patients with targetable mutations.19 Of the first
92 patients enrolled, 40 (43.5%) had at least one actionable mutation: 15 had entered a trial and 16 were being screened for trial entry. No results are yet available regarding outcomes for these patients.20
1.2.1 PIK3CA
The PI3K (phoshatidulinositol-4,5-biphosphate 3-kinase) family includes eight different catalytic subunits, divided into three classes according to both structure and substrate specificity (Figure 2).21
Figure 2 – PI3K family catalytic subunits, by class (adapted from Lai K, et al. J Clin Pathol
2015;0:1–5)
PIK3CA encodes the p110α subunit of the class IA of the PI3K family. It is a lipid kinase that
normally exists as a heterodimer (along with a p85 regulatory subunit). It is generally activated by recruitment to the cell membrane which can be triggered by receptor tyrosine kinases (RTK) including the Epidermal Growth Factor Receptor (EGFR), insulin receptor and G-protein coupled receptor (GPCR) or RAS.21, 22
Figure 3 – PIK3CA pathway (adapted from Knowles M, et al. Nature Reviews Cancer 2014;
15:25-41) PI3K Class I Class IA PIK3CA p110α PIK3CB p110β PIK3CD p110δ Class IB PIK3CG p110γ Class II PIK3C2α PIK3C2β PIK3C2γ Class III Vps34
Deregulation of the PI3K/AKT pathway occurs in several different cancer types and results mainly in disruption of the cell cycle.23 In fact, the PI3K/AKT is the pathway most frequently
altered in BC, although its impact appears to be different depending on the specific cancer subtype.22, 24 This can occur by various different mechanisms such as the inactivation of PTEN
with consequently persistent high levels of PIP3 and constitutive activation of the PI3K pathway.21, 22 Other alterations, however, have been reported, such as the amplification or
mutations in PIK3CA which result in PI3K loss of dependency from growth factors.21 In fact, this
seems to be the most frequent alteration in the PI3K pathway and, after TP53, PIK3CA is the most frequently mutated gene in BC, occurring in up to 40% of all BC patients.24, 25
PIK3CA shows frequent gain-of-function mutations in exons 9 and 20, the helical and kinase
domains of PIK3CA, respectively (Table 1).24–26 These mutations might have impact in prognosis
and seem to correlate with significant relapse free survival in BC patients, especially in the progesterone-receptor (PR) positive subgroup.24 More importantly, PIK3CA mutation or
amplification might impact treatment choice. In fact, when treated with targeted agents (AKT or mTOR inhibitors), 25% (4 out of 12) previously treated patients with PIK3CA mutation responded.11 Taking this into account, there are currently ongoing clinical trials with mTOR
inhibitors together with hormone therapy in PIK3CA mutant metastatic breast cancer patients (such as the SANDPIPER trial with taselisib, which already showed preliminary results and SOLAR-1 which showed benefit of combining alpelisib with hormone therapy in metastatic HR+, HER2 negative BC patients with PIK3CA mutations regarding progression free survival).27, 28
Table 1 – Frequently found mutations in PIK3CA in patients with BC
Exon Location AA position AA change Nucleotide Change Mutation frequency 9 Helical Domain E542 p.(E542K) c.1624G>A 11%
E545 p.(E545K) c.1633G>A 20% p.(E545Q) c.1633G>C <1% p.(E545G) c.1633A>G <1% p.(E545V) c.1633A>T <1%
1.2.2 AKT1
AKT is a family of serine/threonine kinases, which includes AKT1, AKT2 and AKT3 (also known as PKBα, PKBβ and PKBγ, respectively).
AKT1 is part of the PI3K/AKT pathway. As a downstream mediator of PI3K and as previously described, AKT1 is involved in pathways that mediate cell proliferation and survival.29
AKT1 mutation frequently occurs in amino acid 17 with a substitution of a Lysine by a
Glutamic acid in the lipid-binding pocket. This E17K mutation causes constitutive activity of AKT1, with subsequent downstream activation of mediators of proliferation.30
Taking this into account, AKT1 inhibitors have been tested both in vitro (in which the growth of breast cancer explant models with AKT1E17K mutation was inhibited) and in vivo. In fact, in a phase I trial a specific AKT1 inhibitor induced partial responses not only in BC patients, but also in ovarian cancer patients with AKT1E17K mutation.30 Other studies have used AKT1 as a potential
target for breast cancer patients. In the SAFIR/UNICANCER study AKT1 mutations occurred in 4% of all patients assessed (n=12 patients). Of these only half were treated with AKT1 and/or mTOR inhibitors and in 3 out of 6 patients, antitumor activity was seen.11
Q546 p.(Q546K) c.1636C>A <1% p.(Q546E) c.1636C>G <1% p.(Q546P) c.1636A>C <1% p.(Q546R) c.1636A>G <1% p.(Q546L) c.1636A>T <1% p.(D549N) c.1636G>A <1%
20 Kinase Domain H1047 p.(H1947R) c.3140A>G 55% p.(H1947L) c.3140A>T 5%
1.2.3 AKT2
AKT2 is one of three isoforms of AKT, as aforementioned. Its expression in tumors has been shown to promote cell motility, invasiveness and even metastasis.31 AKT2 is amplified in several
cancer types, including BC, in which amplification occurred in approximately 2-2.8% of all cases.11, 32 AKT2 activation has been found to interact with the estrogen receptor alpha (ERα) as
activated AKT2 (either constitutively or by EGRF of insulin-like growth factor-1) promotes transcriptional activity of ERα; this activity was not inhibited by tamoxifen and is therefore a potential mechanism of resistance to this drug.33 Overexpression of AKT2 was also found to
correlate with amplification of HER2 receptor.34
In the SAFIR01/UNICANCER trial patients with AKT2 amplification or AKT1 mutation were treated with AKT1 and/or mTOR inhibitors and antitumor activity was found in half of them (n=3).11
1.2.4 EGFR
Epidermal growth factor (EGFR) family is composed of four transmembrane receptor tyrosine kinases, including EGFR (also known as HER1 or ErbB1), HER2/ErbB2, HER3/ErbB3 and HER4/ErbB4, each of them associated with one or more ligands – although to this day there are no known ligands to HER2.35, 36 The four members of this family share a common structure which
includes an extracellular domain (ligand-binding), an hydrophobic transmembrane region and an intracellular tyrosine kinase domain.35 When ligands bind to one of these receptors homo or
heterodimers form, triggering autophosphorylation of tyrosine residues in the cytoplasm which activates the receptors, initiating downstream signaling cascades.35 EGFR family members are
expressed in various tissues and play important roles in both development, proliferation and differentiation.36 Amplification or mutations in EGFR might result in a deregulation of this system
and are linked with aberrant growth loops and have been implicated in the development of several human cancers.36
There are currently two available classes of drugs targeting EGFR: monoclonal antibodies (mAbs) such as cetuximab and panitumumab and tyrosine kinase inhibitors (TKI) such as erlotinib, gefitinib, afatinib and osimertinib (Table 2). While mAbs primary action is through competitive antagonism which inhibits downstream signaling, TKIs bind to ATP-binding intracellular domain of protein kinases, inhibiting subsequent signaling pathways.37
In fact, EGFR inhibitors are standard treatments for selected patients with non-small cell lung cancer (with EGFR mutations) and colorectal cancer (RAS wildtype).37
In BC, suppression of EGFR appears to be effective in controlling progression by interfering in three distinct mechanisms:37
1) EGFR suppression was proven to suppress stem cell population in preclinical studies 2) EGFR pathway suppression enhances apoptosis by stimulating the PI3K/AKT and
PLC/PKC pathways
3) EGFR pathway might have an important role in regulating the epithelial-mesenchymal transition (EMT) in BC cells as suppression of EGFR reduces the expression of EMT markers
Table 2 – Drugs targeting EGFR and current approvals
EGFR amplification occurs in about 6-26% of BC patients, with different reports showing
different prevalence. It seems, nevertheless, higher in triple negative breast cancer (TNBC) patients, where EGFR amplification can occur in about 60% of the cases.37–40 There is also a
potential association between EGFR positivity in IHC and worse prognosis, especially in TNBC patients.39, 41
EGFR inhibitors might therefore be relevant targeted therapies for BC patients, especially in TNBC.37, 40 In the SAFIR01/UNICANCER study, two patients with EGFR amplification were treated
with EGFR inhibitors and half of them showed response.11 In fact several anti-EGFR agents have
been tested in BC, including cetuximab,42 panitumumab,43 gefitinib and neratinib, with
conflicting results.37
Class Drug Approval
Monoclonal antibodies
Cetuximab Metastatic colorectal cancer (RAS wildtype); Head and neck cancer (localized and metastatic, regardless of RAS)
Panitumumab Metastatic colorectal cancer (RAS wildtype) Tyrosine
kinase inhibitors
Afatinib Metastatic non-small cell lung cancer (EGFR mutated) Erlotinib Metastatic non-small cell lung cancer (EGFR
mutated); metastatic pancreatic cancer (regardless of EGFR mutation)
Gefitinib Metastatic non-small cell lung cancer (EGFR mutated) Osimertinib Metastatic non-small cell lung cancer (EGFR mutated)
1.2.5 Fibroblast Growth Factor Receptor 1 (FGFR1)
The fibroblast growth factor receptor family is a family of four transmembrane receptor tyrosine kinases (FGFR1-4), which share a significant homology between themselves.44, 45 Their
structure includes an extracellular domain (ligand-binding), a transmembrane domain and an intracellular tyrosine kinase binding domain.44 FGFR5 is another related receptor, but given its
lack of tyrosine kinase domains it is generally considered to negatively control signaling by heterodimerizing with other FGFRs.45, 46 Fibroblast Growth Factors (FGFs) bind to FGFRs,
originating a complex of FGF, FGFR and heparin sulfate proteoglycans (HSPF).44 Downstream
signaling occurs as a result of the dimerization of this ternary complex.44
FGFs and FGFRs have a role in regulating cell proliferation, survival, migration and differentiation and through these mechanisms can contribute for cancer development.46, 47 In
fact, FGFR1 is reported to be amplified in several cancer types such as oral squamous carcinoma, ovarian cancer, bladder cancer, rhabdomyosarcoma and breast cancer. Nevertheless, the amplification usually has a low incidence.46 In BC, however, FGFR1 amplification occurs in about
10% of the patients and is one of the most frequently found focal amplifications in this disease, although it is predominantly found in ER positive cancers.48 FGFR is, therefore, an appealing
target for cancer therapy and much research has been done in order to develop drugs to accomplish FGFR inhibition.49 These drugs can either be selective FGFR TKI inhibitors or
non-selective FRFR TKI inhibitors.45 The latter inhibit not only FGFR but also several other tyrosine
kinase receptors (TKRs) such as vascular endothelial growth factor receptor (VEGFR) and the platelet derived growth factor receptor (PDGFR), among others.45 They can also be classified by
their mechanism of action, given that some molecules bind to the intracellular domain (small molecule inhibitors) and others bind to the extracellular domain, blocking FGFR dimerization (antibodies or peptide inhibitors).49 There are several FGFR inhibitors available nowadays such
as Regorafenib, Ponatinib, Dovitinib, Nintendanib, Pazopanib, Sunitinib and many others.45
In the SAFIR01/UNICANCER study, 9 patients with FGFR1 amplification were treated with FGFR inhibitors in phase 1 or 2 trials and of the 8 patients assessable for efficacy 25% (n=2) showed antitumor activity.11
1.3 The importance of molecular re-characterization of metastatic disease
Tumors are known to show phenotypic heterogeneity and cancer is a dynamic disease both spatially and temporally.50Malignant tumors are a result of the accumulation of several genetic alterations which ultimately lead to the activation of oncogenes and inactivation of oncosuppressors. Although the exact number of driver mutations required is not completely established and possibly varies depending on the disease, studies have suggested that common cancers such as BC require about 5 to 7 rate-limiting events.5 Nevertheless, in order to acquire driver mutations, tumor cells
also undergo genetic alterations which do not confer any form of selective advantage – passenger mutations.50 Tumor cell populations harbor an intratumoral heterogeneity which
results mostly from a combination of the intrinsic genomic instability – a hallmark of cancer – leading to an increased mutation rate with hyperproliferation.4, 50 In result of this heterogeneity
a tumor will naturally have distinct cell subpopulations characterized by different tumorigenicity, metastatic potential and sensitivity to therapy.51
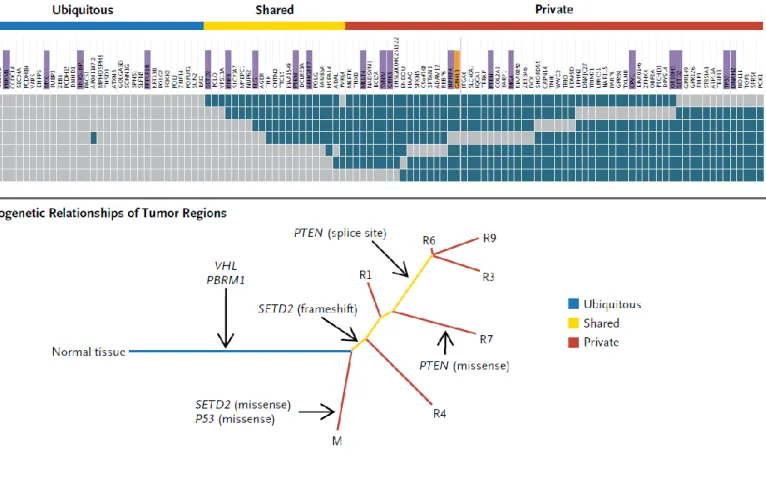
Figure 4 – Spatial heterogeneity in a patient with clear cell carcinoma of the kidney; (A) regional
distribution of somatic mutations (as detected by exome sequencing), grey meaning the presence of a mutation and blue the absence of a mutation (B) Phylogenetic relationships of tumor regions. (adapted from Gerlinger M, et al, NEJM 2012; 366:883-892)
This spatial heterogeneity poses as a problem for clinical diagnosis, since the number of samples obtained to pathologically characterize a tumor is limited and there is a possibility that the sample obtained is not representative of the tumor or misses a more advanced and aggressive region.50 Spatial and temporal heterogeneity also impact therapeutic response
(Figure 4). Heterogeneity dictates that not all cell populations will be equally sensitive to the same therapy. Moreover, differences in tumor vasculature or other microenvironmental changes will also contribute to different drug concentrations in specific tumor regions which might also contribute to the development of resistance.50 Also, when subjected to selective
pressure, such as a specific treatment, the expansion of resistant cell clones can occur. These cells might already have been present at the beginning of the treatment or might result from mutations occurring during therapy which conferred a selective advantage to the cells.50 In fact,
when we analyze biomarkers currently used to establish treatment of BC patients such as ER, PR or HER2, several studies show that there are significant rates of discordance between the primary tumor and metastatic disease which range from 3.4% to 60% for ER-negative to positive, 7.2% to 31% for ER-positive to ER-negative and 0.7% to 11% for HER2.7, 52–55 This discordance led
to change in management of BC of about 14% of patients in one study, considering the treatments available at the time. Nevertheless, the impact of tissue confirmations in OS or time to treatment failure (TTF) was not significant in this study.56 When considering, however, the
possibility of detecting other biomarkers which might lead to new therapies (such as in the MOSCATO trial), rebiopsy seems to have an impact at least in PFS.14 In fact a recent study (phase
II IMPACT trial) which evaluated the impact of pathway targeted agents in patients with refractory cancers referred to phase I trials, showed that 1307 of 3743 patients tested had one or more alterations and received therapy. The 3 year OS rate doubled in the group which received matched therapy when compared to 7% in the group which did not receive directed therapy.57
The recognition of this spatial and temporal heterogeneity lead to the recommendation that, at the time of first recurrence, metastatic disease should be biopsied as a way of insuring accurate tumor histology regarding biomarkers which will have a clear impact in cancer treatment.55
1.4 Potential impact of liquid biopsy
Liquid biopsy is a less invasive technique of determining biomarkers of early diagnosis or relapse, prognosis, monitoring of clinical progression and response to treatment in different
tumor types.58 This is generally done by isolating circulating cell-free tumor DNA (ctDNA) or
circulating tumor cells (CTCs) in serum or plasma samples, although the blood of a cancer patient also carries other tumor-derived materials such as exosomes and circulating tumor RNA (ctRNA).59 Nevertheless, several other body fluids might be used such as urine, saliva, pleural
effusion liquid, cerebrospinal fluid or even stool.59
Figure 4 – Liquid biopsy: advantages of this technique over tissue biopsies regarding tumor
heterogeneity (from Venesio, T. et al, Pathobiology 2017)
There are several advantages of liquid biopsies when compared to tissue biopsies. Tissue biopsies are more invasive techniques, carrying an inherent higher risk of morbidity as well as a greater technical complexity in acquiring samples. Lesions might not always be accessible, they might be in difficult anatomic locations or in regions were a biopsy could be unsafe such as around major vessels, in certain regions of the brain or in certain patients with relevant comorbidities.59 On the other hand given the heterogeneity of a tumor which is characterized
by a mixed population of clones, single site biopsies might not be representative of the overall predominant molecular profile or mechanism of resistance for a given patient. They might also provide scarce tumor tissue or tissue which is not suitable for the new sequencing techniques.58
Liquid biopsies allow the isolation of a range of tumor components, as aforementioned. The information provided by these different components is complementary.59 (Table 3)
Specifically, ctDNA is known to exist since the 1940s, when cell-free DNA was first detected in individuals with cancer.60 ctDNA is a small and variable fraction of total cell-free DNA which is
specifically derived from tumours.59 It is believed that ctDNA is released as a result of both
apoptosis and necrosis.58, 59
Given its minimally invasive nature and the ability to provide information about the tumor regardless of its heterogeneity, liquid biopsy has been considered a technique with several potential applications, from diagnostic purposes, to monitoring of response and resistance to therapies, and guidance of therapeutic decisions.61 Liquid biopsies can therefore provide a
minimally invasive mean to molecularly characterize tumors and, by detecting genetic alterations, they can shed light on the potentially targetable mutations and amplifications.62, 63
Table 3 – Comparison between the applications of Exosomes, CTCs and ctDNA (adapted from
(from Siravegna et al, Nature Reviews 2017)
“Yes” indicates that the approach is feasible, possible, and/or published studies are available; “No” indicates that the application is not feasible and/or no studies are available.
Despite all the potentialities of ctDNA as the ASCO 2018 guidelines state, it currently remains investigational in early-stage cancer and with little evidence of clinical validity/clinical utility in advanced disease apart from some particular situations, specifically selection of treatment in
EGRF mutant lung cancer for detection of the T790M variant.64 Even regarding the current most
frequent use of liquid biopsy, EGFR T790M detection, this test did not detect the mutation in 40% of patients with a T790M positive test result in tissue samples.65 Nevertheless many studies
are being conducted and a rapid evolution in this field is expected with many new indications.
ctDNA/RNA CTCs Exosomes Potential to fully recapitulate spatial and temporal tumor
heterogeneity
Yes No No
Assessment of pre/post-analytical variability Yes Yes Yes
Detection of somatic mutations, InDels, copy-number alterations and gene-fusions
Yes Yes Yes
Evaluation of methylation patterns Yes Yes Yes
Analysis of mRNA/miRNA/lncRNA/RNA splice variants Yes Yes Yes
Cell morphology and functional studies ex vivo No Yes No
Demonstration of signal colocalization No Yes No
1.4.1. Technologies to analyze ctDNA
Although there is a variation depending on tumor type, it is estimated that the number of CTCs in circulation is of about 1 cell per 1 x 10⁹ blood cells, in patients with metastatic cancer
and this fraction is expected to be even lower for patients with localized disease.66 Regarding
cell-free DNA it is also very rare in peripheral blood: most healthy individuals have less than 25ng per mL of blood, but in cancer patients the levels are generally a lot higher.66 Since ctDNA it is a
minor fraction of cell-free DNA (ranging from less than 0.1% to more than 10% of DNA molecules), traditional approaches are not suitable to study these molecules.66
Other technologies have been developed with this purpose, such as digital PCR (dPCR). These techniques have a very low limit of detection (it can be below 0.001%), which is mandatory for detection of rare alterations in ctDNA.59, 67 dPCR was first described in 1999, with
the purpose of detecting small populations of mutant cells – more specifically cells with mutant
RAS oncogene in the stool of patients with colorectal cancer.68 Nevertheless, dPCR can only be
used for genetic alterations already known. Massive Parallel Sequencing (MPS) (also known as NextGeneration Sequencing, NGS) however, allows the discovery of new genetic changes, not only at the time of diagnosis but also to potentially determine mutations which can result in resistance to therapy.59 These techniques can be used simultaneously, in a complementary
fashion, to provide a broader knowledge of the genetic alteration. Sensitivity of techniques for detection of ctDNA tends to be higher in metastatic patients, given their higher disease burden. Low allele frequency variants are variants present at a frequency below 3% and are therefore very difficult to detect by common techniques.69 Conventional MPS for instance has a
relatively high error rate of sequencers (1 wrong base call in 100-1000 sequenced bases). Barcode analysis (found in technology such as the HaloplexHS) allows the detection of low
frequency variants by aligning reads, grouping read pairs to designed probes based on read start-stop position. This allows that, for each probe, reads with identical molecular barcode sequence are grouped and PCR duplicates are removed, therefore reducing the error rate and allowing the identification of unique progenitor DNA fragments (de-duplication).69 With such techniques,
the accuracy of ctDNA analysis is improved and can eventually be performed even in patients with lower tumor burden.
In conclusion, liquid biopsies are a minimally invasive technique, which can be repeated throughout the course of disease without significant morbidity for patients. Liquid biopsies can potentially have an impact in therapeutic decisions, especially in advanced disease patients for whom therapeutic options are scarce.
2. Objectives
Regardless of the improvements in BC therapy in the last decades, with targeted therapy such as pertuzumab and trastuzumab70 and antibody-drug conjugates (T-DM1)71 and
improvement in hormone therapy efficacy with mTOR inhibitors72 and cyclin inhibitors, BC is still
one of the main causes of cancer death in the world. There is a need to further develop therapy with increasingly less toxic drugs. It is known that roughly one third of patients who undergo treatment with targeted therapy in advanced lines have an improved PFS when compared to the PFS for the most recent treatment regimen. Nevertheless, one of the main barriers of molecular profiling of cancer is the need to perform a biopsy of a metastatic site in order to obtain tumor tissue – since it might be difficult to access sites, with potential morbidity associated with the procedures. Because analysis of ctDNA by liquid biopsy has the potential to overcome these hurdles, our specific objectives were:
1. In the clinical setting:
a. To evaluate DNA isolation from plasma samples of patients with metastatic BC b. To evaluate methodologies to detect specific druggable mutations and
amplifications in ctDNA, namely: PIK3CA mutation and amplification, AKT1 mutation, AKT2 amplification, EGFR amplification, FGFR1 amplification
c. To determine if there is concordance between the mutations and amplifications detectable in plasma and tumor biopsies.
3. Methods
3.1
Study design and data source
This is a single-center prospective observational study with sample collection. Data concerning patients treated at Centro Hospitalar Lisboa Norte (CHLN) was retrieved. CHLN is the reference-center for treatment of a population of patients of the Lisbon metropolitan area, but also of patients from Portuguese-Speaking African Countries, who are medically referred for certain cancer treatments not available locally, such as radiotherapy. Our population therefore includes not only patients referred to us from primary care and the breast oncology multidisciplinary meeting (MDT), but we also medically referred patients from Portuguese-Speaking African Countries.
Data collected included: gender, diagnosis date, tumor histology, histological grade, ER and PR status, HER2 amplification status, metastatic disease profile.
3.2 Study population
We included patients with American Joint Committee on Cancer (AJCC) version 7.0 stage III unresectable or stage IV histologically or cytologically confirmed BC with 18 years or older. Both stage IV patients at diagnosis (de novo) or after progression or relapse could be included. We also included stage III BC patients with advanced unresectable disease.
Only patients with metastatic tissue which could be easily biopsied, with clinical indication for rebiopsy and who gave consent for biopsy and blood sample collection could be included.
For each patient analysis of the tumor and blood sample was performed with a maximum 8-week interval.
Exclusion criteria included having a second active malignancy.
3.3 Clinical data collection
Clinical data was collected at the time of the sample analysis, to ensure the longest follow-up time possible.
Data regarding patient characteristics (gender, race, date of birth) were collected. Regarding tumor characteristics at diagnosis, we collected date of diagnosis, stage at diagnosis (AJCC
version 7.0), histological type, grade, Ki67, hormone receptor status (RE, RP) and HER2 receptor status, as well as P53 status. We also collected data regarding initial treatment (intention: neoadjuvant, adjuvant, palliative; surgery; radiotherapy). At diagnosis of metastatic disease, we collected data regarding location of metastases and number of metastatic sites. Data regarding treatment of advanced disease was collected (lines of treatment).
Regarding rebiopsy we registered date of procedure, as well as tumor characteristics previously defined (histological type, grade, Ki67, hormone receptor status, HER2 receptor status, as well as P53 status).
Date of last-follow up or death was also collected.
3.4 Sample collection
Blood and biopsy samples were collected with an interval of 8 weeks maximum within each other, in the absence of specific cancer therapy in this period.
Biopsy samples were kept as fresh frozen tissue.
10-15mL of blood was collected in EDTA tubes. Blood samples were processed within 4 hours of collection. Blood was centrifuged at 1600 x g for 10 minutes at 4° C. Plasma was then transferred to a new centrifuge tube and centrifuged at 16000 x g for 10 minutes at 4° C. Cell-free supernatant was then stored at -80° C. The buffy-coat obtained with this process was collected and washed with PBS solution and the supernatant was removed. The dry pellet was stored at -80° C.
3.5 Germline DNA extraction from PBMC
The dry pellet was processed by diluting the cells in 200µL of PBS solution. 20µL of proteinase K was added and the mix was vortexed. Then 200µL of ATL buffer was added and the solution was pulse-vortexed for 15 seconds. The mixture was then incubated at 56ºC at 10-30 min. We used QIAmp® blood mini kit as described in de section 3.6 DNA extraction from tissue samples.
3.6 DNA extraction from tissue samples
DNA extraction from tissue samples was done using QIAmp® Blood mini kit. For this, tissue was fragmented and then an ATL buffer and proteinase K were added. Tissue was incubated overnight at 56°C. Then 40 µL of RNAse A was added to each tube. The tubes were than briefly vortexed and incubated at room temperature for 2 minutes. 200 µL of ATL buffer was then added to the mixture, which was then vortexed and incubated for 10 minutes at 70°C.
The mixture was then briefly centrifuged and 200µL of ethanol (96-100%) was added. Mixture was briefly pulse-vortexed and centrifuged. The content was then transferred to a QIAmp Mini spin column and centrifuged at 6000 x g. Solution was washed (buffer AW1 and buffer AW2) and then elution was performed according to manufacturer’s instructions. DNA was then quantified in Nanodrop, according to manufacturer’s instructions.
3.7 Cell-free DNA extraction from plasma
Isolation of cell-free DNA was done using MagMAX™ cell-free DNA isolation Kit according to manufacturer’s instructions. Total DNA quantification was performed using Invitrogen™ Qubit® dsDNA HS Assay Kit, according to manufacturer’s instructions.
3.8 ddPCR
Droplet digital polymerase chain reaction (ddPCR™) is a method that provides high-precision quantification of nucleic acid target sequences.
Probes were selected from Bio-Rad for copy number variation (CNV) analysis for AKT2, EGFR,
FGFR1 and PIK3CA. Probe assays consisted of unlabeled PCR primers and a dual labeled
fluorescent probe.
Droplets were generated using a probes and a ddPCR supermix, according to manufacturer’s instructions, and loaded to a DG8™ cartridge for a QX200 droplet generator. Then 70µL of droplet generation oil was transferred to the bottom wells of the same DG8™ cartridge. A gasket was attached across the top of the cartridge and it was placed in the droplet generator.
After generating the droplets in the cartridge, the droplets at the top wells were pipetted into a PCR plate which as then sealed with Bio-Rad PX1™ PCR plate sealer and pierceable foil heat sealer. The plate was then placed in a thermal cycler for PCR, for 40 cycles. After PCR the
plate was left overnight at 10°C in the thermal cycler. Droplets were then read by placing the PCR plate in a QX200 droplet reader and using by Quantasoft™ software. CNV was determined by calculating the ratio of the target molecule concentration to the reference molecule concentration, times the number of copies of the reference species in the genome (Figure 5). The error bars on a copy number estimate were the 95% confidence interval of this measurement.
Figure 5 – Copy number variation determination formula
CNV= 𝐴
𝐵× 𝑁𝑏
A= Concentration of target species; B= concentration of reference species; Nb= number of copies
of reference loci in the genome
CDH1 (PIK3CA and EGFR) and PTEN (AKT2 and FGFR1) genes were used as reference for
quantification. Target and reference assays were designed with different probe fluorophores. In this case AKT2, FGFR1 and CDH1 had FAM probes and PIK3CA, EGFR and PTEN had HEX probes.
3.9 Library preparation using Haloplex
HSfollowed by MPS
HaloplexHS is a high sensitivity amplicon based targeted deep sequencing method. It
promotes incorporation of molecular barcodes in the DNA library therefore allowing the identification of duplicate reads and improving base calling accuracy even at low allelic frequencies. It allows for the detection of mutations present at below 1% allele frequency in samples which are genetically heterogeneous. This kit was selected given that it was the only commercially available kit incorporating barcode technology at the time.
The fluorometry-based Qubit dsDNA HS assay kit was used to determine de precise DNA concentration for each sample. Genomic DNA was digested with restriction enzymes to create a library of gDNA restriction fragments, according to manufacturer’s instructions. Digested DNA was then hybridized to HaloplexHS probes using a custom panel. The hybridization buffer was
removed and circularized fragments were ligated. Target DNA was captured and PCR was performed to purify the amplified target library. We then validated enrichment and quantified enriched target DNA. All steps were performed according to manufacturer’s instructions.
MPS, also called next-generation sequencing or deep sequencing, is a form of DNA sequencing technology which performs sequencing of millions of small DNA fragments in parallel, providing high in depth accurate data, as every base in the genome is sequenced multiple times. Bioinformatics analysis maps the individual reads to the human reference genome and manages to piece together these fragments.
MPS was performed using MiSeq® system. Libraries were denatured and diluted. Afterwards the libraries were loaded onto the reagent cartridge and the sequencing run was set up.
3.10
Statistical Analysis
Statistical analysis was performed to detect the rough concordance rate between plasma and tissue detection of amplifications and mutations. This was done by using Microsoft Excel from Microsoft Office Professional Plus 2016.
We also determined Cohen’s Kappa to determine interrater agreement, using STATA 14.2 software (StataCorp LP, TX). Cohen’s Kappa is a statistical test which aims to define interrater agreement as the propensity of two or more raters (or, in this case, techniques) to, independently from each other, classify a given subject (in this case a gene) into the same predefined category.
3.11 Bioinformatic analysis
Bioinformatic analysis was performed using Trim galore, a wrapper tool which trims adapter sequences and low quality bases/reads, allowing an efficient quality control check of high throughput sequencing data.73 Agilent Genomics NextGen Toolkit (AGeNT) software
module was used to process the molecular barcode information obtained from HaloplexHS to
flag and remove molecular barcode duplicates.74 We also used FastQC software since this is a
quality control tool for high throughput sequence data which summarizes read quality by position and gives information about adapter content in sequences along with other aspects.75
4. Results
4.1 Patient characteristics
We enrolled two patients with BC who had undergone previous lines of treatment and progressed. Patients’ characteristics are listed in table 4.
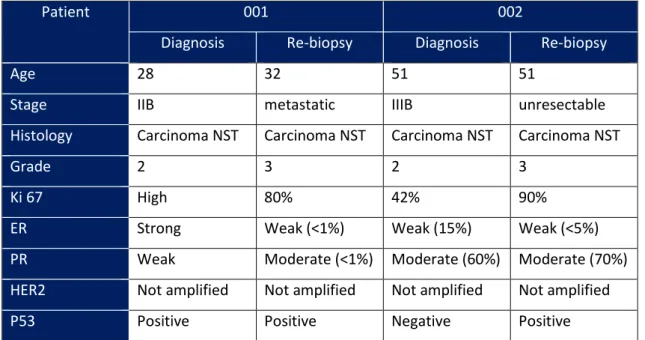
Table 4 – Patients’ characteristics at diagnosis and at re-biopsy
Patient 001 002
Diagnosis Re-biopsy Diagnosis Re-biopsy
Age 28 32 51 51
Stage IIB metastatic IIIB unresectable
Histology Carcinoma NST Carcinoma NST Carcinoma NST Carcinoma NST
Grade 2 3 2 3
Ki 67 High 80% 42% 90%
ER Strong Weak (<1%) Weak (15%) Weak (<5%)
PR Weak Moderate (<1%) Moderate (60%) Moderate (70%)
HER2 Not amplified Not amplified Not amplified Not amplified
P53 Positive Positive Negative Positive
ER – Estrogen Receptor; PR – Progesterone Receptor; HER2 – Human epidermal receptor 2; NST – No special type
4.1.1 Patient 001
Patient number 001 was a 28-year old caucasian woman at diagnosis, who initially presented with stage IIB BC in 2011. Histology revealed a carcinoma NST, grade 2, luminal B-like tumor. Patient underwent neo-adjuvant chemotherapy and surgery (mastectomy with axillary lymph node dissection) with partial response (ypT1ypN0). Adjuvant hormone therapy with tamoxifen was initiated.
Patient relapsed in June 2013, with bone metastases and started another hormone therapy line (goserelin with letrozole) together with a bone modifying agent (zoledronic acid). Due to disease progression in February 2014 she started chemotherapy with capecitabine. In January 2015, due to bone, lymph node and lung progression chemotherapy was changed to paclitaxel which she received until April 2015, when disease progressed. At this point patient underwent re-biopsy (table 3), in a lung metastases. Chemotherapy was again changed to gemcitabine with
cisplatin, but patient progressed with de novo hepatic metastases and increase in number and size of lymph node, lung and bone metastases in October 2015 and started vinorelbine. She underwent two further lines of chemotherapy. Patient was deceased in December 2015.
4.1.2 Patient 002
Regarding patient 002, she was a 51-year old black woman from Guinea Bissau, medically evacuated to Portugal in order to receive treatment for a locally advanced tumor of the right breast. She presented initially with stage III inoperable BC. Histology revealed a carcinoma of no special type (NST), luminal B-like (ER and PR positive, HER2 FISH 2+, not amplified by dual-color dual-hapten brightfield in situ hybridization [DDISH]). She underwent neoadjuvant chemotherapy with doxorubicin and cyclophosphamide for four cycles with response but progressed on neo-adjuvant paclitaxel, with extension to the chest wall, edema of the skin, homolateral axillary progression with marked lymphedema. At this point the patient remained with stage III inoperable disease. Breast lesion was re-biopsied (table 3) and the patient started chemotherapy with vinorelbine and capecitabine with local symptomatic progression both in breast and lymph nodes. Chemotherapy was changed to carboplatin and gemcitabine but patient was lost to follow-up, since she decided to return to her home country.
4.2 DNA isolation from plasma samples of patients with metastatic BC
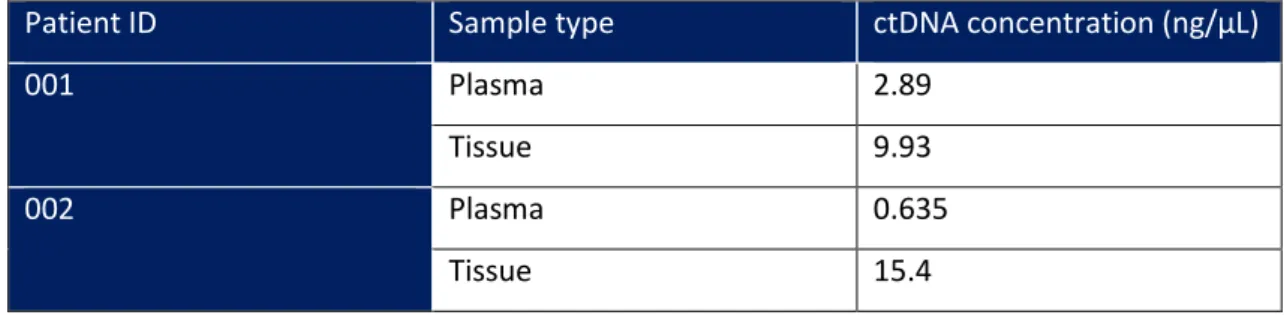
Blood samples of the patients were collected within an 8 week-interval regarding the collection of tissue samples. Samples were processed and stored and DNA from tissue samples and DNA were isolated as previously described. After isolation, total DNA quantification was performed using Invitrogen Qubit dsDNA HS Assay Kit and results are shown in table 5.Table 5 – DNA concentrations obtained from plasma samples provided by patients with
metastatic BC
Patient ID Sample type ctDNA concentration (ng/µL)
001 Plasma 2.89
Tissue 9.93
002 Plasma 0.635
The DNA concentration obtained was higher in samples obtained from tissue than plasma samples, as expected, although the difference was not statistical significant (p=0.121). Nevertheless, it was possible to isolate DNA from both sets of samples, for both patients. The DNA concentration in the plasma was higher for patient 001 when compared with patient 002. On the other hand, DNA concentration extracted from tissue-samples was higher for patient 002.
4.3 Quality Control analysis
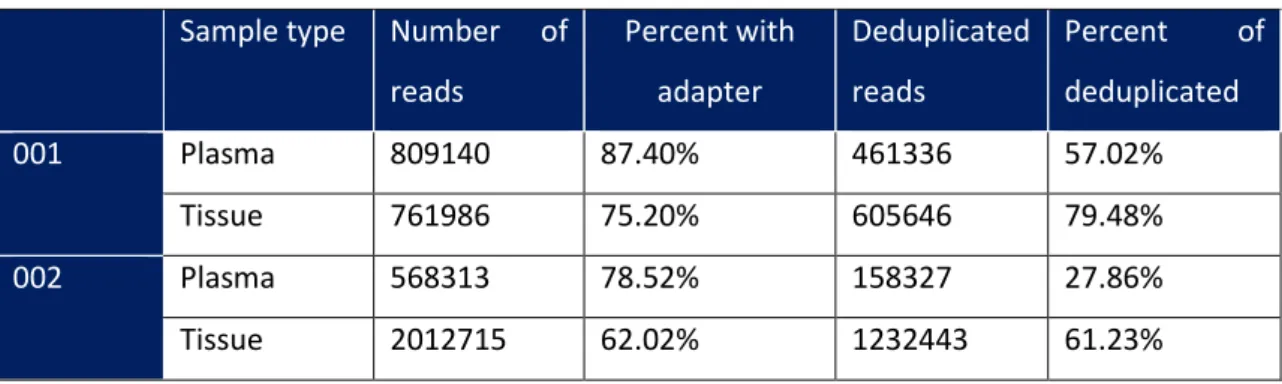
The number of reads obtained from the tissue sample was significantly higher for tissue sample (when compared to the plasma sample) in patient 002 but not for patient 001. When considering the percent of reads with adapter, it inversely correlates with the overall fragment distribution of the library; a higher percent with adapters was detected in the plasma sample from patient 002 indicating a small fragment distribution (Table 6). Regarding patient 001, both plasma and tissue had a high percent of reads with adapter, although this was higher for the plasma sample.
Read counting might be complicated by amplification bias (which results from the preference of the PCR in reproducing reads of different lengths and compositions), although there are other sources of read duplication such as sample coincidence which are more likely to be present when the depth of sequencing is high such as in our sample.76 The percent of
deduplicated reads relates with the coverage of the target sequence, with a low level of duplication indicating a very high level of coverage of the target sequence. In this case, the percent of deduplicated reads was higher for tissue samples in both patients, when compared to plasma samples, meaning tissue samples had a lower duplicate rate and therefore, probably a higher coverage.
Table 6 – Quality control analysis
Sample type Number of reads Percent with adapter Deduplicated reads Percent of deduplicated 001 Plasma 809140 87.40% 461336 57.02% Tissue 761986 75.20% 605646 79.48% 002 Plasma 568313 78.52% 158327 27.86% Tissue 2012715 62.02% 1232443 61.23%
4.4 Determination of specific druggable mutations and amplifications in
tissue samples and ctDNA
4.4.1 PIK3CA, AKT2, EGFR and FGFR1 amplification
After the quantification of DNA, we determined CNV by ddPCR. The ddPCR results are expressed as the ratio between the number of copies of a given gene and the number of copies of the reference gene, as previously described (Figure 5).
Patient 001 (Figure 6) did not show amplification of PIK3CA both in tissue sample (ratio of 2.6) and plasma (ratio of 2.3). Regarding patient 002 (Figure 7), there was also no amplification either in tissue sample (ratio of 3.0) or in plasma (ratio of 2.6).
Figure 6 – Copy number variation normalized to reference sample in patient 001 in plasma and
tissue DNA. 9.7 3.1 3.8 2.3 8.5 2.2 2.8 2.6 0 2 4 6 8 10 12 FGFR1 AKT2 EGFR PIK3CA Tissue Blood
Figure 7 – Copy number variation normalized to reference sample in patient 002 in plasma and
tissue DNA.
There were no differences in CNV when comparing AKT2 with reference samples, both in plasma and in tissue, for both patients. Patient 001 had a CNV ratio of 2.2 in tissue and 3.1 in blood. Regarding patient 002 the CNV ratio was 2.4 in tissue-sample and 2.5 in plasma.
Regarding EGFR, there was also no evidence of amplification of this gene both in patient 001 (ratio of 2.8 in tissue and 3.8 in the plasma) and in patient 002 (ratio of 2.9 in tissue and 2.8 in the plasma sample).
An FGFR1 amplification was detected in patient 001, both in tissue and plasma samples, with a 9.7-fold increase in copy number when compared to the reference sample in the plasma and an 8.5-fold increase in copy number in tissue-sample (Figure 8). Regarding patient 002
FGFR1 was not significantly increased when compared to the reference sample, both in plasma
(ratio of 2.2) and in tissue (ratio of 2.4).
2.2 2.5 2.8 2.6 2.4 2.4 2.9 3 0 0.5 1 1.5 2 2.5 3 3.5 FGFR1 AKT2 EGFR PIK3CA Tissue Blood