Methods for the Assessment of the Red Blood
Cells Deformability in a Micro
fl
uidic Device
Vera Faustino1,2,3, Susana O. Catarino1, Diana Pinho2,4, Graça Minas1, and Rui Lima2,3,4(&)
1
Microelectromechanical Systems Research Unit (CMEMS-UMinho), University of Minho, Campus de Azurém, 4800-058 Guimarães, Portugal
2
Department of Chemical Engineering, Engineering Faculty, University of Porto, Transport Phenomena Research Center,
R. Dr. Roberto Frias, 4200-465 Porto, Portugal
rl@dem.uminho.pt 3
MEtRiCS, Department of Mechanical Engineering, Minho University, Campus de Azurém, 4800-058 Guimarães, Portugal
4
Polytechnic Institute of Bragança, ESTiG/IPB, C. Sta. Apolonia, 5301-857 Bragança, Portugal
Abstract. Red blood cells (RBCs) deformability is a high relevant mechanical property, whose variations are associated with some diseases, such as diabetes and malaria. Therefore, the present study aims to compare different image processing methods for assessing the RBCs deformability in a continuousflow, measured in a polydimethylsiloxane (PDMS) microchannel composed by 15lm
spacing inner pillars. The images were acquired with a high speed camera and analyzed with ImageJ software for tracking and measuring the RBCs defor-mation index (DI). Additionally, to understand the performance of the software, it was performed a comparison between different image processing tools pro-vided by ImageJ and the best methods for the deformation measurements were selected, considering the measured RBCs number and their DIs. The results show that those image methods significantly affect the number of measured RBCs and their DIs and, therefore, the studies focused on the deformability measurements need to take into account the effect of the image processing methods for avoiding loss of relevant information in the images.
Keywords: Deformation index
Red blood cells
Deformability
Microfluidics
Image processing
1 Introduction
Blood is a complex fluid full of valuable information. Due to its complexity, many analytical techniques require the previous separation and sorting of blood cells, which consumes time and resources [1, 2]. Microfluidic devices have arisen to overcome some limitations of the existing techniques and make it possible the use of small samples and less biochemical labels that may change cells properties [3].
©Springer International Publishing AG 2018
J.M.R.S. Tavares and R.M. Natal Jorge (eds.),VipIMAGE 2017,
The use of specific geometries, such as micropillars arrays, micro-weirs or mem-branes with holes, inside the microfluidic devices, could be helpful for cell separation. In these geometries, the size of the geometries determines the cells deformation [4]. Many literature studies use these structures (micropillars arrays and micro-weirfilters), which create a cross-flowfiltration to overcome some issues related with clogging and jamming [5, 6]. However, for the best of the authors knowledge, the use of such structures was never used for separation and, at the same time, for measuring the deformation index of RBCs. So, in this study, it is proposed a PDMS microfluidic device with 19µm height, and with a sequence of 15µm separation pillars with 4550µm, where was measured the DI of RBCs. To choose the best method that can
improves the images quality and measuring the RBCs deformation index through the pillars, different image processing methods were compared using the ImageJ software.
2 Materials and Methods
This section presents the geometry, experimental setup and materials used in the experimental procedures for measuring the RBCs deformability.
2.1 Microchannel Fabrication and Geometry
The PDMS microfluidic device used in this work was fabricated by using a soft lithography technique. More detail about the fabrication technique can be found elsewhere [7,8]. Figure1shows the main dimensions of the microfluidic device used in this study.
2.2 Working Fluid and Experimental Set-up
Human blood of a healthy donor was collected into 2.7 mL tubes (S-Monovette®, Sarstedt) containing ethylenediaminetetraacetic acid (EDTA). The whole blood was centrifuge at 2500 rpm for 10 min at 20 °C. Plasma and the buffy coat were removed and the RBCs were re-suspended and washed once in physiological salt solution (PSS) with 0.9% NaCL (B. Braun Medical, Germany). The workingfluid used was Dextran 40 (Sigma-Aldrich, USA) solution containing 5% of haematocrit (Hct).
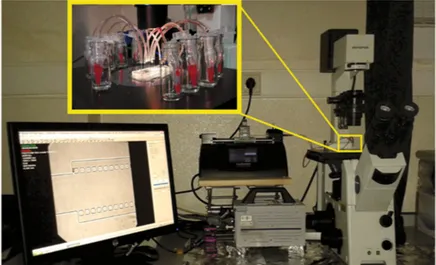
The high-speed video microscopy system used in the present study consisted of an inverted microscope (IX71, Olympus) combined with a high-speed camera (Fastcam SA3, Photron, USA), as shown in Fig.2. The PDMS microchannel was placed and
fixed in the microscope and the flow rate of the working fluid was kept constant at 50µL/min using a syringe pump (PHD Ultra, Harvard Apparatus, USA) with a 5 mL syringe (Terumo, Japan). At the same time, the images of the flowing cells at the establishedflow rate were captured by the high speed camera at a frame rate of 2000 frames/s and a shutter speed ratio of 1/75000, which minimized the dragging of the cells normally seen at the high flow rates in study. All the experimental assays were performed at room temperature (T = 22±1 °C).
2.3 Image Analysis
The experimental images recorded in each test were transferred to a computer, pro-cessed and analyzed by an image handling software, ImageJ (1.46r, NIH, USA) [9]. Then, it was used three different methods for comparing the different methods provided by the ImageJ, in the RBCs measuring and in the assessment of their deformability aiming the improvement of the individual RBCs imaging. The differences between these methods are presented in Table1. All the performed analysis was carried out with the same segment of the captured video, containing 102 frames. The first step of the pre-processing image was equally applied to the three methods. In this step, it was
created an averaged image (background) from the original stack of images, by aver-aging each pixel over the sequence of static images and then subtracted the background from the images stack. With this step, all the static objects, dusts and the microchannel walls are eliminated and only the RBCs, which move through the microchannel, remain visible. The following steps consisted in subtracting the median of the images stack from the original stack images. Then, a threshold was applied using theotsualgorithm and,finally, the RBCs were manually measured. The differences between the methods are focused in the subtraction options, the threshold values and the contrast options of each method (see Table1).
Figure3 presents examples of RBCs that were obtained after all the processing steps.
Table 1. Differences between the three used methods, in ImageJ software, focused on subtraction, threshold values and contrast options of each method.
Method Subtraction Threshold Contrast options
1 Subtract median Stacks from images stacks, with 8bit Min: 14 Max: 255
Not used
2 Subtract median Stacks from images stacks, with 32bitfloat result
Min:−41
Max:−7
Not used
3 Subtract median Stacks from images stacks, with 32bitfloat result
Min: 1.71 Max: 134
Min:−37.27
Max: 103.23
For each cell, the DI was calculated using the equation DI = (X− Y)/(X + Y),
where X and Y are the major and the minor axis length of each RBC, respectively (Fig.2).
3 Results and Discussion
After applying the referred methods, the RBCs were manually measured and their DI was calculated.
Figure4 presents the comparison of the three applied methods. Methods 1 and 3 were the ones that allowed the measurement of more RBCs (21 and 25, respectively), and had higher DI values. However, taking into account the theoretically previewed values, the method 2 corresponds to a best representation of a real RBC [10,11], also seen by Fig.3(b).
Therefore, considering both the shape of the cells (Fig.3) and the measured DIs (Fig.4), it can be concluded that, even with a minor measured RBCs number, the method 2 is a more reliable representation of the RBCs deformation behavior through micropillars, and consequently, it is the most suitable for processing the images and for improving their quality.
The used threshold in methods 1 and 3 had influence the RBCs choice, i.e., this threshold implied the selection of the interior region of the RBCs instead of the exterior membrane (as occurred in method 2). This reason explains the higher DI and the larger obtained number of RBCs.
The method 2 resulted in a minor RBCs number and DI value. However, it is more precise, since it selects the exterior membrane, providing a more reliable DI (±0.4). The contrast option did not have a considerable influence on the results, but improved the image quality.
4 Conclusion
The presented results show that the chosen image processing methods significantly affect the number of measured RBCs and their DIs and, therefore, the studies focused on the deformability measurements need to take into account the effect of those methods for avoiding loss of relevant information in the images. Considering that, the method 2 was superior, once the outputted results besides being in conformity with other studies, in which the DI value was measured, are a better representation of the RBCs structure.
The pre-processing of microscale images for further extraction of information is a great challenge, even when good quality videos are acquired. It is essential to ensure that the data presented in the frames remain almost intact. Therefore, further studies on the comparison between image processing methods for microfluidics could be a key factor for improving the results, increasing their reliability.
Acknowledgments. This work was supported by FCT with the reference project UID/EEA/ 04436/2013, by FEDER funds through the COMPETE 2020–Programa Operacional
Competi-tividade e Internacionalização (POCI) with the reference project POCI-01- 0145-FEDER- 006941. V. Faustino, S.O. Catarino and D. Pinho thank, respectively, the FCT for the grants SFRH/BD/ 99696/2014, SFRH/BPD/108889/2015 and SFRH/BD/89077/2012, supported by national funds from Ministérios da Ciência, Tecnologia e Ensino Superior and by FSE through the POCH -Programa Operacional Capital Humano. The authors also acknowledge thefinancial support provided by the project Nos. UID/EMS/00532/2013 and UID/EMS/04077/2013.
References
1. Zhang, J., Guo, Q., Liu, M., Yang, J.: A lab-on-CD prototype for high-speed blood separation. J. Micromech. Microeng.18, 125025 (2008)
2. Pinho, D., Yaginuma, T., Lima, R.: A microfluidic device for partial cell separation and deformability assessment. BioChip J.7, 367–374 (2013)
3. Gossett, D.R., Weaver, W.M., Mach, A.J., Hur, S.C., Tse, H.T.K., Lee, W., Amini, H., Di Carlo, D.: Label-free cell separation and sorting in microfluidic systems. Anal. Bioanal. Chem.397, 3249–3267 (2010)
4. Chen, X., Cui, D., Liu, C., Li, H.: Microfluidic chip for blood cell separation and collection based on crossflowfiltration. Sens. Actuators B Chem.130, 216–221 (2008)
5. Kang, T.G., Yoon, Y.-J., Ji, H., Lim, P.Y., Chen, Y.: A continuousflow microfiltration device for plasma/blood separation using submicron vertical pillar gap structures. J. Micromech. Microeng.24, 87001 (2014)
7. Faustino, V., Catarino, S.O.S.O., Lima, R., Minas, G.: Biomedical microfluidic devices by using low-cost fabrication techniques: a review. J. Biomech.49, 2280–2292 (2016)
8. Pinto, V.C., Sousa, P.J., Cardoso, V.F., Minas, G.: Optimized SU-8 processing for low-cost microstructures fabrication without cleanroom facilities. Micromachines5, 738–755 (2014)
9. Rasband, W.: ImageJ - Image processing and analysis in java (1997).https://imagej.nih.gov/ij/ 10. Rodrigues, R.O.R.O., Pinho, D., Faustino, V., Lima, R.: A simple microfluidic device for the deformability assessment of blood cells in a continuousflow. Biomed. Microdevices17, 108 (2015)