Graphene oxide-reinforced aluminium-matrix nanostructured composites fabricated by accumulative roll bonding
F. Ferreira, I. Ferreira, E. Camacho, F. Lopes, A.C. Marques, A. Velhinho PII: S1359-8368(18)30894-1
DOI: https://doi.org/10.1016/j.compositesb.2018.11.075 Reference: JCOMB 6260
To appear in: Composites Part B
Received Date: 21 March 2018 Revised Date: 19 October 2018 Accepted Date: 15 November 2018
Please cite this article as: Ferreira F, Ferreira I, Camacho E, Lopes F, Marques AC, Velhinho A,
Graphene oxide-reinforced aluminium-matrix nanostructured composites fabricated by accumulative roll bonding, Composites Part B (2018), doi: https://doi.org/10.1016/j.compositesb.2018.11.075.
This is a PDF file of an unedited manuscript that has been accepted for publication. As a service to our customers we are providing this early version of the manuscript. The manuscript will undergo copyediting, typesetting, and review of the resulting proof before it is published in its final form. Please note that during the production process errors may be discovered which could affect the content, and all legal disclaimers that apply to the journal pertain.
M
AN
US
CR
IP
T
AC
CE
PT
ED
1
GRAPHENE OXIDE-REINFORCED ALUMINIUM-MATRIX NANOSTRUCTURED COMPOSITES FABRICATED BY ACCUMULATIVE ROLL BONDING
F. Ferreira1, I. Ferreira2, E. Camacho3, F. Lopes4, A.C. Marques5, A. Velhinho6
CENIMAT/I3N, Department of Materials Science, Faculty of Science and Technology, Universidade NOVA de Lisboa, Portugal 1. fbr.ferreira@campus.fct.unl.pt 2. imf@fct.unl.pt 3. e.camacho@campus.fct.unl.pt 4. fg.lopes@campus.fct.unl.pt 5. acl.marques@fct.unl.pt 6. ajv@fct.unl.pt Abstract
Accumulative Roll Bonding (ARB) was used to fabricate Graphene Oxide-reinforced Al-matrix composites.
Graphene Oxide reinforcement was suspended in a stabilized aqueous solution and applied, prior to each ARB cycle, through airgun spraying. Different concentrations (graphene oxide/milipore water) were used and for each concentration, samples produced have undergone up to 5 rolling cycles.
Optical and electron scanning microscopies were used for microstructural characterization which revealed a non-homogenous deformation of the layers across the composite’s thickness.
Although the presence of graphene-oxide promoted an increase in the microhardness, higher values were obtained
with its lowest concentration for similar samples. The number of ARB cycles and the direction of the tested sections also influenced the microhardness results since the 5-cycle samples and the rolling direction sections for all the samples achieved higher hardness results. Graphene Oxide revealed to be a major contributor to the increase of stiffness during
bending of the tested samples.
Keywords: Accumulative Roll Bonding (ARB); Metal-Matrix Composite (MMC); Graphene-Oxide (GO); Grain
M
AN
US
CR
IP
T
AC
CE
PT
ED
2
1. IntroductionComposites and their use have been a major subject of investigation in recent decades with an aim pursuing a
lightweight, hard and more resistant material while also retaining a good performance at high temperatures [1].
Metals and its alloys cannot simultaneously achieve the desired properties in terms of strength and stiffness in various
applications, wherefore it has become necessary to develop Metal Matrix Composites (MMCs). The composites’ ductility is provided by the metal matrix and the stiffness by the reinforcement, generally constituted by particles,
monofilaments or fibres of a ceramic material [1].
The most conventional techniques for the production of MMCs are casting and powder metallurgy, however, they
hold some drawbacks such as the production cost and imperfections like porosities and agglomeration of the reinforcements which lead to a low homogeneity affecting the mechanical and electrical properties of the composite. In order to reduce these disadvantages, this work focuses on an alternative technique, Accumulative Roll Bonding (ARB),
which in addition to the composite production allows a significant reduction of the matrix grain size, fitting in the field
of Ultra-Fine Grain (UFG) materials [1].
Several investigators have focused their study on UFG materials since these undergo several changes to their
microstructures. Such materials have great potential to improve mechanical properties, therefore increasing the possible applications of cheap and lightweight metals such as aluminium. At room temperature UFG materials present excellent strength and, if the grains are fairly stable, exhibit impressive superplastic properties at elevated temperatures.[2]
In order to obtain this grain size, several Severe Plastic Deformation (SPD) techniques can be used. In this work we
used the ARB technique which is a simple, continuous and low-cost process with a high productivity, reducing also the defects caused by porosities, agglomerates and low wettability of the reinforcements. These vast advantages make ARB
the most applied technique in the manufacture of UFG metal sheets [3, 4].
At the macroscopic level, the ARB process is similar to a classic rolling, however, differences occur at the microscopic level which relate to the degrees of freedom which are available for the plastic deformation of individual
grains.
ARB consists of a repeated stacking and hot roll bonding process of two strips. The initial strip is divided into two and both strips are surface-treated to remove impurities and oily residues which hinder the rolling process. The strips
are stacked, heated and go through rolling mills whose opening is equivalent to the thickness of one strip which provides a 50% reduction of the laminated strip thickness. Both rollers speed is equal but rotate in opposite directions, as can be seen in the following representative diagram of the process cycle in Fig.1:
M
AN
US
CR
IP
T
AC
CE
PT
ED
3
Fig.1: Representative diagram of ARB process using graphene oxide as reinforcement (adapted from [1]).
Due to high friction conditions between the sample and the roll, deformation can occur especially alongside the surface which results in an uneven distribution of the shear stress throughout its thickness. As such, and for the entire
thickness to obtain the ultrafine grain size, six ARB cycles are required which lead to a shear stress homogenization through the sample thickness [5].
Grain refinement occurs in a direction perpendicular to the surface which generates an anisotropic material. In the remaining directions, there is an increase in grain size which is readily observable by its length increase (very
significant) and width (less significant). In spite of the high stresses applied and consequent refinement of the material, its cross-section does not suffer any significant changes with the various layers being visible under an optical
microscope [1, 3].
Through each cycle and prior to the rolling process, reinforcement may be introduced. These reinforcements used in
ARB can be sheets, fibres or particles.
Particles deposition becomes a challenge as its distribution must be homogeneous and free from irregularities and
agglomerates wherefore this step must be carefully carried out. In order to ease an even deposition of the particles, these are usually suspended in a solution. At an industrial level the suspension solution is deposited by airgun spraying,
guaranteeing the high quality of the process [1, 6].
Indeed, in its early stages of investigation, the use of graphene as a reinforcement for MMC seems to have a great
value thanks to its outstanding intrinsic properties, such as high Young’s modulus (1 TPa), fracture strength (125 GPa), high thermal conductivity (5000 Wm-1 K-1) and charge-carrier mobility (200,000 cm2 V-1 s-1) [7–9].
In this work we used graphene oxide (GO) instead of graphene as a reinforcement which do not guarantee the same final properties of the material but it is easier to deposit and handling.
M
AN
US
CR
IP
T
AC
CE
PT
ED
4
This work is focused on two main objectives: to produce an Aluminium/GO MMC from a pre-treated aluminum
sheet using the ARB process and to characterize the composite’s microstructure and its mechanical properties. Given the interest being congregated by carbonaceous-reinforced aluminium composites from sectors like the automotive,
aeronautical and energy transmission industries, ARB-processed Aluminium/GO composites are expected to offer an alternative to current processing routes, which in a large measure correspond to powder metallurgy [10, 11] and surface
deposition [12] or surface treatment [13] methods.
2. Materials and experimental procedures
2.1. Materials
A commercial Aluminium sheet was cut into 100 × 50 × 0.8 mm3 individual strips and these were annealed at 500 ºC for 2 h in order to homogenize the microstructure and defuse any residual stresses present in the sheet material prior to any ARB process.
As reinforcement, GO was synthesized from pyrolytic graphite using the modified Hummers method as described elsewhere [14]. Concentrations of 0.5, 2.5 and 10 mg/ml (graphene oxide/millipore water) were used.
2.2. ARB processing
The ARB processing diagram is illustrated in Fig.1. Prior to each ARB cycle, the surfaces of the annealed strips
were prepared. This preparation consisted of wire brushing with a stainless steel brush in order to remove the oxide film caused by the annealing and to increase friction between the strips, followed by a degreasing ultra-sonic cleaning in
alcohol and acetone baths, respectively, for 720 s each. At this point the grapheme oxide particles were applied by airgun-spraying and both strips were stacked and tied with an Alumel (95% Ni, 5% Al) wire at both ends to ensure that
the strips don’t slide during the rolling process. The stacked strips were heated for 15 minutes at 550 ºC to alleviate stresses. A laboratory rolling mill was used for the ARB process consisting of two 75 mm diameter rolls at 13 rev/min
and no lubricant was used in any ARB cycle. The distance between rolls was equal to the thickness of one strip, 0.8 mm, resulting on a 50% thickness reduction after each cycle. The rolled strip was then cut in half and stacked again
after cleaning its surface. This process was repeated up to 5 ARB cycles for each GO concentration. The initial solution concentration does not directly reflect on the material concentration deposited on the composite which is subject to local
M
AN
US
CR
IP
T
AC
CE
PT
ED
5
concentration. One sample prepared without any reinforcement particles and with 5 ARB cycles was used for
comparison purposes.
The level of deformation resulting from each ARB cycle was calculated as ̅ = 0.61 through a classical plane-strain approach:
̅ = √ (1)
In the above equation, t0 and tf stand respectively for the material’s overall thickness before and after the rolling
operation.
2.3. Microstructure characterization
To analyse the microstructure, optical (OM, Leica DMI5000 M) and scanning electron microscopies (SEM, Zeiss
Auriga) were used. To identify the presence of the GO reinforcement and its distribution, Raman spectroscopy (WITec Alpha 300 RAS) was performed at room temperature using a 30 mW green laser with excitation wavelength of 532 nm.
Prior to any characterization the samples were prepared according to a conventional metallography method, being grinded and polished up to P4000 sandpaper followed by 1/2 µ m and 1/4 µ m diamond slurry (Amplex Diamix) using an
automatic polisher (Presi Mecatech 334) and etched with Keller’s reagent (5 ml 65% HNO3, 3 ml 37% HCl and 2 ml
48% HF in 190 ml distilled water) for 20 s. Both rolling direction (RD) and transverse direction (TD) sections were
observed. For each concentration, the tested samples had gone through 4 and 5 ARB cycles.
2.4. Mechanical tests
2.4.1. Microhardness test
For the microhardness measurement, a Vickers microhardness tester (ZWICK/ROELL) was used. All tests were
carried out with a load of 1 kg (HV1) and a dwell time of 15 s.
Hardness profiles were performed along the thickness of the sample, with the number of measurement points being
equal to 2n, where n is the number of ARB cycles, meaning that there is one measurement point for each layer, with each layer being equidistant from each other, and each one follows the diagonal of the section. Both RD and TD
M
AN
US
CR
IP
T
AC
CE
PT
ED
6
There were two identical samples for each concentration and the measurements were repeated to guarantee the
accuracy of the results.
2.4.2. Three-point bending test
In order to evaluate the stiffness modulus during bending EB and yield strength σy of the samples several static
three-point bending tests were carried using a standard universal testing machine with a 500 N load cell at a crosshead speed
5 mm min-1.
EB of the samples was measured following to Eq.(2) after the bending tests (ASTM D5934-02) [15]:
= (GPa) (2)
where F, L, W, D and t are the applied force (N), the length of support span (mm), the width of the sample (mm), the
maximum centre deflection/ maximum stroke (mm) and the thickness of the sample (mm), respectively.
Also, Yield Stress was evaluated through Eq. (3) by considering the onset of inelastic behaviour during bending:
# = $ (MPa) (3)
The length of the support span was 30 mm for all the tested samples except the 4-cycle ARB, without GO
reinforcement, which had a 20 mm length due to its dimension limitations. An annealed Al sample was tested for comparison purposes.
3. Results and discussions
3.1. Microstructure characterization
Bright field optical micrographs can be observed in Fig.2. The interface lines between layers can be observed in all
of the samples, which either means that the adhesion is not perfect across the section or that the GO is present in those interface lines, although there are regions where the Al-Al interface exists, resulting in a fading of those lines. This can
be explained by a possible non-homogeneous distribution of the GO reinforcement when applied or an aluminium dragging caused by the grinding and polishing process. Micrographs (a) and (b) correspond to the same 4-cycle ARB
M
AN
US
CR
IP
T
AC
CE
PT
ED
7
sample whereas (c) and (d) correspond to the same 5-cycle ARB sample. By comparing micrograph (a) and (b), which
correspond to a periphery layer and a middle layer respectively, there is a significant difference in the thickness of the layers (70 µm and 130 µm, respectively). This means that for this number of cycles (4) the grain refinement is not
homogenous through all the layers. Layers closer to the surface suffered higher deformation due to high friction conditions between the sample and the roll. Micrograph (c) shows one of the periphery layers and (d) shows one of the
middle layers. The difference between the thickness of these layers is smaller (47.4 µ m and 60.7 µ m, respectively), showing that grain refinement is more homogenous through the thickness of all layers in a 5-cycle ARB than a 4-cycle
ARB. As the number of ARB cycles increase, the thickness of all layers is expected to become similar across the sample section.
Fig.2: Optical Microscope microstructures from a 4-ARB sample periphery layer (a), one middle layer (b) and from a
5-ARB sample a periphery layer (c) and middle layers (d).
To further characterize the interface lines observed by the optical microscope several Raman spectroscopy measurements were carried out. Fig.3 shows a photo (a) of a sample interface region that was analysed through Raman
imaging in the area contained by the red square in the photo. The Raman maps corresponding to the regions of interest corresponding to the AlxOy and GO peaks in the spectra are shown in Fig.3 (b). The peaks of D and G bands for the GO
are at 1352 cm-1 and 1568 cm-1 respectively, which are both typical for pristine GO [8]. A peak of an Al oxide (AlxOy
M
AN
US
CR
IP
T
AC
CE
PT
ED
8
pre-heating process or H2O from the GO suspension. Intensity maps show thatin this region GO is more abundant than
M
AN
US
CR
IP
T
AC
CE
PT
ED
9
Fig.3: Mapped region of an interface (a) and its Raman spectra and intensity maps (b).
0 1000 2000 3000 560 570 580 600 650 700
In
te
n
s
it
y
(
c
ts
)
Raman shift (cm
-1)
In
te
n
s
it
y
(
c
ts
)
AlxOy GO698 rel. 1/cm
1568 rel. 1/cm
1352 rel. 1/cm
(a)
(b)
M
AN
US
CR
IP
T
AC
CE
PT
ED
10
Focusing on another interface region of the same sample, shown in the microscope photo of Fig. 4 (a), 8 Raman spectra were taken along the red line marked over the photo and all depicted in the graph of Fig. (b). The colours of the
spectra match the colours of the crosses marked along the red line as they represent the positions at which the spectra were recorded. Note that in the orange spectrum it is possible to identify the specific spectral signatures of AlxOy peaks
matching the brighter region of the interface, whereas the GO peaks match the darker regions. Although the peaks for D and G bands of GO should be approximately the same intensity, this is not seen in the red spectrum. Since several
defects can influence D band peak values, this discrepancy can be explained by harsh oxidization of the GO reinforcement.
M
AN
US
CR
IP
T
AC
CE
PT
ED
11
Where some material was removed by the polishing process, an interface was observed in SEM and shown in Fig. 5.
The formed AlxOy can be observed in the middle of the interface (b) whereas the GO cannot be identified neither
quantified.
Fig.5: SEM micrographs of an interface belonging to a 5-ARB sample of a TD-ND plane section at lower (a) and higher (b) magnification.
3.2. Mechanical Results
M
AN
US
CR
IP
T
AC
CE
PT
ED
12
ARB processed materials have an increment on its hardness. For the earlier ARB cycles this increase is primarily
related to strain hardening (i.e., increase in density of dislocations and their interactions) following by subgrain boundaries and/or dislocation cell wall formation [4]. The influence of grain refinement is attributed at higher ARB
cycles [15].
The average microhardness values of the ARB processed samples are shown in Fig.6. The results were obtained for
4 or 5-cycle ARB at different concentrations and at both TD and RD sections. For the RD section, the hardness is higher in all tested samples as along this direction the sample suffers a greater plastic deformation when rolled which can be
observed at a macroscopic level. The microhardness gap between TD and RD is ~5% in all samples, which confirms that ARB processed materials are anisotropic. GO influence on the average hardness (4-cycle ARB and both directions)
is ~10%. On average, when comparing the influence of the 5th cycle, the results show a significant increase of ~14 %, which is related to grain refinement caused by the 5th cycle. Considering all of the reinforced samples at 4-cycle ARB, the one with higher microhardness values is the lowest in terms of concentration (0.5 mg/ml, ~75 HV) and both 2.5
mg/ml and 10 mg/ml samples have similar results (~71 HV and ~70 HV, respectively). This difference can be explained
by a better adhesion and consolidation between the Al layers on the samples with less reinforcement. However, when the GO was applied by airgun-spraying, the suspension volume was not accounted for, so the exact quantity of graphene
cannot be quantified. Therefore, and contrary to expectations, a dissimilar trend was observed in the variation of microhardness with GO content between the 4-cycle and the 5-cycle samples. For the 5-cycle samples (0.5 mg/ml and 2.5 mg/ml concentrations) the microhardness values have no significant difference (~83 HV and ~82 HV respectively).
Fractures on the Al matrix and the presence of Aluminium oxide, observed in Raman spectroscopy and SEM, also
M
AN
US
CR
IP
T
AC
CE
PT
ED
13
Fig.6: Average microhardness comparison between the GO concentrations of the suspension applied, direction and number of ARB cycles.
The hardness profiles of two samples using the same concentration (2.5 mg/ml) and same direction section (RD) but different number of ARB cycles are represented in Fig.7. As expected, these profiles are not linear but assume an
oscillatory form since the plastic deformation is not homogenous through the thickness of the sample and through each layer. The standard deviation and variance values for the 4-cycle ARB sample are 4.4 HV and 19.3 HV2, respectively. For the 5-cycle ARB sample the standard deviation and variance are 3.3 HV and 10.8 HV2, respectively. As referred to
before, this difference exists because the grain refinement is more homogenous in the 5-cycle ARB sample than the
4-cycle sample. As the number of ARB 4-cycles increase, it is expected that the standard deviation and variance decrease, and when the hardening behaviour saturates at larger strains, these values are reduced to zero, as previously reported
M
AN
US
CR
IP
T
AC
CE
PT
ED
14
Fig.7: Two microhardness profiles of identical samples but different number of ARB cycles (4 and 5).
3.2.2. Three-point bending test
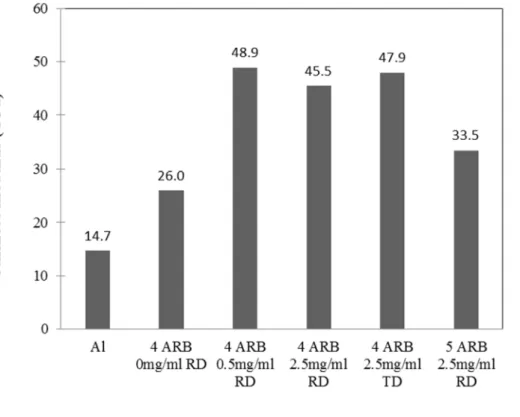
The three-point bending test was performed in order to observe the behaviour of the samples when subjected to significant tensile and compressive stresses. The processed composites that were reinforced using the highest GO concentration (10 mg/ml) could not be tested since delamination occurred during the cutting process, revealing a weak
bond between layers for these specimens. The results concerning the stiffness modulus under bending conditions for the
tested samples are represented in Fig. 8. Note that, according to Eq. (2), these values should be independent from the dimensions of the sample and length of the support span. The influence of the GO reinforcement is clearly present since
for the same number of ARB cycles (4) the composites revealed EB ~80% higher than the sample with no
reinforcement. The weaker performance of the 5-cycle ARB composite results from a complete delamination, which occurred at a stress of 105 MPa, suggesting that, for this specimen, the bond between layers was weaker than the
4-cycle samples, since no delamination was visible in any of them. For the same sample, there is no significant difference
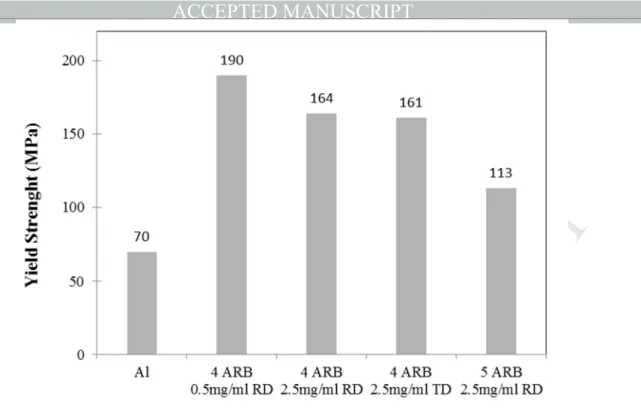
when considering the tested directions. The ARB process also influenced the bending strength due to strain hardening (severe plastic deformation) although not as much as the GO reinforcement. In Fig. 9 are represented the yield strength
M
AN
US
CR
IP
T
AC
CE
PT
ED
15
since the length of the support span was 20 mm (instead of 30 mm) and more applied force was needed to reach plastic
range.
Fig. 8: Comparison of the stiffness modulus values measured during bending between GO concentrations of the
M
AN
US
CR
IP
T
AC
CE
PT
ED
16
Fig. 9: Yield strength comparison between GO concentrations of the suspension applied, direction and number of ARB cycles.
Overall and considering this test, the 4-cycle ARB composite using the lowest concentration (0.5 mg/ml) had the
best performance which is similar to the microhardness results for this number of ARB cycles.
4. Conclusions
Ultrafine structured Aluminium GO-reinforced with GO composite was produced by ARB up to 5 cycles.
Microstructural and mechanical characterizations were carried out. The conclusions drawn from the results can be summarized as follows.
Optical Microscope (OM) results show that the deformation of the layers is not homogenous across the sample.
Middle layers (earlier ARB cycles) suffer less deformation than the periphery ones, although this difference tends to
decrease at later ARB cycles.
Using airgun-spraying to deposit the GO reinforcement revealed to be a good method although it is difficult to
M
AN
US
CR
IP
T
AC
CE
PT
ED
17
The presence of GO has been identified by Raman spectroscopy where its D and G were well identified and mapped
though the Al junction. Some small regions of AlxOy were also identified both by Raman mapping and EDS/SEM.
Overall we conclude that:
1) The presence of GO contributed to an increase of ~10% to the average microhardness. Concerning the 4-cycle ARB samples, the lowest concentration suspension (0.5 mg/ml) revealed to increase the microhardness the most
and it is presumably related to a more homogenous deposition.
2) The fifth ARB cycle contributed to an ~14% increase on the microhardness of the tested samples. The anisotropy of
the ARB samples was confirmed since the microhardness average of the RD sections is ~5% superior to the TD sections in all samples due to a higher grain refinement along the rolling direction.
3) Hardness profiles present an oscillatory form which tends to become linear as the number of ARB cycles increase. 4) Bending tests revealed a greater influence of the GO reinforcement over the bending stiffness than the number of
ARB cycles. Complete delamination only occurred in the 5-cycle ARB hence its low performance in this test.
Acknowledgements
The authors would like to acknowledge Portuguese Science and Technology Foundation/Portuguese Ministry for Science, Technology and Higher Education for funding granted to Materials Research Centre/Institute for
Nanostructures, Nanomodelling and Nanofabrication under Strategic Project on Materials Science and Technology
(Strategic Project-LA25-2013-2014).
References
1. Ana, S.V.A., Reihanian, M., Lotfi, B.: Accumulative roll bonding (ARB) of the composite coated strips to
fabricate multi-component Al-based metal matrix composites. Mater. Sci. Eng. A. 647, 303–312 (2015).
2. Huang, Y., Langdon, T.G.: Advances in ultrafine-grained materials. Mater. Today. 16, 85–93 (2013).
3. Daneshvar, F., Reihanian, M., Gheisari, K.: Al-based magnetic composites produced by accumulative roll bonding (ARB). Mater. Sci. Eng. B Solid-State Mater. Adv. Technol. 206, 45–54 (2016).
4. Gashti, S.O., Fattah-alhosseini, A., Mazaheri, Y., Keshavarz, M.K.: Effects of grain size and dislocation density
M
AN
US
CR
IP
T
AC
CE
PT
ED
18
Compd. 658, 854–861 (2016).5. Lee, S.H., Sakai, T., Shin, D.H.: Fabrication of ultrafine grained aluminum by differential speed accumulative
roll-bonding (ARB) process. Mater. Trans. 44, 1382–1385 (2003).
6. Schmidt, C.W., Knieke, C., Maier, V., Höppel, H.W., Peukert, W., Göken, M.: Accelerated grain refinement during accumulative roll bonding by nanoparticle reinforcement. Scr. Mater. 64, 245–248 (2011).
7. Wang, J., Li, Z., Fan, G., Pan, H., Chen, Z., Zhang, D.: Reinforcement with graphene nanosheets in aluminum
matrix composites. Scr. Mater. 66, 594–597 (2012).
8. Zaaba, N.I., Foo, K.L., Hashim, U., Tan, S.J., Liu, W.W., Voon, C.H.: Synthesis of Graphene Oxide using Modified Hummers Method: Solvent Influence. Procedia Eng. 184, 469–477 (2017).
9. Garcia Maraschin, T.: Preparação De Óxido De Grafeno E Óxido De Grafeno Reduzido E Dispersão Em Matriz
Polimérica Biodegradável Dissertação Para a Obtenção Do Título De Mestre Em Engenharia E Tecnologia De Materiais. 89 (2016).
10. Liu, J., Khan, U., Coleman, J., Fernandez, B., Rodriguez, P., Naher, S., Brabazon, D.: Graphene oxide and
graphene nanosheet reinforced aluminium matrix composites : Powder synthesis and prepared composite characteristics. JMADE. 94, 87–94 (2016).
11. Ashwath, P., Jeyapandiarajan, P., Joel, J., Prashantha, H.G., Xavior, M.A., Sumanth, N., Reddy, C.S.:
ScienceDirect ICMMM - 2017 FLEXURAL STUDIES OF GRAPHENE REINFORCED ALUMINIUM METAL MATRIX COMPOSITE. Mater. Today Proc. 5, 13459–13463 (2018).
12. Tian, W., Li, S., Wang, B., Chen, X., Liu, J., Yu, M.: Graphene-reinforced aluminum matrix composites
prepared by spark plasma sintering Graphene-reinforced aluminum matrix composites prepared by spark plasma sintering. 0–7 (2016).
13. Dixit, S., Mahata, A., Mahapatra, D.R., Kailas, S. V, Chattopadhyay, K.: Multi-layer graphene reinforced
aluminum – Manufacturing of high strength composite by friction stir alloying Multi-layer graphene reinforced aluminum – Manufacturing of high strength composite by friction stir alloying. Compos. Part B. 136, 63–71
(2017).
14. Faria, P., Duarte, P., Barbosa, D., Ferreira, I.: New composite of natural hydraulic lime mortar with graphene oxide. Constr. Build. Mater. 156, 1150–1157 (2017).
15. Eizadjou, M., Manesh, H.D., Janghorban, K.: Microstructure and mechanical properties of ultra-fine grains ( UFGs ) aluminum strips produced by ARB process. 474, 406–415 (2009).
M
AN
US
CR
IP
T
AC
CE
PT
ED
19
M
AN
US
CR
IP
T
AC
CE
PT
ED
20
Fig.2: Representative diagram of ARB process using graphene oxide as reinforcement (adapted from [1]).
Fig.2: Optical Microscope microstructures from a 4-ARB sample periphery layer (a), one middle layer (b) and from a
5-ARB sample a periphery layer (c) and middle layers (d).
Fig.3: Mapped region of an interface (a) and its Raman spectra and intensity maps (b).
Fig.4: Raman Spectra (b) corresponding to the points marked along the red line in the microscope image.
Fig.5: SEM micrographs of an interface belonging to a 5-ARB sample of a TD-ND plane section at lower (a) and higher (b) magnification.
Fig.6: Average microhardness comparison between the GO concentrations of the suspension applied, direction and number of ARB cycles.
Fig.7: Two microhardness profiles of identical samples but different number of ARB cycles (4 and 5).
Fig. 8: Comparison of the stiffness modulus values measured during bending between GO concentrations of the suspension applied, direction and number of ARB cycles.
Fig. 9: Yield strength comparison between GO concentrations of the suspension applied, direction and number of ARB