The
UCP2 -866G/A, Ala55Val and UCP3 -55C/T
polymorphisms are
associated with premature coronary artery disease and cardiovascular risk
factors in Mexican population
Ricardo Gamboa
1, Claudia Huesca-Gómez
1, Vanessa López-Pérez
1, Rosalinda Posadas-Sánchez
2, Guillermo
Cardoso-Saldaña
2, Aida Medina-Urrutia
2, Juan Gabriel Juárez-Rojas
2, María Elena Soto
4, Carlos
Posadas-Romero
2and Gilberto Vargas-Alarcón
31
Department of Physiology, Instituto Nacional de Cardiología “Ignacio Chávez”, Mexico D.F., Mexico.
2Department of Endocrinology, Instituto Nacional de Cardiología “Ignacio Chávez”, Mexico D.F., Mexico.
3Department of Molecular Biology, Instituto Nacional de Cardiología “Ignacio Chávez”, Mexico D.F.,
Mexico.
4Department of Immunology, Instituto Nacional de Cardiología “Ignacio Chávez”, Mexico D.F., Mexico.
Abstract
We examined the role ofUCP gene polymorphisms as susceptibility markers for premature coronary artery disease (pCAD). TheUCP2 Ala55Val (C/T rs660339), UCP2 -866G/A (rs659366), and UCP3 -55C/T (rs1800849) poly-morphisms were genotyped in 948 patients with pCAD, and 763 controls. The distribution of theUCP2 A55V (C/T rs660339) andUCP3 -55 (rs1800849) was similar in patients and controls. However, under a recessive model, the UCP2 -866 (rs659366) A allele was associated with increased risk of developing pCAD (OR = 1.43, Pc = 0.003). On the other hand, patients with pCAD andUCP2 A55V (rs660339) TT showed high levels of visceral abdominal fat (VAF) (Pc = 0.002), low levels of subcutaneous abdominal fat (SAF) (Pc = 0.001) and high VAT/SAT ratio (Pc < 0.001). Also, patients withUCP2 -866 (rs659366) AA showed increased levels of VAF (Pc = 0.003), low levels of SAF (Pc = 0.001) and a high VAT/SAT ratio (Pc = 0.002), whereas patients with the UCP3 -55 (rs1800849) TT presented high levels of VAF (Pc = 0.002). The results suggest the association of the UCP2 -866 (rs659366) polymorphism with risk of developing pCAD. Some polymorphisms were associated with abdominal fat levels and cardiovascular risk factors.
Keywords:UCPspolymorphisms, premature coronary artery, cardiovascular risk, Mexican population.
Received: January 10, 2017; Accepted: October 18, 2017.
Introduction
The incidence and prevalence of coronary artery dis-ease (CAD) has been increasing in recent decades, becom-ing one of the leadbecom-ing causes of mortality worldwide. It is known that obesity is one of the main factors associated with CAD (Makedou et al., 2009; Pischon et al., 2009; Center for Disease Control and Prevention, 2010). Adipose tissue, in particular the intra-abdominal visceral fat, is able to synthesize and release a variety of hormones and cyto-kines, which are active molecules relevant in the develop-ment of CAD. Furthermore, excess adipose tissue is associated with factors that increase the risk of developing CAD such as hyperinsulinemia, insulin resistance, hyper-tension, and dyslipidemia (Kilet al., 2005; Muzzioet al., 2005). There is evidence suggesting that obesity is
associ-ated with cardiac hemodynamics. So, obesity is linked to hyperdynamic circulation, which maintains the metabolic demand caused by excessive fat deposition. Several studies have shown a positive association between body weight and CAD (Vasan, 2003; Zamboniet al., 2005). Moreover, energy expenditure is a complex trait comprised of the rest-ing metabolic rate, the energy expenditure due to physical activity and diet-induced adaptive thermogenesis. In this context, uncoupling proteins (UCPs) are a family of mito-chondrial transporters, which play a crucial role in the pro-cess of adaptive thermogenesis (Gronek and Holdys,
2013). UCP function is primarily the uncoupling of the mi-tochondrial oxidative phosphorylation by promoting the leakage of protons across the inner mitochondrial mem-brane without their passing through the charge path to syn-thesize ATP (a process involved in the production of heat). As a result of this decoupling mechanism, a mobilization of stored triglycerides ensues, which plays an important role in fat metabolism.
DOI: http://dx.doi.org/10.1590/1678-4685-GMB-2017-0008
Send correspondence to Gilberto Vargas-Alarcón, Instituto Nacio-nal de Cardiología “Ignacio Chávez” Juan Badiano No 1, Col. Sección XVI, 14080 Mexico, D.F., Mexico.E-mail: [email protected].
UCPs are integral proteins located in the mitochon-drial inner membrane; they have a molecular mass ranging from 31 kDa to 34 kDa (Ledesmaet al., 2002). The uncou-pling protein UCP-2 is widely expressed in various human tissues, such as the spleen, thymus, leukocytes, macro-phages, bone marrow and stomach (Bosset al., 1997; Fleu-ryet al., 1997). In this regard,UCP-2mRNA levels in these tissues and in intra-abdominal subcutaneous adipose tissue are lower in obese subjects compared to lean subjects. On the other hand, several studies have already described that UCP-2 has an anti-atherogenic effect in the vascular wall (Blancet al., 2003), it improves tolerance to cardiac ische-mia (McLeodet al., 2005; Cheurfaet al., 2008) and pro-tects cardiomyocytes from oxidative stress induced cell death (Teshimaet al., 2003). In contrast, the uncoupling protein UCP-3 is highly specific of the skeletal muscle, and it has been suggested that it is one of the main regulators of adaptive thermogenesis in humans (Argileset al., 2002; Schrauwenet al., 2002). Some studies have reported asso-ciations between uncoupling protein UCP’s polymor-phisms and type 2 diabetes mellitus (T2DM). Particular at-tention has been focused on the UCP-1 -3826A/G
(rs1800592),UCP2 -866G/A(rs659366),UCP2 Ala55Val
(C/T; rs660339) andUCP3 -55C/T(rs1800849) polymor-phisms. However, the results of these studies are controver-sial with positive and negative associations (Jiaet al., 2009, Jiaet al., 2010; De Souza et al., 2011; Brondaniet al., 2012). This point is of great relevance since it has been ob-served that almost 70% of patients with diabetes or im-paired glucose tolerance present cardiovascular disease (Norhammaret al., 2002). Also, some studies have shown that polymorphisms of theUCPgenes may contribute to metabolic disorders with major effects on energy metabo-lism. The polymorphism-866 G/A(rs659366) has been sig-nificantly associated with asymptomatic carotid artery ath-erosclerosis in women (Oberkofleret al., 2005) and with CAD in men (Dhamraitet al., 2004). It is known that acute coronary syndromes are the result of a progressive transfor-mation of fatty streaks in atherosclerotic plaques. In these patients, surgery has proven to be a treatment option, which improves symptoms, quality of life and prognosis. In this context, it is important to study the role of UCPs, given that these uncoupling proteins are actively involved in the stor-age of fat, which constitutes a major cardiovascular risk factor. Therefore, the identification of variants in theUCP
genes (UCP2 -866, UCP2 A55VandUCP3 -55C/T) in pa-tients with CAD will aid in evaluating their participation in the predisposition to this disease.
Subjects and Methods
Subjects and measures
All participants gave written informed consent. The study complied with the Declaration of Helsinki and was approved by the Ethics Committee of the Instituto Nacional
de Cardiología Ignacio Chávez (INCICh). The primary aim of the Genetics of Atherosclerotic Disease (GEA) Study is to investigate genetic factors associated with pCAD, sub-clinical atherosclerosis (SA) and other coronary risk factors in the Mexican population. All GEA participants are unre-lated and of self-reported Mexican-mestizo ancestry (for at least three generations). Incidentally, a Mexican-mestizo is defined as someone born in Mexico who is a descendant of both the original autochthonous inhabitants and Caucasian (predominantly Spaniards) and/or African individuals. We analyzed 1711 individuals, 948 diagnosed with pCAD and 763 healthy unrelated controls (with negative calcium score by computed tomography). pCAD was defined by personal history of myocardial infarction, angioplasty, by-pass surgery, or coronary stenosis > 50% (determined by angiography). Selection was performed among the out-patients and patients attending for diagnostic or thera-peutic catheterization. Only patients with pCAD (age at di-agnosis < 55 years in men and < 65 in women) who did not experience acute cardiovascular events in the three months prior to the study were included. Also, patients with con-gestive heart failure, liver disease, kidney cancer, untreated dysthyroidism and those with corticosteroid treatment were not included. Controls were apparently healthy asymptom-atic individuals without family history of pCAD; they were recruited from blood bank donors and through brochures posted at social service centers. Exclusion criteria for con-trols included congestive heart failure, liver, renal, thyroid or oncological disease. The selection of the patients and controls for the GEA study was described in a previous study (Villarreal-Molina et al., 2012). All participants filled out standardized questionnaires to provide demo-graphic information, level of education, income, family and personal history of cardiovascular disease, dietary habits, physical activity, alcohol consumption and use of drugs and supplements.
formula: [fasting insulin (pmol/L) x times / fasting glucose (mmol/L)]/ 135. Samples for each human subject were ana-lyzed as a single batch. Specifically, the interassay coeffi-cient of variation for the assays was less than 5%.
Computed tomography of the chest and abdomen
Computed tomography of the chest and abdomen were performed using a 64-channel multi-detector helical computed tomography system (Somatom Sensation, Sie-mens) and interpreted by experienced radiologists. Scans were read to assess and quantify three parameters: 1) Coro-nary artery calcification (CAC) score using the Agatston method (Mautner et al., 1994); 2) total abdominal fat (TAF), subcutaneous abdominal fat (SAF) and visceral ab-dominal fat (VAF) as described by Kvistet al.(1988), in or-der to estimate visceral to subcutaneous adipose tissue ratio (VAT/SAT); and 3) hepatic to splenic attenuation ratio (LSAR) as described by Longoet al.(1993). All patients and a group of 950 healthy controls underwent a tomogra-phy examination. Remarkably, 187 subjects in the appar-ently healthy control group presented positive CAC (CAC score > 0) and were considered as individuals with subcli-nical atherosclerosis. These subjects were not considered in the analysis. The control group only included individuals with negative CAC (n = 763).
DNA preparation
Genomic DNA was extracted from whole blood con-taining EDTA by standard techniques. The UCP2 Ala55Val(C/Trs660339),UCP2-866G/A (rs659366), and
UCP3 -55C/T (rs1800849) polymorphisms were geno-typed using 5’ exonuclease TaqMan genotyping assays on an ABI Prism 7900HT Fast Real-Time PCR system, ac-cording to manufacturer’s instructions (Applied Biosys-tems, Foster City, CA, USA)
Statistical analysis
All calculations were performed using SPSS version 18.0 (SPSS, Chicago, Il, USA) statistical package. Means
± SD and frequencies of baseline characteristics were esti-mated. Chi-square test was used to compare frequencies and ANOVA and Student’s t-test was used to compare means. Variables with skewed distribution were shown as median (minimum-maximum) and analyzed using a non-parametric test. Logistic regression analysis was used to test for polymorphism associations with pCAD under in-heritance models, adjusted by age, gender, body mass index (BMI), and HDL-C levels. ANCOVA was used to deter-mine associations between the polymorphisms and some clinical and metabolic variables, adjusting for the signifi-cant confounding factors like age, gender, smoking habit and physical activity as appropriate. Bonferroni correction was employed to control for multiple testing. Thep-values for associations of the polymorphisms with pCAD were corrected by three comparisons, for associations with
sub-cutaneous, visceral and total fat were corrected by four comparisons and for associations with cardiovascular risk factors were corrected by seven comparisons. The cor-rected p values are indicated asPc. Genotype frequencies did not show deviation from Hardy-Weinberg equilibrium (HWE) (P> 0.05). Pairwise linkage disequilibrium (LD, D’) estimations between polymorphisms and haplotype re-construction were performed with Haploview version 4:1 (Broad Institute of Massachusetts Institute of Technology and Harvard University, Cambridge, MA, USA).
Results
General clinical characteristics of the population are shown in Tables 1 and 2. The statistical differences be-tween groups are shown.
Observed and expected frequencies in the studied polymorphisms were in HWE. The distribution of the
UCP2 A55V(rs660339) andUCP3 -55(rs1800849) poly-morphisms was similar in patients with pCAD and healthy controls in all the models analyzed (Table 3). However, un-der the recessive model adjusted for age, genun-der, BMI, and HDL-C, theUCP2 -866(rs659366) polymorphism was as-sociated with an increased risk of developing pCAD (OR = 1.43, 95% CI:1.15-1.78,Pc= 0.003). Statistical power to detect associations withUCP2 Ala55Val(C/Trs660339),
UCP3 -55C/T (rs1800849), and UCP2 -866G/A (rs659366) was 0.20, 0.06 and > 0.80, respectively, as
esti-mated with QUANTO software
(biostats.usc.edu/Quanto.html).
The association of the polymorphisms with TAF, SAF and VAF was analyzed in pCAD patients (Table 4). In this analysis, patients with theUCP2 A55V(rs660339)TT
genotype presented high levels of VAF (Pc= 0.002), low levels of SAF (Pc= 0.001) and high VAT/SAT ratio (Pc< 0.001). Also, pCAD patients with the UCP2 -866
(rs659366)AAgenotype showed increased levels of VAF (Pc= 0.003), low levels of SAF (Pc = 0.001) and high VAT/SAT ratio (Pc= 0.002), whereas pCAD patients with theUCP3 -55(rs1800849)TTgenotype showed high levels of VAF (Pc= 0.002).
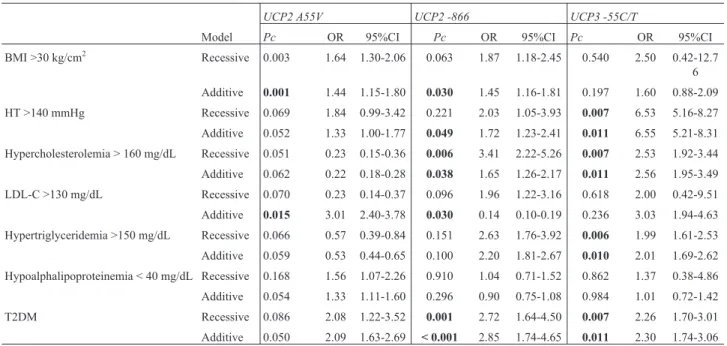
The association of theUCPpolymorphisms with car-diovascular risk factors and metabolic parameters was ana-lyzed (Table 5). The UCP2 A55V (rs660339) polymor-phism was associated with BMI > 30 kg/cm2(OR = 1.64, 95% CI: 1.30-2.06, Pcrec = 0.003; OR = 1.44, 95% CI: 1.15-1.80,Pcadd= 0.001) and LDL-C > 130 mg/dL (OR = 3.01, 95% CI: 2.40-3.78, Pcadd= 0.015). TheUCP2 -866
(rs659366) was associated with BMI > 30 kg/cm2(OR = 1.45, 95% CI: 1.16-1.81,Pcadd= 0.030), blood pressure > 140 mmHg (OR = 1.72, 95% CI: 1.23-2.41,Pcadd= 0.049), hypercholesterolemia (OR = 3.41, 95% CI: 2.22-5.26,Pcrec = 0.006; OR = 1.65, 95% CI: 1.26-2.17,Pcadd= 0.038), and T2DM (OR = 2.72, 95% CI: 1.64-4.50,Pcrec= 0.001; OR = 2.85, 95% CI: 1.74-4.65,Pcadd< 0.001). Finally, theUCP3
blood pressure > 140 mmHg (OR = 6.53, 95% CI: 5.16-8.27,Pcrec= 0.007; OR = 6.55, 95% CI: 5.21-8.31,Pcadd= 0.011), hypercholesterolemia (OR = 2.53, 95% CI: 1.92-3.44,Pcrec= 0.007; OR = 2.56, 95% CI: 1.95-3.49,Pcadd= 0.011), hypertriglyceridemia (OR = 1.99, 95% CI:
1.61-2.53,Pcrec= 0.006; OR = 2.01, 95% CI: 1.69-2.62,Pcadd= 0.010), and T2DM (OR = 2.26, 95% CI: 1.70-3.01,Pcrec= 0.007; OR = 2.30, 95% CI: 1.74-3.06,Pcadd= 0.011).
The analysis of haplotypes showed one block com-posed of two polymorphisms in linkage disequilibrium (D’=0.964, r2= 0.881),UCP2 A55V(rs660339) andUCP2 -866(rs659366). The analyses showed three different pos-sible allele combinations (GC,ATandAC). Nonetheless, the distribution of these haplotypes was similar in both pCAD patients and healthy controls (data no shown).
Discussion
It is known that many molecular mechanisms are im-plicated in cardiovascular damage. These mechanisms in-clude advanced glycation end products (AGE), protein kinase C, polyol and hexosamine pathway. They appear to be associated with an overproduction of superoxide by the mitochondrial electron transport chain (Gioli-Pereiraet al., 2013). In this phenomenon participate the uncoupling pro-teins (UCPs) and in consequence, the genes that encode these molecules (UCP1,UCP2andUCP3) are regarded as candidate genes for obesity, T2DM and cardiovascular dis-ease. Therefore, the identification of variants present in
UCPgenes and their relation to visceral and subcutaneous adipose tissue and lipid parameters in patients with CAD can assist in evaluating their participation in predisposition to this disease. Previous studies have explored the effects of these genes on various traits in different populations (Hol-dyset al., 2013). However, results are inconsistent con-cerning the association with dyslipidemic parameters.
In the present study, we determined whether the
UCP2 Ala55Val(rs660339),UCP2 -866G/A (rs659366), andUCP3 -55C/T(rs1800849) polymorphisms are associ-Table 2- Metabolic characteristics of the study population
Control group N= 763
pCAD group N= 948
P
Total-Cholesterol (mg/dL)
192.09±35.8 165.83±46.92 < 0.001
HDL-C (mg/dL) 50.06±14.39 41.28±10.85 < 0.001
LDL-C (mg/dL) 116.46±31.22 96.31±38.92 < 0.001
TG (mg/dL) 160.78±100.34 175.83±101.32 0.007
Glucose (mg/dL) 96.08±31.20 103.06±34.74 < 0.001
Insulin (mg/dL) 18.89±9.63 23.06±14.97 < 0.001
HOMA-IR 4.54±2.95 5.82±4.68 < 0.001
Uric acid (mg/dL) 5.10±1.31 6.40±1.61 < 0.001
Creatinine (mg/dL) 0.78±0.17 1.00±0.17 < 0.001
ALT (IU/L) 27.36±19.55 29.8±19.97 0.023
AST (IU/L) 27.35±12.62 28.07±10.59 0.606
ALP (IU/L) 84.59±25.95 80.49±25.49 0.005
ApoB (mg/dL) 92.01±27.00 83.10±31.05 < 0.001
ApoA (mg/dL) 143.03±34.39 127.34±27.00 < 0.001
T2DM (%) 9.7 23.1 < 0.001
Data are expressed as means±SD. HDL-C: High density lipoprotein-Cholesterol, LDL-C: Low density lipoprotein-lipoprotein-Cholesterol, TG: Triglycer-ides, HOMA: Homeostatic model in insulin resistance, ALT: Alanine aminotransferase, AST: Aspartate aminotransferase, ALP: Alkaline phos-phatase, T2DM: Type 2 Diabetes mellitus
Table 1- Demographic and clinical characteristics of the study population
Control group N= 763 pCAD group N= 948 P
Sex W/M (%) 80.1/19.9 19.1/80.9 < 0.001
Age (years) 52.2±8.9 53.5±7.8 0.002
Body Mass Index (kg/cm2) 28.1±4.6 28.5±4.1 0.245
Systolic Pressure (mmHg) 114.5±16.6 118.2±18.2 < 0.001
Diastolic Pressure (mmHg) 70.7±8.9 72.4±9.8 0.001
Overweight (%) 45.6 48.0 < 0.001
Obesity (%) 29.5 33.9 < 0.001
Smoker (%) 48.4 49.5 < 0.001
HT (%) 17.3 66.4 < 0.001
Hepatic steatosis (%) 29.7 26.8 0.289
VAF/SAF (cm2) 0.554 (014-3.21) 0.721 (0.14-4.52) < 0.001 SAF (cm2) 304.94 (64-713) 260.22 (57-774) < 0.001
VAF (cm2) 147.89 (27-473) 172.60 (23-504) < 0.001
Total Abdominal Fat (cm2) 452.90 (91-1032) 432.44 (113-1031) 0.071
Data are expressed as means±SD, percentage or median (min-max).
ated with risk of developing pCAD or clinical/metabolic parameters. We found a higher frequency in the minor al-lele in theUCP2 -866 (rs659366) variants in the pCAD group, with a significant difference in the recessive model. Similar allele and genotype frequencies have been found in Asian populations (Oktavianthiet al., 2012). In spite that our study included an important number of patients and healthy controls, the statistical power for two polymor-phisms was low [20% forUCP2 Ala55Val(C/Trs660339 and 6% forUCP3-55C/T(rs1800849)]. Thus, the non sig-nificant results with these polymorphisms could be due to this lack of statistical power.
Other studies have explored the association ofUCP
genes with abdominal obesity and lipid levels in several populations; yet, results have been inconclusive. In addi-tion, most of the studies have been based on indices of
ab-dominal obesity like waist circumference, waist-to-hip ra-tio (WHR) and body mass index. In our study, we ascertain the abdominal and visceral fat by computed tomography. Although no BMI difference between our groups was found, the analysis showed association between theUCP
variants and SAF and VAF levels. These results indicate an increase in the VAF in pCAD subjects depending of the
UCP2 55(rs660339)TT,UCP2 -866(rs659366)AA and
UCP3 -55TT(rs1800849) genotypes. Some studies have reported that a high fat diet increasesUCP2mRNA expres-sion in white adipose tissue in some mouse strains (Surwit
et al., 1998). In Caucasoid and Indian populations, the
UCP3 -55(rs1800849)Tallele was associated with abdom-inal obesity (Casselet al., 2000; Herrmannet al., 2003), meanwhile in Asian population theCallele present in the
CGTACC haplotype was associated with this condition Table 4- Association of theUCPpolymorphisms with subcutaneous, visceral and total fat.
UCP2 55 TT UCP2 -866 AA UCP3 -55 TT
pCAD Control Pc pCAD Control Pc pCAD Control Pc
VAT/SAT 0.682 (0.14-2.25)
0.547 (0.15-2.54)
< 0.001 0.703
(0.14-2.11)
0.545 (0.14-3.21)
0.002 0.696
(0.14-4.52)
0.561 (0.14-3.21)
0.247
SAF 263.51 (28-639)
310.14 (66-663)
0.001 255.07
(78-722)
305.12 (66-674)
0.001 260.92
(58-774)
307.35 (64-713)
0.524
VAF 172.66 (35-445)
149.80 (41-464)
0.002 175.49
(43-407)
144.64 (40-473)
0.003 172.43
(23-504)
150.05 (27-473)
0.002
TAF 436.17 (143-956)
459.81 (145-958)
0.622 430.58 (143-827)
449.74 (134-1032)
0.571 432.84 (113-1031)
457.49 (91-1032)
0.744
VAT/SAT: ratio visceral to subcutaneous adipose tissue ratio. SAF: Subcutaneous Abdominal Fat, VAF: Visceral Abdominal Fat, TAF: Total Abdomi-nal Fat.
Bonferroni correction was made multiplying by 4 comparisons (Pc). Significant p values are in bold.
Table 3- Association ofUCPpolymorphisms with pCAD.
N (%) MAF Model OR (95% CI) Pc
UCP2 A55V C/C C/T T/T
Control 191 (25.0) 394 (51.7) 178 (23.3) 0.491 Dominant 0.095 (0.76-1.19) 0.682 (N= 763)
pCAD 256 (27.1) 459 (48.7) 228 (24.2) 0.485 Recessive 1.15 (0.92-1.43) 0.193
(N= 943) Additive 1.09 (0.88-1.35) 0.114
UCP2 -866 G/G G/A A/A
Control 222 (29.1) 377 (49.4) 164 (21.5) 0.461 Dominant 0.82 (0.65-1.03) 0.098 (N= 763)
pCAD 211 (22.2) 501 (52.8) 236 (24.9) 0.513 Recessive 1.43 (1.15-1.78) 0.003
(N= 943) Additive 0.68 (0.53-0.85) < 0.001
UCP3 -55 C/C C/T T/T
Control 552 (72.3) 192 (25.2) 19 (2.5) 0.150 Dominant 1.29 (0.67-2.49) 0.432 (N= 763)
pCAD 708 (74.7) 219 (23.3) 18 (1.9) 0.134 Recessive 1.14 (0.91-1.41) 0.229
(N= 943) Additive 1.15 (0.93-1.42) 0.362
(Chaet al., 2007). Also, theUCP2 -866(rs659366)Aallele was associated with lower abdominal obesity indices in Caucasian population (Salopuroet al., 2009). Despite the consistency of these findings with previous reports, contra-dictory results have been reported in different populations (Pedersenet al., 2005; Qinet al., 2013; Xu,et al., 2011). This could be due to diet and life style, genetic charge be-tween different ethnic groups, and also to the sample size, source of controls and genotyping methods.
Previous studies have found that UCP2 A55V
(rs660339) polymorphism is associated with cardiovascu-lar event risk in patients with CAD and dysglycemia (Gioli-Pereira et al., 2013). Alternatively, other research groups have reported that subjects carrying theVal/Val ge-notype in this polymorphism appear to have the following traits: a lower degree of uncoupling of the mitochondrial in-ternal membrane, lower energy expenditure (Astrupet al., 1999), higher exercise energy efficiency (Buemannet al., 2001), higher metabolic rate, high atherogenic index, in-creased susceptibility to obesity and T2DM and greater weight loss than subjects with the Ala allele (De Souzaet al., 2013; Brondaniet al., 2014). In our study, theUCP2 A55V(rs660339) polymorphism was associated with BMI > 30 Kg/cm2.
Also, Pedersenet al.(2005) reported thatUCP2and
UCP3increase the serum lipid levels and abdominal obe-sity index, and so contribute to T2DM. Hence, different studies have described conflicting results: some studies found a negative association betweenUCPgenes and obe-sity, while others found a positive association or none at all (Astrupet al., 1999; Esterbaueret al., 2001; Xuet al., 2011;
Qin et al., 2013). The UCP2 -866GA (rs659366) polymorphism has been associated with prevalence of obe-sity (Pedersenet al., 2005), and decreased or increased risk of T2DM (Bulottaet al., 2005; Cheurfaet al., 2008). In our study, this polymorphism was associated with high BMI and increased risk of T2DM.
In a meta-analysis, Qinet al.(2013) documented that
UCP2 A55V (rs660339) and UCP3 -55C/T (rs1800849) polymorphisms were associated with T2DM susceptibility in Asian populations, whereasUCP2 -866G/A(rs659366) was linked to obesity in the European, but not the Asian population. Further, theUCP2 -55 T(rs660339) allele has been associated with greater energy expenditure, T2DM and cardiovascular risk, theUCP2 -866 A(rs659366) allele has been associated with obesity and increased cardiovas-cular risk and T2DM in obese individuals, meanwhile, the
UCP3 T(rs1800849) allele was linked to BMI, and reduced energy expenditure (Buemann et al., 2001; Reis et al., 2004; Gableet al., 2006).
In the present study, theUCP2 andUCP3 variants were associated with an increase in visceral fat and an in-creased risk of pCAD. A possible explanation is thatUCP
variants attenuate mRNA levels which leads to a dimin-ished fat oxidation, consequently, this augments the risk of pCAD. Further investigation is merited to assess the mRNA levels and the oxidation patients with pCAD in the context ofUCP2andUCP3variants.
Many studies have established that the effect of the genetic polymorphisms onUCP2andUCP3vary depend-ing on physical activity and lifestyle (Berentzen et al., 2005; Holdyset al., 2013; Groneket al., 2013). Specifi-Table 5- Association ofUCPpolymorphisms with cardiovascular risk factors.
UCP2 A55V UCP2 -866 UCP3 -55C/T
Model Pc OR 95%CI Pc OR 95%CI Pc OR 95%CI
BMI >30 kg/cm2 Recessive 0.003 1.64 1.30-2.06 0.063 1.87 1.18-2.45 0.540 2.50 0.42-12.7 6
Additive 0.001 1.44 1.15-1.80 0.030 1.45 1.16-1.81 0.197 1.60 0.88-2.09
HT >140 mmHg Recessive 0.069 1.84 0.99-3.42 0.221 2.03 1.05-3.93 0.007 6.53 5.16-8.27
Additive 0.052 1.33 1.00-1.77 0.049 1.72 1.23-2.41 0.011 6.55 5.21-8.31
Hypercholesterolemia > 160 mg/dL Recessive 0.051 0.23 0.15-0.36 0.006 3.41 2.22-5.26 0.007 2.53 1.92-3.44
Additive 0.062 0.22 0.18-0.28 0.038 1.65 1.26-2.17 0.011 2.56 1.95-3.49
LDL-C >130 mg/dL Recessive 0.070 0.23 0.14-0.37 0.096 1.96 1.22-3.16 0.618 2.00 0.42-9.51 Additive 0.015 3.01 2.40-3.78 0.030 0.14 0.10-0.19 0.236 3.03 1.94-4.63
Hypertriglyceridemia >150 mg/dL Recessive 0.066 0.57 0.39-0.84 0.151 2.63 1.76-3.92 0.006 1.99 1.61-2.53
Additive 0.059 0.53 0.44-0.65 0.100 2.20 1.81-2.67 0.010 2.01 1.69-2.62
Hypoalphalipoproteinemia < 40 mg/dL Recessive 0.168 1.56 1.07-2.26 0.910 1.04 0.71-1.52 0.862 1.37 0.38-4.86 Additive 0.054 1.33 1.11-1.60 0.296 0.90 0.75-1.08 0.984 1.01 0.72-1.42
T2DM Recessive 0.086 2.08 1.22-3.52 0.001 2.72 1.64-4.50 0.007 2.26 1.70-3.01
Additive 0.050 2.09 1.63-2.69 < 0.001 2.85 1.74-4.65 0.011 2.30 1.74-3.06
cally, in the present study, the analyses were adjusted for confounders, such as gender, age, smoking habit, and phys-ical activity.
In conclusion, our study revealed there is a direct rela-tionship between visceral and abdominal fat accumulation depending onUCPpolymorphisms, which seem to be re-lated to BMI, high levels of cholesterol, triglycerides and T2DM in pCAD patients.
References
Argiles JM, Busquets S and Lopez-Soriano FJ (2002) The role of uncoupling proteins in pathophysiological states. Biochem Biophys Res Commun 293:1145-1152.
Astrup A, Toubro S, Dalgaard LT, Urhammer SA, Sorensen TI and Pedersen O (1999) Impact of the V/V 55 polymorphism of the uncoupling protein 2 gene on 24-h energy expenditure and substrate oxidation. Int J Obes Relat Metab Disord 23:1030-1034.
Berentzen T, Dalgaard LT, Petersen O and Sorensen TI (2005) In-teraction between physical activity and variants of the genes encoding uncoupling proteins -2 and -3 in relation to body weight changes during a 10-y follow-up. J Obes 29:93-99. Blanc J, Alves-Guerra MC, Esposito B, Rousset S, Gourdy P,
Ricquier D, Tedqui A, Miroux B and Mallat Z (2003) Pro-tective role of uncoupling protein 2 in atherosclerosis. Cir-culation 107:388-390.
Boss O, Samec S, Dulloo A, Seydoux J, Muzzin P and Giacobino JP (1997) Tissue-dependent upregulation of rat uncoupling protein-2 expression in response to fasting or cold. FEBS Lett 412:111-114.
Brondani LA, Assmann TS, Duarte GCK, Gross JL, Canani LH and Crispim D (2012) The role of the uncoupling protein 1 (UCP1) on the development of obesity and type 2 diabetes mellitus. Arq Bras Endocrinol Metabol 56: 215-225. Brondani LA, Assmann TS, de Souza BM, Bouas AP, Canani LH
and Crispim D (2014) Meta-analysis reveals the association of common variants in the uncoupling protein (UCP) 1-3 genes with body mass index variability. PLoS One 9:e96411.
Buemann B, Schierning B, Toubro S, Bibby BM, SØrensen T, Dalgaard L, Pedersen O and Astrup A (2001) The associa-tion between the val/ala-55 polymorphism of the uncoupling protein 2 gene and exercise efficiency. Int J Obes Relat Metab Disord 25:467-471.
Bulotta A, Ludovico O, Coco A, Di Paola R, Quattrone A, Carella M, Pellegrini F, Prudente S, and Trischitta V (2005) The common -866G>A variant in the promoter region of the UCP2 gene is associated with risk of type 2 diabetes in Cau-casians from Italy. J Endocinol Metab 90:1176-1180. Cassel PG, Saker PJ, Huxtable SJ, Kosuta E, Jackson AE,
Hat-tersley AT, Frayling TM, Walker M, Kopelman M, Rama-chamdran A,et al.(2000) Evidence that the single nucleo-tide polymorphism in the uncoupling protein 3 (UCP3) gene influences fat distribution in women European and Asian or-igin. Diabetologia 43:1558-1564.
Center for Disease Control and Prevention (2010) Prevalence of abnormal lipid levels among youth. United States, 1999-2006. MMWR Morb Mortal Wkly Rep 59:78.
Cha MH, Kim IC, Kim KS, Kang BK, Choi SM and Yoon Y (2007) Association UCP2 and UCP3 gene polymorphisms
with serum high density lipoprotein cholesterol among Ko-rean women. Metabolism 56:806-813.
Cheurfa N, Dubois-Laforgue D, Ferrarezi DA, Reis AF, Brenner GM, Bouche C, Le Fauvre C, Fumeron F, Timsit J, Marre M, et al.(2008) The common -866G > A variant in the promoter of UCP2 is associated with decreased risk of coronary artery disease in type 2 diabetic men. Diabetes 57:1063-1068. De Souza BM, Assmann TS, Kliemann LM, Gross JL, Canani LH
and Crispim D (2011) The role of uncoupling protein 2 (UCP2) on the development of type 2 diabetes mellitus and its chronic complications. Arq Bras Endocrinol Metabol 55:239-248.
De Souza BM, Brondani LA, Bouas AP, Sortica DA, Kramer CK, Canani LH, Leitao CB, and Crispim D (2013) Associations between UCP1 -3826A/G, UCP2 -866G/A, Ala55Val and Ins/Del and UCP3 -55C/T polymorphisms and susceptibility to type 2 diabetes mellitus: case-control study and meta-analysis. PLoS One 8:e54259.
De Long DM, De Long ER, Wood PD, Lippel K and Rifkind BM (1986) A comparison of methods for the estimation of plas-ma low- and very low-density lipoprotein cholesterol. The Lipid Research Clinics Prevalence Study. JAMA 256:2372-2377.
Dhamrait SS, Stephens JW, Cooper JA, Acharya J, Mani AR, Moore K, Miller GJ, Humphries SE, Hurel SJ and Mont-gomery HE (2004) Cardiovascular risk in healthy men and markers of oxidative stress in diabetic men are associated with common variation in the gene for uncoupling protein 2. Eur Heart J 25:468-475.
Esterbauer H, Schneitler C, Oberkofler H, Ebenbichler C, Pualweber B, Sandhofer F, Ladurner G, Hell E, Strosberg AD, Patsch JR,et al.(2001) A common polymorphism in the promoter In UCP2 is associated with deceased risk of obesity in middle age humans. Nat Genet 28:178-183. Fleury C, Neverova M, Collins S, Raimbault S, Champigny O,
Levi-Meyrueis C, Bouillaud F, Seldin MF, Sirwit RS, Ric-quier RS,et al.(1997) Uncoupling protein-2: a novel gene linked to obesity and hyperinsulinemia. Nat Genet 15:269-272.
Gable DR, Stephens JW, Cooper JA, Miller GJ, and Humphries SE (2006) Variation in the UCP2-UCP3 gene cluster pre-dicts the development of type 2 diabetes in healthy middle age men. Diabetes 55:1504-1511.
Gioli-Pereira L, Santos PC, Sugaya LS, Ferreira NE, Krieger JE, Pereira AC and Hueb WA (2013) Association between UCP2 A55V polymorphism and risk of cardiovascular events in patients with multi-vessel coronary arterial dis-ease. BMC Med Genet 14:40.
Gronek P and Holdys J (2013) Genes and physical fitness. Trends Sport Sci 20:16-29.
Herrmann SM, Wang JG, Staessen JA, Kertmenn E, Schmidt-Petersen K, Zidek W, Paul M and Brand E (2003) Uncou-pling protein 1 and 3 polymorphisms are associated with waist to hip ratio. J Mol Med 81:327-332.
Holdys J, Gronek P, Krysciak J, and Stanislawski D (2013) Ge-netic variants of uncoupling proteins-2 and-3 in relation to maximal oxygen uptake in different sports. Acta Biochim Pol 60:71-75.
Jia JJ, Tian YB, Cao ZH, Tao LL, Zhang X, Gao SZ, Ge CR, Lin QY and Jois M (2010) The polymorphisms of UCP1 genes associated with fat metabolism, obesity and diabetes. Mol Biol Rep 37:1513-1522.
Kil SK, Dae-Yeon C, Young JK, Sun MC, Jong YK, Seung US and Yoo SK (2005) The finding of new genetic polymor-phism of UCP-1 A-1766G and its effects on body fat accu-mulation. Biochim Biophys Acta 1741:149-155.
Kvist H, Chowdhury B, Grangrd U, Tylén U and Sjstrm L (1988) Total and visceral adipose-tissue volumes derived from measurements with computed tomography in adult men and women: predictive equations. Am J Clin Nutr 48:1351-1361.
Ledesma A, Garcia de Lacoba M and Rial E (2002) Protein family review. The mitochondrial uncoupling proteins. Genome Biol 3015:1-9.
Longo R, Ricci C, Masutti F, Vidimari R, Crocé LS, Bercich L, Tiribelli C and Dalla PL (1993) Fatty infiltration of the liver. Quantification by IH localized magnetic resonance spectros-copy and comparison with computed tomography. Invest Radiol 28:297-302.
Makedou KG, Mikhaidilis DP, Makedou A, Illiadis S, Kourtis A, Vavatsi-Christaki N and Papageorgiou GE (2009) Lipid pro-file, low density lipoprotein oxidation and ceruloplasmin in the progeny of families with positive history of cardiovascu-lar diseases and/or hyperlipidemia. Angiology 4:455-461. Mautner GC, Mautner SL, Froehlich J, Feuerstein IM, Proschan
MA, Roberts WC and Doppman JL. (1994) Coronary artery calcification: assessment with electron beam CT and histo-morphometric correlation. Radiology 192:619-623. McLeod CJ, Aziz A, Hoyt Jr RF, McCoy Jr JP and Sack MN
(2005) Uncoupling proteins 2 and 3 function in concert to augment tolerance to cardiac ischemia. J Biol Chem 280:33470-33476.
Muzzio F, Mondazzi U, Sommariva D and Branchi A (2005) Long term effects of low calorie diet on the metabolic syn-drome in obese nondiabetic patients. Diabetes Care 28:1485-1486.
Norhammar A, Tenerz A, Nilsson G, Hamsten A, Efendic S, Ryden L and Malmberg K (2002) Glucose metabolism in patients with acute myocardial infarction and no previous diagnosis of diabetes mellitus: a prospective study. Lancet 359:2140-2144.
Oberkofler H, Iglseder B, Klein K, Unger J, Haltmayer M, Krem-pler F, Paulweber B and Patsch W (2005) Associations of the UCP2 gene locus with asymptomatic carotid atheroscle-rosis in middle-aged women. Arterioscler Thromb Vasc Biol 25:604-610.
Oktavianthi S, Trimarsanto H, Febinia CA, Saustika MR, Saras-wati MR, Dwipayana P, Arindrarto W, Sudoyo H and Malik SG (2012) Uncoupling protein 2 polymorphisms are associ-ated with obesity. Cardiovasc Diabetol 11:41.
Pedersen SB, Nyholm B, Kristensen K, Nielsen MF, Schmitz O and Richelsen B (2005) Increased adiposity and reduced
ad-ipose tissue mRNA expression of uncoupling protein-2 in first-degree relatives of type 2 diabetic patients: evidence for insulin stimulation of UCP-2 and UCP-3 gene expression in adipose tissue. Diabetes Obes Metab 7:98-105.
Pischon T (2009) Use of biomarkers in cardiovascular epidemiol-ogy. Dis Markers 26:247-263.
Qin LJ, Wen J, Qu YL and Huang QY (2013) Lack of association of functional UCP2 -866G/A and Ala55Val polymorphisms and type 2 diabetes in the Chinese population based on a case-control study and a meta-analysis. Genet Mol Res 12:3324-3334.
Reis AF, Dubois-Laforgue D, Bellane-Chantelot C, Timsit J and Vehlo G (2004) A polymorphisms in the promoter UCP2 gene modulates lipid levels in patients with diabetes mellitus type 2. Mol Genet Metab 82:339-344.
Salopuro T, Pulkkinen L, Lindstrm J, Kolehmainen M, Tolppanen AM, Eriksson JG, Valle TT, Aunola S, llane-Parikka S, Keinanen-Kiukaanniemi S, et al. (2009) Variation in the UCP2 and UCP3 genes associates with abdominal obesity and serum lipids: the Finnish Diabetes Prevention Study. BMC Med Genet 10:94.
Schrauwen P and Hesselink M (2002) UCP2 and UCP3 in muscle controlling body metabolism. J Exp Biol 205:2275-2285. Surwit RS, Wang S, Petro AE, Sanchis D, Raimbault S, Ricquier
D and Collins S (1998) Diet-induced changes in uncoupling proteins in obesity-prone and obesity-resistant strains of mice. Proc Natl Acad Sci U S A 95:4061-4065.
Teshima Y, Akao M, Jones SP and Marban E (2003) Uncoupling protein-2 overexpression inhibits mitochondrial death path-way in cardiomyocytes. Circ Res 93:192D200.
Vasan RS (2003) Cardiac function and obesity. Heart 89:1127-1129.
Villarreal-Molina T, Posadas-Romero C, Romero-Hidalgo S, Antnez-Arguelles E, Bautista-Grande A, Vargas-Alarcón G, Kimura-Hamaya E, Canizales-Quinteros S, Juarez-Rojas JG, Posadas-Sánchez R, et al. (2012) The ABCA1 gene R230C variant is associated with decreased risk of prema-ture coronary artery disease: The genetics of atherosclerosis disease (GEA) study. Plos One 7:e49285.
Xu K, Zhang M, Cui D, Fu Y, Qian L, Gu R, Wang M, Shen C, Yu R and Yang T (2011) UCP2 -866G/A and Ala55Val, and UCP3 -55C/T polymorphisms in association with type 2 dia-betes susceptibility: a meta-analysis study. Diabetologia 54:2315-2324.
Zamboni M, Mazzali G, Zoico E, Harris TB, Meigs JB, Di FV, Fantin F, Bissoli L and Bosello O (2005) Health conse-quences obesity in the elderly: A review of four unresolved questions. Int J Obes 29:1011-1029.
Associate Editor: Maria Angélica Cortez