2018 | Lavras | Editora UFLA | www.editora.ufla.br | www.scielo.br/cagro
Heuristic methods applied in reference evapotranspiration modeling
Métodos heurísticos na modelagem da evapotranspiração de referência
Daniel Althoff1*, Helizani Couto Bazame1, Roberto Filgueiras1, Santos Henrique Brant Dias2
1Universidade Federal de Viçosa/UFV, Departamento de Engenharia Agrícola, Viçosa, MG, Brasil
2Universidade Estadual de Ponta Grossa/UEPG, Departamento de Engenharia Agrícola, Ponta Grossa, PR, Brasil *Corresponding author: [email protected]
Received in March 16, 2018 and approved in June 21, 2018
ABSTRACT
The importance of the precise estimation of evapotranspiration is directly related to sustainable water usage. Since agriculture represents 70% of Brazil’s water consumption, adequate and efficient application of water may reduce the conflicts over the use of water among the multiple users. Considering the importance of accurate estimation of evapotranspiration, the objective of the present study was to model and compare the reference evapotranspiration from different heuristic methodologies. The standard Penman-Monteith method was used as reference for evapotranspiration, however, to evaluate the heuristic methodologies with scarce data, two widely known methods had their performances assessed in relation to Penman-Monteith. The methods used to estimate evapotranspiration from scarce data were Priestley-Taylor and Thornthwaite. The computational techniques Stepwise Regression (SWR), Random Forest (RF), Cubist (CB), Bayesian Regularized Neural Network (BRNN) and Support Vector Machines (SVM) were used to estimate evapotranspiration with scarce and full meteorological data. The results show the robustness of the heuristic methods in the prediction of the evapotranspiration. The performance criteria of machine learning methods for full weather data varied from 0.14 to 0.22 mm d-1 for mean absolute error (MAE), from 0.21 to 0.29 mm d-1
for root mean squared error (RMSE) and from 0.95 to 0.99 coefficient of determination (r²). The computational techniques proved superior performance to established methods in literature, even in scenarios of scarce variables. The BRNN presented the best performance overall.
Index terms: Machine learning; model comparison; water management.
RESUMO
A importância da estimativa precisa da evapotranspiração está diretamente relacionada ao uso sustentável da água. Uma vez que a agricultura representa 70% do consumo de água no Brasil, a aplicação adequada e eficiente de água reduz os conflitos sobre o uso da água entre os múltiplos usuários. Considerando a importância de uma estimativa precisa da evapotranspiração, o objetivo do presente estudo foi modelar e comparar a evapotranspiração de referência a partir de diferentes metodologias heurísticas. O método padrão Penman-Monteith foi utilizado como referência para evapotranspiração, porém, para avaliar as metodologias heurísticas com dados escassos, avaliou-se o desempenho de métodos difundidos na literatura em relação à Penman-Monteith. Os métodos utilizados para estimar a evapotranspiração a partir de dados escassos foram Priestley-Taylor, Thornthwaite. As técnicas computacionais Regressão Stepwise (SWR), Random Forest (RF), Cubist (CB), Rede Neural com Regularização Bayesiana (BRNN) e Máquinas de Vetor de Suporte (SVM) foram utilizados para estimar a evapotranspiração, tanto com dados meteorológicos escassos, quanto com dados completos. Os resultados mostram a robustez dos métodos de aprendizagem de máquina na predição da evapotranspiração. Os critérios de desempenho desses métodos para dados meteorológicos completos variaram de 0,14 a 0,22 mm d-1 para erro absoluto médio (MAE),
de 0,21 a 0,29 mm d-1 para raiz do erro quadrático médio (RMSE) e de 0,95 a 0,99 para o coeficiente de determinação (r²). As técnicas
computacionais mostraram desempenho superior em todos os cenários em relação aos métodos estabelecidos na literatura. A BRNN apresentou o melhor desempenho geral.
Termos para indexação: Aprendizado de máquina; comparação de modelos; gerenciamento de recursos hídricos.
INTRODUCTION
Evapotranspiration is a fundamental parameter in comprehending Earth’s hydrological cycle, as well as agricultural crops’ water demand (French; Hunsaker; Thorp, 2015; Zhang; Kimball; Running, 2016). Since agriculture is one of the bases of Brazil’s economy, the determination of evapotranspiration has great relevance in decision-making, especially for irrigation
management. In this context, the evapotranspiration reflects directly on the calculations of crop’s daily demand (Feng et al., 2017a; Guermazi; Bouaziz; Zairi, 2016; Toureiro et al., 2017).
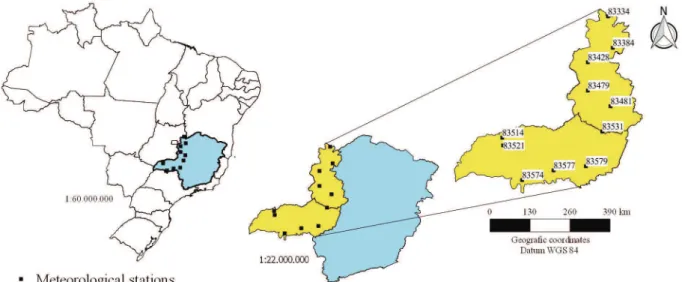
Figure 1: Localization of area of study and meteorological stations.
the conflict over water resources in many regions, such as the Brazilian Cerrado, has increased with the expansion of irrigated areas (Maneta et al., 2009). Taking in consideration a specific volume of water, an adequate and efficient application of water quantities allows the attendance of larger irrigated areas, reducing the conflicts over the use of water among the multiple users (Abdullah et al., 2015; Karimi; Bastiaanssen, 2015; Khanal; Fulton; Shearer, 2017).
The economical point of view should also be noted, for an example, if one chooses to apply a larger amount of water than necessary, not only will the expenses with electric energy be greater, but there may be losses related to soil erosion and leaching of soil nutrients, which leads to eutrophication of water bodies (Reddy; Cunha; Kurian, 2018). On the other hand, when a quantity smaller than demanded by the crop is applied, these may present a decrease in productivity, resulting in a lower profitability of the agribusiness.
According to the Food and Agriculture Organization (FAO), the standard method for the determination of reference evapotranspiration (ETo) is the Penman-Monteith methodology (Allen et al., 1998). However, this methodology requires a wide range of climatic variables measured at site, such as temperature (maximum, average and minimum), solar radiation, wind speed and relative humidity, variables that aren’t readily available for many regions (Abdullah et al., 2015; Feng et al., 2017a). This fact makes it relevant to investigate more parsimonious and efficient possibilities for the estimation of reference evapotranspiration.
Heuristic methods, also known as machine learning or pattern recognition algorithms, have presented promising results in the modeling of meteorological parameters (Adnan; Latif; Nazir, 2017; Feng et al., 2017b; Yao et al., 2017; Zhou et al., 2017). These authors have, for other regions, estimated evapotranspiration from the same meteorological data required by the Penman-Monteith, as well as from scarce data. Methods such as neural networks, regression trees, support vector machines and many others present, for the most part, a heuristic characteristic coupled with a high ability to generalize and model patterns (Wang et al., 2017b, 2017c).
Considering the importance of accurate estimation of evapotranspiration for the region and the high generalization capacity of machine learning algorithms, the objective of the present study was to model and compare the reference evapotranspiration from different heuristic methodologies, using as reference the standard Penman-Monteith equation.
MATERIAL AND METHODS
Study area
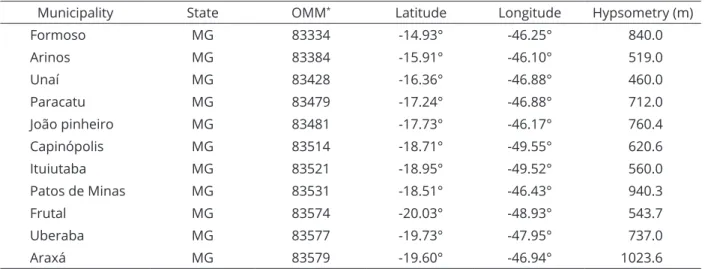
Table 1: Meteorological stations, geographic coordinates and altitude.
Municipality State OMM* Latitude Longitude Hypsometry (m)
Formoso MG 83334 -14.93° -46.25° 840.0
Arinos MG 83384 -15.91° -46.10° 519.0
Unaí MG 83428 -16.36° -46.88° 460.0
Paracatu MG 83479 -17.24° -46.88° 712.0
João pinheiro MG 83481 -17.73° -46.17° 760.4
Capinópolis MG 83514 -18.71° -49.55° 620.6
Ituiutaba MG 83521 -18.95° -49.52° 560.0
Patos de Minas MG 83531 -18.51° -46.43° 940.3
Frutal MG 83574 -20.03° -48.93° 543.7
Uberaba MG 83577 -19.73° -47.95° 737.0
Araxá MG 83579 -19.60° -46.94° 1023.6
* Denomination of the meteorological station according to the world meteorological organization.
900
0.408( ) ( )
(1 0.34 )
n s a
avg
R G Ws e e
T ETo
Ws
(1)
The Noroeste de Minas and Triângulo Mineiro/ Alto Paranaíba are similar mesoregions in their extensive plateau in regions of savannah, which facilitates the planting and use of agricultural machinery. For these reasons, medium and large sized entrepreneurs have widely explored the region while developing local agriculture with extensive use of technology (Bastos; Gomes, 2010).
The mesoregions have a characteristic climate of the Brazilian Cerrado, with annual rainfall varying from 1000 to 1400 mm, and presenting two well defined seasons, where 80 to 90% of the annual rainfall predominates during the rainy season (Mello et al., 2007). During the dry season, the water scarcity strongly affects the region, whereas the production of the second harvest is only possible through intensive use of irrigation.
Data
For the development of the study, daily data were used referring to 11 meteorological stations spaced in the study area (Figure 1). The adopted study period was between 1987 and 2016, summing 30 years of climatological information. The data were obtained from the Meteorological Database for Teaching and Research (BDMEP), a database of the National Institute of Meteorology (INMET) of Brazil. The stations are located in the mesoregions of the Triângulo Mineiro/ Alto Paranaíba and Noroeste de Minas. The information concerning the geographic coordinates, referenced in the Datum WGS-84, and hypsometry of each station are presented in Table 1.
The data provided by the meteorological stations, which were used in the present research are: average (Tavg, °C), maximum (Tmax, °C) and minimum air temperature (Tmin, °C); relative humidity (RH, %); solar radiation (SR, MJ m-2 d-1); and, wind speed (Ws, m s-1).
Reference evapotranspiration
T h e r e f e r e n c e e v a p o t r a n s p i r a t i o n i s t h e evapotranspiration referring to a hypothetical crop that completely covers the soil, is in active growth, does not present water and nutritional restriction, and presents specific characteristics such as albedo equal to 0.23 and height between 8 and 15 cm (Allen et al., 1998). Among the various methods of ETo estimation, the Penman-Monteith (Equation 1), presented by the FAO, is recommended as the standard (Torres; Walker; McKee, 2011):
where: ETo = reference evapotranspiraton by Penman Monteith, mm d-1; R
n = net radiation, MJ m
-2 d-1; G = soil heat flux, MJ m-2 d-1; T
avg = mean air temperature, °C; Ws = wind speed at 2 m height, m s-1; e
n
ETpt R G (2)
7 3 5 2 2
6.75 10 7.71 10 1.79 10 0.49
10 10
1, 6
I I I
Ta ETtw I d
(3)
0 1. 1 ... n. n
ETo X X (4)
1 1 n
i i i
MAE P O
n
(5)
(6)
21 1 n
i i i
RMSE P O
n
In order to evaluate the performance of machine learning methods using scarce meteorological data, the methodologies adopted in this research were the Priestley-Taylor (Priestley; Priestley-Taylor, 1972) and Thornthwaite (Thornthwaite, 1948) (Equations 2 and 3):
where: ETpt = reference evapotranspiration by Priestley-Taylor, mm d-1; and, α = empirical coefficient equivalent to 1.26.
in which: ETtw = reference evapotranspiration by Thornthwaite, mm month-1; d = days in a month; Ta = monthly mean temperature, °C; and, I = annual heat index.
Modeling strategies
Stepwise Regression
One of the difficulties when working with linear regressions is selecting the predictors to be employed in the model. The Stepwise Regression (SWR) is a numerical modeling that may be applied by computational techniques, in which the independent variables are repeatedly removed and added to the multiple linear regressions in order to verify which equation will adapt and perform the best (Abraham et al., 2017). The final model is shown in Equation 4:
where: β0 = linear regression gain; β1...βn = offsets for every independent variable; X1...Xn = independent variables.
Random Forest
Random Forest (RF) is a machine learning method capable of performing both classification and regression procedures. A large number of regressions trees are created each from a “Bootstrap” sampling of the original dataset (Breiman, 2001). As an inherent characteristic of machine learning methods are the ability to solve complex interactions between predictor variables, even when they present high collinearity (Brokamp et al., 2017). In the case of regressions, the final prediction is performed through the means between the predictions of each tree (Rahman et al., 2016).
Cubist Regression
The Cubist regression (CB) is also based in regression trees. At the end of the model are generated several rules, where each rule is associated with a linear model. The model has the characteristic of being based on multiple regression models, making the final product the average of these. Although the prediction is made based on a multiple linear regression, the result is smoothed by the means of the predictions realized in previous knots of the tree (Im et al., 2012).
Bayesian Regularized Neural Network
The neural network is formed by simple elements operating in parallel. Inspired by a biological neural network, the neural network receives its independent neurons in its input. The variables are passed to subsequent layers of neurons, where, passing through a transfer function, the weighted sum of input values are calculated, providing an output for the neuron in analysis (Wang et al., 2017a). The bayesian regularized neural networks (BRNN) are more robust than the networks that use the back propagation of the errors, besides avoiding the over-fitting of the model (Ticknor, 2013).
Support Vector Machines
Support vector machines (SVMs) are considered as supervised learning methods, which can be used both to classify a set of samples and to regress them. When a dataset is submitted to SVM analysis, they separate the data by constructing hyperplanes, aiming at the implantation of surfaces with the greatest possible margin between the datasets considered as different (Wang et al., 2017a). The larger the margin of the hyperplane, the greater is the generalization capacity of the model created to predict or classify the data set.
Performance criteria
(7)
2 1
2
2
1 1
n
i i i i i
n n
i i i i i i
P P O O
r
P P O O
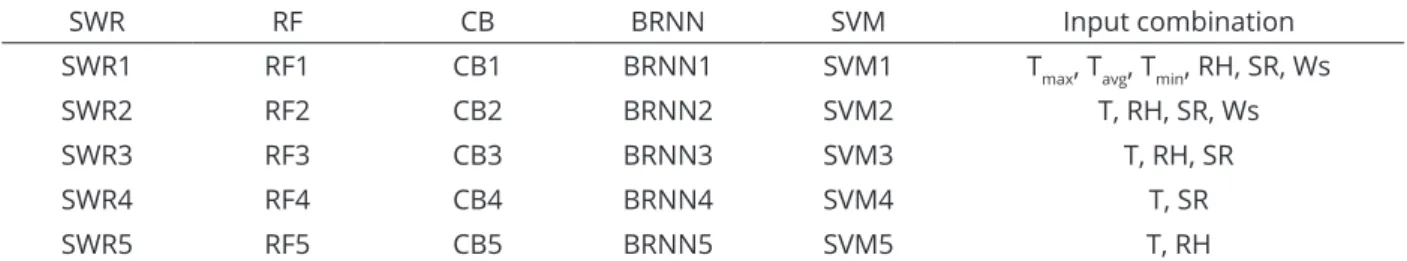
Table 2: Combinations of input variables for each artificial intelligence method.
SWR RF CB BRNN SVM Input combination
SWR1 RF1 CB1 BRNN1 SVM1 Tmax, Tavg, Tmin, RH, SR, Ws
SWR2 RF2 CB2 BRNN2 SVM2 T, RH, SR, Ws
SWR3 RF3 CB3 BRNN3 SVM3 T, RH, SR
SWR4 RF4 CB4 BRNN4 SVM4 T, SR
SWR5 RF5 CB5 BRNN5 SVM5 T, RH
RF: Random Forest; CB: cubist; BRNN: Bayesian Regularized Neural Network; SVM: Support Vector Machine; SWR: Stepwise Regression.
Table 3: Statistical parameters for the daily data set.
Xmean Xmax Xmin Sx Cv Cx R
Tmax 31.00 42.50 9.00 3.21 0.10 -0.32 0.71
Tavg 24.82 33.85 7.50 2.75 0.11 -0.43 0.67
Tmin 18.64 28.70 -2.00 3.14 0.17 -0.81 0.45
SR 18.95 33.00 6.00 4.40 0.23 -0.12 0.84
RH 66.48 100.00 17.30 14.47 0.22 -0.17 -0.52
Ws 1.82 10.30 0.00 1.19 0.65 1.14 0.54
ETo 4.15 10.10 0.80 1.30 0.31 0.79 1.00
in which: Oi = observed evapotranspiration data of order i; and, Pi = simulated evapotranspiration of order i. The Penman-Monteith ETo will be used as reference for observed values.
The absolute mean error indicates the mean amplitude of the errors, whereas the root of the mean squared error adds a greater weight to the errors of greater magnitude, being important for highlighting possible outliers. The coefficient of determination indicates how much the generated model explains the observed variable.
Models validation
For heuristic methods, datasets are commonly divided in proportions such as 70-30 or 80-20 for training and test sets. However, the ideal ratio isn’t a consensus. For this reason, the data set was initially randomly divided into a training set containing only 1% of the data, which was gradually increased in order to verify how much longer the models would take to train and if performance improvement was significant. The training set was used to
train and obtain optimal tuning parameters for each model, after that, a repeated k-fold cross validation was performed, where k = 10, and the number of repetitions = 10. The models were then used to predict the ETo for the test set.
Input combination scenarios
To evaluate the performance of the methods based on machine learning, five scenarios were simulated by different input combinations of variables for the models. The combinations used in this study are presented in Table 2, where, as can be seen, the numbers in front of each method indicate the input combination. For the scenarios “2” through “5”, with the intention to reduce possible collinearity effects, only the temperature variable with highest correlation to ETo (T) was used.
RESULTS AND DISCUSSION
Data analysis
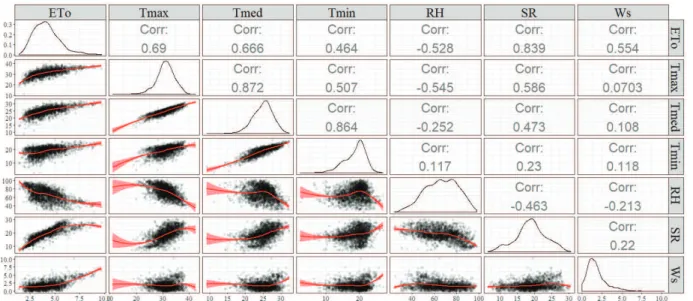
Figure 2: Correlation and interaction between climatic variables for the training phase.
MJ m-2, ranging from 6.00 to 33.00 MJ m-2 throughout the study period. Along with SR, the Tmax and Tavg showed greater correlation to ETo than Ws, RH and Tmin. The temperature variables showed overall low coefficient of variation. In Figure 2 it is possible to verify the behavior of the variables in relation to ETo as well as among themselves for the training phase. Besides asymmetry, the kurtosis may also be observed in the diagonal plot of Figure 2.
Although presenting high correlation among themselves, the maximum, mean and average temperature were kept for the computational modeling of the scenario “1”. This was done in the expectation that they could increase the explanatory power of these methods, given that machine learning methods are known to present high capacity of finding patterns in the data, even if they have high collinearity. For the remaining scenarios, only the Tmax was used, due to its higher correlation to ETo (Table 3).
Thornthwaite and Priestley-Taylor methods
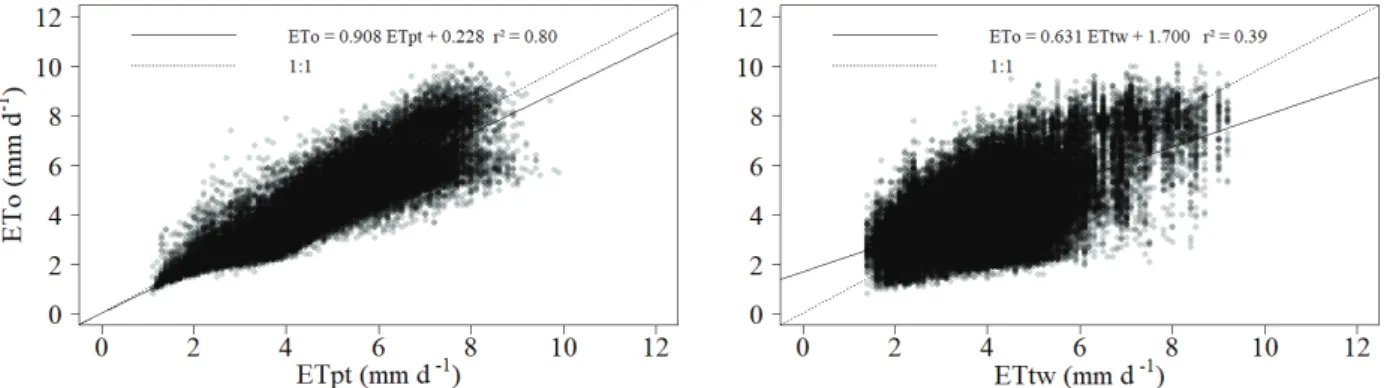
The Priestley-Taylor method presented superior performance over the Thornthwaite method (Table 4). This was expected because the Thornthwaite is a monthly evapotranspiration method based solely on the average air temperature, while the Priestley-Taylor method takes in account the solar radiation, the climatic variable of highest correlation to ETo in the region (Table 3). The Priestley-Taylor method presented MAE and RMSE of 0.58 and 0.80 mm d-1, respectively, about 38% lower than the errors obtained through the Thornthwaite method.
The Priestley-Taylor method showed a greater efficiency than the Thornthwaite method, which
corresponds to the lower data dispersion and is represented by the coefficient of determination (Figure 3). The Priestley-Taylor was more effective as well, as its fit line is closer to the ideal (1:1).
Heuristic methods
The size of training set was gradually increased during training phase. However, by the time the training set was composed by 20% of the original dataset, the time required to train the models had increased over 20 times while little performance enhancement was observed. Using 20% of dataset as training set improved MAE and RMSE by only 0.01 to 0.02 mm d-1. For these reasons and because the performance was already judged satisfactory, further analysis and discussion were based on the training set composed by 1% of full dataset.
Table 4: Performance criteria of the Priestley-Taylor and Thornthwaite models in relation to Penman-Monteith.
MAE RMSE r²
Priestley-Taylor 0.58 0.71 0.80
Thornthwaite 0.93 1.15 0.39
MAE is in mm per day; RMSE is in mm per day; r² is dimensionless.
Figure 3: Comparison between the reference evapotranspiration estimated by the Priestley-Taylor and Thornthwaite methods in relation to the Penman-Monteith method.
The validation and testing performance of the SWR, RF, CB, BRNN and SVM methods for predicting ETo are presented in Table 5. The methods based on all available data (input combination “1”) presented higher accuracy (Table 5). The methods using only Tmax, RH, SR e Ws still presented high performance in the estimation of ETo, with r² varying between 0.93 and 0.98. The best performing methods, from best to worst, were BRNN, CB, RF, SWR and SVM. In addition, the training time of the models for the methods was considered (machine cost), which is highly dependent on the computer processor speed and number of cores available. Although providing the third best prediction performance, the RF method presented the highest machine cost, taking up to 10 times longer to train its models when compared to the CB and BRNN models. The methods with lowest machine cost were the SVM and SWR; on the other hand, these methods had lower performance when compared to the others.
Gocić et al. (2015) estimated the reference evapotranspiration in Serbia using heuristic methods and obtained, at their best result, MAE and RMSE equal to 0.054 and 0.233 mm d-1, respectively. The values of MAE were lower than the findings of the present study; on the other hand its RMSE was higher, which may indicate that, although the models are more accurate, they are not as efficient.
When comparing the Priestley-Taylor method to the heuristic methods while using only temperature and
radiation as input, the mean MAE and RMSE obtained by the heuristic methods were 28% and 15% lower, respectively, which is given by the superiority of the methods based in patterns recognition over traditional methods. Using scarce data, the authors Shiri et al. (2014) estimated reference evapotranspiration for Iran using several methods, including SVM and artificial neural networks (ANN). While using temperature and radiation data as input for SVM and ANN methods, Shiri et al. (2014) obtained values of MAE ranging from 0.33 to 0.64 mm d-1, and RMSE ranging from 0.45 to 0.80 mm d-1, where the intermediate values referred to semi-arid regions, results similarly to the ones presented here.
It is important to highlight the robustness of the machine learning methods, since the validation performance presented better metrics than conventional equations diffused in the literature, such as the Priestley-Taylor and Thornthwaite equations. The way the training and test sets were divided shows the high generalization capacity of the applied methods, since 1% of the meteorological station data (training set) was able to explain all the rest of the data (test set - 99%). This indicates that even with a dataset composed of a few years, the models would still be able to obtain similar performance as presented here.
Table 5: Comparisons of the different methods in ETo prediction.
Validation Testing
MAE RMSE r² MAE RMSE r² Time
RF1 0.15 0.21 0.98 0.14 0.20 0.98 1071
RF2 0.18 0.23 0.97 0.18 0.23 0.97 564
RF3 0.35 0.51 0.85 0.37 0.54 0.83 343
RF4 0.42 0.59 0.80 0.43 0.57 0.78 199
RF5 0.71 0.93 0.50 0.71 0.86 0.50 182
CB1 0.11 0.14 0.99 0.11 0.14 0.99 99
CB2 0.14 0.19 0.98 0.14 0.19 0.98 76
CB3 0.35 0.51 0.85 0.37 0.53 0.83 60
CB4 0.40 0.56 0.81 0.41 0.58 0.80 48
CB5 0.68 0.88 0.55 0.67 0.86 0.56 48
BRNN1 0.11 0.14 0.99 0.11 0.14 0.99 87
BRNN2 0.15 0.19 0.98 0.15 0.20 0.98 73
BRNN3 0.37 0.53 0.84 0.38 0.54 0.83 57
BRNN4 0.40 0.56 0.82 0.41 0.57 0.81 55
BRNN5 0.68 0.88 0.55 0.67 0.86 0.56 54
SVM1 0.21 0.29 0.95 0.21 0.29 0.95 40
SVM2 0.26 0.34 0.93 0.27 0.35 0.93 39
SVM3 0.42 0.63 0.78 0.42 0.63 0.77 35
SVM4 0.42 0.62 0.79 0.43 0.64 0.77 34
SVM5 0.71 0.92 0.51 0.69 0.90 0.53 34
SWR1 0.21 0.29 0.95 0.22 0.29 0.95 23
SWR2 0.26 0.34 0.93 0.27 0.35 0.93 23
SWR3 0.44 0.62 0.78 0.44 0.62 0.78 23
SWR4 0.44 0.60 0.79 0.45 0.62 0.77 23
SWR5 0.71 0.92 0.51 0.69 0.89 0.53 23
RF: Random Forest; CB: cubist; BRNN: Bayesian Regularized Neural Network; SVM: Support Vector Machine; SWR: Stepwise Regression; MAE is in mm per day; RMSE is in mm per day; r² is dimensionless; Time is in seconds.
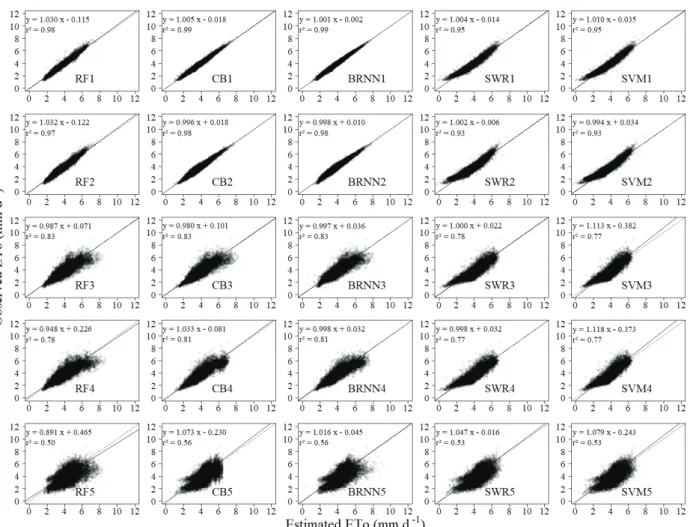
The input combinations “4” presented higher explanatory power over the input combination “5”, which was expected, since SR presented higher correlation to ETo than RH (Table 3). For this reason, the use of RH instead of SR influenced on a much more significant dispersion of the data for the scenario “5”. Thus, using only Tmax and RH in the daily estimate of evapotranspiration isn’t as efficient, though its performance is still superior to estimating average evapotranspiration monthly, as in the case of the Thornthwaite method.
Ciência e Agrotecnologia, 42(3):314-324, May/Jun. 2018
Figure 4: Comparison between the observed values and those estimated by the optimal models of the heuristic methods.
The ETo calculated by the Penman-Monteith method was adopted in this study as reference, though this method isn’t a direct measure of evapotranspiration. For this reason, the Penman-Monteith method also presents errors when compared to methods such as the lysimeter. In this context, the ideal approach would be fitting the models to evapotranspiration measured directly, where the methods could present even better results.
It is important to emphasize that for these regions, even though some meteorological stations are available, those are punctually acquired data, losing representativeness the farther the agricultural properties are. Therefore, the heuristic methodologies presented here open up the opportunity for irrigation managers to access precise estimations of evapotranspiration according to local data availability.
CONCLUSIONS
The present work evaluated and compared the performance of the pattern recognition methods RandomForest, Cubist, Bayesian Regularized Neural Networks, Support Vector Machines and Stepwise Regression in the estimation of ETo using the climatic variables maximum, average and minimum temperature, relative humidity, solar radiation and wind speed. The climatic data from 11 meteorological stations present in the mesoregions of the Triângulo Mineiro/Alto Paranaíba and Noroeste de Minas were used. In general, the heuristic methods presented better results when a greater number of variables were available. The results show the robustness of the methods in the prediction of the ETo, and, even in scenarios of scarce data, presented smaller errors than alternative methods established in the literature. The
Ciência e Agrotecnologia, 42(3):314-324, May/Jun. 2018
climatic variables that presented the highest correlations and explanatory power over the evapotranspiration phenomenon were solar radiation and temperature. To conclude, the Bayesian Regularized Neural Network model presented, for all combinations of data entry, the most accurate and precise results. The results can be applied within the water resource management field, mainly in aid to estimation of evapotranspiration for irrigation and water balance.
REFERENCES
ABDULLAH, S. S. et al. Extreme Learning Machines: A new approach for prediction of reference evapotranspiration.
Journal of Hydrology, 527:184-195, 2015.
ABRAHAM, S. et al. A robust and efficient stepwise
regression method for building sparse polynomial
chaos expansions. Journal of Computational Physics,
332:461-474, 2017.
ADNAN, M.; LATIF, M. A.; NAZIR, M. Estimating evapotranspiration using machine learning techniques. International journal
of Advanced Computer Science and Applications,
8(9):108-113, 2017.
ALLEN, R. G. et al. Crop evapotranspiration - Guidelines for computing crop water requirements - FAO Irrigation and drainage paper 56. 9. ed. Food and Agriculture
Organization of the United Nations, Rome: 1998. 300p.
BASTOS, S.; GOMES, J. E. Dinâmica da agricultura no estado de Minas Gerais: Análise diferencial-estrutural para o período 1994 a 2008. [s.l.] Cedeplar, Universidade Federal
de Minas Gerais, 2010. 22p.
BREIMAN, L. Random Forests. Machine Learning, 45(1):5-32,
2001.
BROKAMP, C. et al. Exposure assessment models for elemental
components of particulate matter in an urban environment:
A comparison of regression and random forest approaches.
Atmospheric Environment, 151:1-11, 2017.
DJAMAN, K. et al. Variability of the ratio of alfalfa to grass reference evapotranspiration under semiarid climate. Irrigation & Drainage Systems Engineering, 7(204):2, 2018.
FENG, Y. et al. Evaluation of random forests and generalized
regression neural networks for daily reference
evapotranspiration modelling. Agricultural Water Management, 193:163-173, 2017a.
FENG, Y. et al. Modeling reference evapotranspiration using
extreme learning machine and generalized regression
neural network only with temperature data. Computers and Electronics in Agriculture, 136:71-78, 2017b.
FRENCH, A. N.; HUNSAKER, D. J.; THORP, K. R. Remote sensing of evapotranspiration over cotton using the TSEB and METRIC energy balance models. Remote Sensing of Environment,
158:281-294, 2015.
GOCIĆ, M. et al. Soft computing approaches for forecasting reference evapotranspiration. Computers and Electronics in Agriculture, 113:164-173, 2015.
GUERMAZI, E.; BOUAZIZ, M.; ZAIRI, M. Water irrigation
management using remote sensing techniques: A case
study in Central Tunisia. Environmental Earth Sciences,
75(3):202, 2016.
IM, J. et al. Impervious surface quantification using a synthesis of artificial immune networks and decision/regression trees from multi-sensor data. Remote Sensing of Environment,
117:102-113, 2012.
KARIMI, P.; BASTIAANSSEN, W. G. Spatial evapotranspiration,
rainfall and land use data in water accounting–Part 1:
Review of the accuracy of the remote sensing data.
Hydrology and Earth System Sciences, 19(1):507-532,
2015.
KHANAL, S.; FULTON, J.; SHEARER, S. An overview of current
and potential applications of thermal remote sensing
in precision agriculture. Computers and Electronics in Agriculture, 139: 22-32, 2017.
MANETA, M. P. et al. Water demand and flows in the São Francisco River Basin (Brazil) with increased irrigation.
Agricultural Water Management, 96(8):1191-1200,
2009.
MELLO, C. R. de et al. Erosividade mensal e anual da chuva no Estado de Minas Gerais. Pesquisa Agropecuária Brasileira, 42(4):537-545, 2007.
PETROPOULOS, G. P. et al. Operational evapotranspiration estimates from SEVIRI in support of sustainable water management. International Journal of Applied Earth Observation and Geoinformation, 49:175-187, 2016.
PETROPOULOS, G. P. et al. Earth observation-based
o p e r a t i o n a l e s t i m a t i o n o f s o i l m o i s t u r e a n d evapotranspiration for agricultural crops in support
of sustainable water management. Sustainability,
10(1):181, 2018.
PRIESTLEY, C. H. B.; TAYLOR, R. J. On the assessment of surface heat flux and evaporation using large-scale parameters.
Monthly Weather Review, 100(2):81-92, 1972.
RAHMAN, R. et al. Design of probabilistic random forests with applications to anticancer drug sensitivity prediction.
Cancer Informatics, 14(Suppl 5):57–73, 2016.
REDDY, V. R.; CUNHA, D. G. F.; KURIAN, M. A water–energy–food nexus perspective on the challenge of eutrophication.
Water, 10(2):101, 2018.
SHIRI, J. et al. Comparison of heuristic and empirical approaches
for estimating reference evapotranspiration from limited
inputs in Iran. Computers and Electronics in Agriculture,
108:230-241, 2014.
THORNTHWAITE, C. W. An approach toward a rational classification of climate. Geographical Review,
38(1):55-94, 1948.
TICKNOR, J. L. A Bayesian regularized artificial neural network for stock market forecasting. Expert Systems with Applications, 40(14):5501-5506, 2013.
TORRES, A. F.; WALKER, W. R.; MCKEE, M. Forecasting daily
potential evapotranspiration using machine learning and
limited climatic data. Agricultural Water Management,
98(4):553-562, 2011.
TOUREIRO, C. et al. Irrigation management with remote
sensing: Evaluating irrigation requirement for maize under
Mediterranean climate condition. Agricultural Water Management, 184:211-220, 2017.
WANG, L. et al. Pan evaporation modeling using six different heuristic computing methods in different climates of China.
Journal of Hydrology, 544:407-427, 2017a.
WANG, L. et al. Evaporation modelling using different machine learning techniques. International Journal of Climatology, 37:1076-1092, 2017b.
WANG, L. et al. Pan evaporation modeling using four different heuristic approaches. Computers and Electronics in Agriculture, 140:203-213, 2017c.
YAO, Y. et al. Improving global terrestrial evapotranspiration
estimation using support vector machine by integrating
three process-based algorithms. Agricultural and Forest Meteorology, 242: 55-74, 2017.
ZHANG, K.; KIMBALL, J. S.; RUNNING, S. W. A review of remote sensing based actual evapotranspiration estimation. Wiley Interdisciplinary Reviews: Water, 3(6):834-853, 2016.