AGING, HUMAN CAPITAL AND
ECONOMIC GROWTH IN CHINA
Meixian Han
Dissertation submitted as partial requirement for the conferral of
Master in Economics
Supervisor:
Prof. Sofia de Sousa Vale, Associate Professor, ISCTE Business
School Economics Department
I
Resumo
Atualmente, o envelhecimento da população tornou-se uma questão preocupante no mundo, sendo sobretudo importante perceber como o envelhecimento da população afetará a evolução do capital humano e, através deste, o crescimento económico. Este trabalho empírico, recorre a dados de séries temporais chinesas para o período compreendido entre 1980 e 2015 e utiliza um modelo vetorial autoregressivo (VAR), para analisar a relação dinâmica que existe entre envelhecimento populacional, capital humano e crescimento económico. O trabalho organiza-se em quatro etapas. Primeiro, apresenta-se um modelo teórico que combina envelhecimento populacional, capital humano e crescimento económico. Em segundo lugar, aplicam-se testes de Dickey-Fuller (ADF) e Phillips-Perron (PP) às variáveis em análise, a saber, o PIB, o stock de capital, o número de graduados universitários e o número de trabalhadores. Em terceiro lugar, constroi-se um modelo VAR para relacionar estas variáveis. Finalmente, apresentam-se análises impulso-resposta e decomposição da variância. O resultado mostra que o envelhecimento da população não é favorável ao crescimento económico e que o crescimento do capital humano irá diminuir a taxa de crescimento do PIB. O envelhecimento e o capital humano trazem oportunidades e desafios. Como enfrentar esses problemas e alcançar o desenvolvimento coordenado do envelhecimento, do capital humano e do crescimento económico, é uma questão importante no desenvolvimento económico da China.
Palavras-chave: Envelhecimento, Capital Humano, Crescimento Econômico, modelo
VAR
Abstract
At present, the aging of the population has become an alarming issue in the world, and especially how it will affect the accumulation of human capital, thus economic growth.
This empirical research focus on Chinese time series data over the period 1980 to 2015 and, using a Vector autoregressive model (VAR), analyzes the dynamic link between aging, human capital and economic growth. The work follows four steps. First, a theoretical model of aging, human capital, and economic growth is presented. Second, the properties of the time series for the model variables including GDP, the capital stock, the number of university graduates and the number of workers were ascertained with Dickey-Fuller (ADF) and Phillips-Perron (PP) unit root procedures. Third, the variables were regressed in a VAR model. Finally, impulse response analysis and variance decomposition were applied to better assess the variables relationship.
The model results show that population aging is harmful to economic growth and that the growth of human capital will slow down the growth rate of GDP. The findings suggest that aging and human capital bring both opportunities and challenges. How to face these problems and achieve a coordinated development of aging, human capital, and economic growth is a central issue in the economic development of China.
Key words: Aging, Human Capital, Economic Growth, VAR model JEL Classification System: E51, R31
III
Acknowledgement
I am grateful to my supervisor Prof. Sofia de Sousa Vale. She is an active and kind guide who has shown attentiveness and enthusiasm for the development of the thesis, giving me many advise and revising the thesis in details. Also, thank for her patient during these time and her profession in economic field.
Moreover, I would like to thank my parents for their support and thank my classmate for this help during my degree in Economics.
Contents
1. Introduction………. 1
2. Literature Review……….4
3. The Model………... 9
3.1 Economic Growth Model under Population Aging and human capital……….10
3.1.1 Population Aging Variables………..10
3.1.2 Pension level coefficient 𝜃………..10
3.1.3 A Solow model with 𝜃 and 𝛼………11
3.1.4 Improvement of Economic Model under Aging: adding human capital……….. 11
3.2 Empirical analysis………13
3.2.1 Data statement……….13
3.2.2 Descriptive Statistics………13
3.2.3 Unit Root Test………...17
3.2.4 VAR Model………...19
3.2.5 The VAR residual test………...21
3.2.6 The Impulse Response and Variance Decomposition………..22
4. Conclusion………..26
4.1 Main conclusion………26
GROWTH IN CHINA
1
1. Introduction
Since the 1990s, China's aging process has accelerated. The rapid development of population aging trend is closely related to the decline in population fertility and birth rates, as well as the decline in mortality and life expectancy. At present, China's fertility rate has fallen below the replacement level, population life expectancy and mortality are also close to the level of developed countries.With the population who born in the mid-20th century began to enter the elderly, it can be expected that China's population aging will be the fastest growing period in the early 21st century.
According to internationally accepted criteria, a country or region whose proportion of the population over 60 years old is 10% or above, or the proportion of the population over 65 years old is 7% of the total population is an aging society.In China, the population over 65 years old increased from 62.99 million in 1990 to 88.11 million in 2000, and the proportion of the total population increased from 5.57% to 6.96%. According to statistics, the population aged 60 and above reached 222 million in 2015, accounting for 16.15% of the total population. It is estimated that by 2020, the elderly population will reach 248 million and the aging level will reach 17.17%. The population aged over 80 will reach 30.67 million. In 2025, the population aged over 60 will reach 300 million.Taking the work of family planning efforts at the end of the 1970s into consider, it is expected that China's population aging process reached its peak in 2040, and after that the aging process will get into the deceleration period.
This figure shows that the rapid decline in the proportion of labor will seriously increase the future social burden, especially in terms of heavy pension that the aging society bring.
This part of the elderly population will breed disease due to the weakening of the body resistance and the increase in urban pollution, thereby increasing the city's medical consumption. And the aging of the population, especially the aging of the working population, will lead to the decline of the proportion of the age of labor force, so that China will lose labor resources advantage.At present, China's rural population aging process is faster than the urban aging, and rural youth labor force is a large outflow, which makes the quality of labor that left in rural areas and engaged in agricultural production decline. Since elderly population has low income, it is more inclined to consumption, which leads to the reduction of social savings and the reduction of social investment and finally affects economic development.
Over the years, China has vigorously strengthened personnel training and system construction, continuously improves the quality of the population, significantly enhances the ability to innovate, and these provide strong support for the rapid growth of the economy. At present, China's average education period of new labor force is higher than the world average, the main health indicators in the forefront of developing countries, science and technology human resources ranked first in the world. However, the existing human capital still has a big gap in the structural distribution, market matching, innovation, and other aspects of the contribution,
personnel training and social demand is not effective convergence and other issues are still prominent,the task of raising human capital is very urgent.
In the 13th Five-Year Plan period, one of the basic backgrounds that China’s human capital development facing is the transformation of population structure and the reduction of demographic dividend.Human resource development and human capital investment must be the strategic focus on, China should change from relying on "demographic dividend" to enhance the "human capital dividend" to cope with changes in population structure on economic and social development challenges. Although China's human capital is equal to that of developed countries in absolute terms, the relative value is far behind the developed countries, and even the world average.
The effect of aging on human capital growth is negative, suggesting that population aging has affected human capital growth. If wages represent the strength of human capital, this suggests that workers are retired in the period of strong human capital, wasting human capital resources.
The effect of aging on the growth of human capital is becoming more and more obvious. Human capital forecasts showed that China's human capital growth will become slow in the next decade and begin to decline after 2038.
Albeit there are plenty of theoretical studies and empirical studies of population aging, human capital and economic growth, it is still a lot of question that waiting to be solved. For instance, how can we introduce aging and human capital into economic growth? The mathematical relationship between aging, human capital and economic growth, are they negative or positive? Which numeral is higher and this relates to whose impact is more significant. Also, there are many reality problems except the mathematical problem. How aging affects human capital in different way under China’s special situation? What kind of policy can China’s government publish to ameliorate aging and human capital? How to keep the economic growth rate under the aging society and human capital vicissitude? However, there still many problem in this field that should be explored and solved.
Based on the above questions, in the context of aging, this thesis builds a model based on Solow model and Cobb-Douglas function that can explain the relationship between aging, human capital and economic growth. Afterwards, an empirical model is built relating GDP, capital stock, the number of graduated students of normally university and the number of labors. Here we use GDP to measure economic growth and use the number of graduated students of normally university to measure human capital. The thesis findings indicate that population aging has a negative effect on economic growth but human capital is positive. In detail, population aging has a negative effect on consumption expenditure per capita and the national savings rate. It also affects the labor force and then influences economic growth indirectly. In addition, the growth rate of GDP will be slowed down by the growth of human capital even human capital has a positive impact on economic growth. According to these results, some economic policy implications are suggested to make. China should improve the old-age security system, speed up the adjustment of the population industry and adjust the economic
3 structure to expand domestic demand. Moreover, government should increase financial support for education and adjust the allocation of investment amount. Strengthening the awareness of human capital and changing the past evaluation criteria of local leadership performance will be a useful approach.
The main contribution of this thesis is to improve the knowledge about the link between aging and human capital and how they comprehensively affect economic growth in China through the approach of VAR framework.
The structure of this thesis builds like this: the second chapter provides a literature review about the dynamic interaction between aging, human capital and economic growth in China and shows some theoretical results that other scholars had, which can help to understand their relationship better; the third chapter builds a model based on Solow model and Cobb-Douglas function and explain how it calculate, and then presents descriptive statistics of the data for China and finally calculates the precise numerals. In this chapter, it analyzes the theoretical result and empirical result and uses the VAR model. The final part, chapter 4, summarizes the main results and concludes the whole thesis.
2. Literature Review
At present, almost all the population age structure of developed countries has transformed into structure with predominance of the elderly population.Early studies on the aging of the population are mostly concerned with the characteristics of the elderly population and mainly answered the practical problems when facing the aging population.
The study on population aging mainly began after the Second World War.In 1956, the "Population Aging and Socio-Economic Consequences" was published by the United Nations and it summed up the results of previous studies on population aging, inaugurating a new period of research on population aging.In recent years, most of the relevant study was concentrated on the description of population aging phenomenon more than the theoretical discussion.
In the study of relations of aging and economic, many scholars from OECD countries studied on the potential impact of population aging to the macroeconomic and government finance.As early as 1989, Auerbach et al. used the general equilibrium model with OLG algorithm to study the economic dynamics caused by the population aging in Germany, Japan, Sweden and the United States. In 1998, Hviding and Merette extended the work of Auerbach et al. to the OECD (Organization for Economic Cooperation and Development). The results of their research also showed that the population aging will lead to the decrease of national savings and GDP per capita, while will bring great pressure to the overall tax system.
Most economists agree with the view that population aging directly reduces the supply of labor and reduces the labor force in productive activities, which is detrimental to long-term economic growth. Peterson (1999) classifies the negative effects of population aging on economic development into the following six areas: (1) Medical costs rise at an alarming rate because the elderly need more health care, which will give the younger generation a huge burden of medical expenses or lead to a huge government deficit; (2) Expanding pension costs, also led to high insurance costs or fiscal deficits; (3) Rising age of dependency ratio leads to the deteriorating economy; (4) A serious shortage of labor has led to a decline in total economic output; (5) Savings rate drops (less young people save, older people consume their savings), resulting in reduced investment; (6) reduction the enthusiasm of the work, or reform resistance, resulting in the lack of vitality of the economy.
Some experts and scholars have suggested that the increase of the social support ratio and the decrease of the young people will affect the social development vitality and economic growth. According to this view, population aging may decrease the rate of economic growth. Yan (2000) said that the population aging will lead to a decline in the proportion of the working-age population and the relative reduction of labor resources. By 2020, the number of China's new labor force will reduce which will lead to individual job vacancies. Wu (2004) pointed out that China's aging process is ahead of the socio-economic development. China is the only country that changed to the aging society with low income, and its feature(becoming old before becoming rich)
5 will continue until the middle of this century. Li (2005) used quantitative analysis to analyze the classical economics that adds population aging variable. The simulation results showed that if the current pension system is unchanged, the increase of the elderly population in China will cause the decline of the growth rate of national income or even negative growth in the next 50 years. Peng (2006) used the "China's Computable General Equilibrium Model" (PRCGEM) and the result showed that China's population aging willslow the growth of China's economy through decreasing the growth of labor. Zhou et al. (2007) introduced the aging factor and the pension factor to the Solow model to analyze the impact of population aging on economic growth. The conclusion is that population aging reduces savings and affects investment, so it has a negative impact on economic growth.
Other scholars hold a neutral attitude saying that the population aging also has some positive effects on economic growth. Although population aging will bring a lot of negative effects we also should see that it is conducive to social and economic development in many ways. According to Jin (1991), the population aging does not necessarily reduce the level of income per capita through using the international comparison of population density and income per capita. Zhao (2004) said that population aging also has its positive side on the impact of economic and social development. For example, population aging tends to increase the human capital investment, improve the quality of labor and promote the formation of the elderly market and the development of the aging industry.Du and Yang (2009) used the latest data published by the United Nations to compare the population aging rate and the scale of the elderly population in China and Asian countries. The result indicated that China's economy can still maintain sustainable development.In 2014, the proportion of people over 65 years old in China was 10.1% and the proportion of employed persons in the primary industry was 29.5%. In France, for example, in 1946, the proportion of people over 65 years old has exceeded 10%. Only talking from the age structure of the population, the aging of French was more serious than the United Kingdom, Germany, the United States and other major world economies. From 1946 onwards, France spent 30 years to reduce the proportion of employment to 10%. At the same time, French economic grew at an average annual rate of 5.32%, which much higher than that of Germany, Britain and the US at the same period. It can be seen that the impact of the change in the structure of population employment on economic development should exceed that of the level of population aging.
In the 21st century, the aging of the world's population is inevitable and deserves careful discussion. Firstly, the way that the population aging affects economic growth is not a single way, but there are a few ways of intertwining. Secondly, the relationship between population aging and the variables that are closely related to economic growth lacks a consistent conclusion. Thirdly, there is a huge difference in the level of economic development, economic structure and institutional environment between the developing countries and the developed countries that can affect that relationship.
Center of China Finance and Economics University published "China Human Capital Report 2013". The report argued that the main factors that contribute to the growth of human capital in China are rapid urbanization, followed by education; the effect of age on human capital growth is negative, suggesting that population aging has affected human capital growth. This center recently released the "China Human Capital Report 2016", which suggests that aging has a significant impact on the growth of human capital, especially in the northeastern region. The annual contribution of aging to the growth of human capital is -1.28%. So aging exactly has some kind of impact on human capital.
But on the other hand, some authors claimed that countries can sustain economic growth despite the population aging. For example, Elgin and Tumen (2010) pointed out that in the face of a decline in human capital, the economy will shift from traditional production (using young workers) to new human capital oriented production (using older workers). Therefore, in this argument, the population aging will neither affect the production nor affect the growth momentum. In addition, Elgin and Tumen (2012) also believed that the modern economy is more dependent on the machine rather than labor. As a result, the decline in labor has no effect on productivity. According to the author, labor can be replaced by machines. In their view, this means that the reduction of the young working group has no effect on economic growth.
Lisenkova et al. (2012) have a contrastive view of this phenomenon. They found that through raising the age of retirement helps to overcome the decline of labor market. Workers of different ages were not the perfect alternatives, so the productivity of each worker would certainly decline. Other authors also emphasize the negative effects of population aging, as well as a reduction in human capital stock (Narciso, 2010), which subsequently will have a negative impact on economic growth. Thus, population aging will reduce the labor force, which will affect economic growth because of the low level of productivity. Although women are more involved in the labor force to improve labor productivity, such participation will further reduce fertility, which will eventually lead to initial problems (Alders and Broer, 2004).It is also argued that immigrants cannot help overcome public expenditure (Elmeskov, 2004), in addition to the increase in retirement age, since migrants have rights under pensions and health care systems. Although Lindh (2004) identified a negative impact on human capital accumulation, Ludwig et al. (2011) and other authors argue that for the US economy, increasing human capital investment will reduce the impact of population aging. Endogenous human capital through formal education and on-the-job training programs will positively influence human capital technology (Ludwig et al.).
Nowadays, economists are paying more and more attention to the role of human capital in economic growth. Schultz(1960) used the efficiency of income method to measure the education investment, which is the most important investment in human capital investment, showing that the contribution rate of human capital investment in economy in the United States from 1929 to 1957 was 33%, which proved the great influence of human capital on economic growth.
7 After the 1990s, the study of economic growth focused more on empirical implications and the relationship between theory and data. The empirical research on human capital and economic growth mainly focuses on whether the human capital affects the economic growth, the impact of education on economic growth and the direction of human capital and economic growth in the multi-country perspective. It is characterized by the use of regression methods for multinational comparisons or comparison between one country and multiple regions to try to find empirical evidence on the relationship between economic growth and human capital. Xu and Luo (1999) took the human capital model as an example and pointed out that education promotes the accumulation of human capital, human capital promotes technological progress, and technological progress promotes economic development. Ye (2004) took 31 provinces in China as empirical research samples, and used the multiple linear regression method to explore the effect measuring the human capital on China's economic growth. It was concluded that the coefficient of effect of human capital on economic output is 0.339.Based on the incomplete data of China's human capital and education development, Chen (2004) used a regression method to generate a complete panel data covering 1987-2001 and Chinese provinces to prove that there is a certain gap between the human capital level of different provinces, which was thought as one of the important reasons for the regional income gap in China.
The contribution of human capital to economic growth is controversial. Although theoretically, there is a more consistent view of the relationship between human capital and economic growth, that is, the accumulation of human capital has an important role in promoting economic growth, empirical studies show that there is a lot of evidence at the micro level that education can significantly increase income. Mankiw, Romer and Weil (1992) used the enrollment rate and other related data found that human capital has a significant positive effect on GDP and economic growth. Pritchett (2001) and Spiegel (1994) on their turn used the average years of education among other data to find that human capital is not related with economic growth or has even a negative correlation. Sala-i-Martin (1995) on his turn found that enrollment rates had no significant effect on economic growth, while the average years of education had a positive effect on economic growth. Johnson (1995) and Papageorgiou (2002) use the regression tree model and the threshold regression model to explain the multiple relationships between the two variables and concluded that their relationship is non-linear but multiple. Kalaitzidakis (2001) uses semiparametric estimation to discover that human capital is essentially non-linear in relation to economic growth.
The relationship between human capital and economic growth has reached a more consistent view in theory, that is, the accumulation of human capital is seen as conducive to economic growth. But quantitative analysis has not yet achieved satisfactory results. Because the contribution rate of human capital has a great correlation with the economic development stage and the original stock of human capital, it is necessary to judge the contribution of the rate of human capital to economic growth in empirical study. In the empirical study, it is necessary to develop
a set of reasonable indicators of human capital investment, human capital accumulation and contribution to economic growth in future research.
To sum up, we can see that the research results related to the population aging and human capital and economic growth are quite rich and effective. But there are some obvious shortcomings, mainly in three aspects: Firstly, the research is focused on the framework of the social security system, but lacks of macroeconomic framework from the scope of the overall study. Secondly, the population aging in the mainstream economic theory has not been generally introduced, so it lacks of the in-depth study of the role of population aging from economic significance. Thirdly, some of the main research results and conclusions are mainly based on some assumptions in the background of the western economy, which is different from the reality of China, so it lacks the guiding effect on the practical problems in China.
9
3. The Model
This section presents a model relating population aging and human capital to economic growth. Li Jun, Xiong Heping, Peng Xiujian et al.(2008) introduced population aging into a Solow-type model.
3.1 Economic Growth Model under Population Aging and human capital 3.1.1 Population Aging Variables
In the economy, the population can be divided into three categories: the underage population, the working population and the aging population. This model focuses on the effects of aging and human capital factors, so only considers the working population and the aging population, ignoring the underage population. The working population is 𝐿 (𝑡), the retired population is 𝐿𝑅(𝑡), and the economy total population is 𝑁 (𝑡), where t stands for time. The sum of the two fractions of the adult population is 𝐿 (𝑡) + 𝐿𝑅 (𝑡) = 𝑁 (𝑡) . For the sake of simplicity, 𝐿 (𝑡) , 𝐿𝑅(𝑡) , 𝑁 (𝑡) are abbreviated as 𝐿, 𝐿𝑅, and N respectively for the same period.
Define the fraction 𝛼 = 𝐿𝑅/𝑁 , the proportion of the aging population in the
economy, 𝛼 can reflect population aging. After introducing the aging factors into the economic model, we have:
𝐿𝑅 = 𝛼𝑁 [1] The working population L and the aging rate α have the following relationship: 𝐿 = (1 − 𝛼) 𝑁 [2] The introduction of α provides an effective way to quantify the effect of aging.
3.1.2 Pension level coefficient 𝜽
From the overall economy point of view, the essence of pension is a certain amount of social wealth transferred to the elderly. Let 𝑌 be the total output of the economy. The part of output used as pensions is 𝑌𝑅, while the fraction remaining after deducting 𝑌𝑅 from 𝑌 is labor force share, denoted by 𝑌𝐿. Thus, 𝑌𝑅 + 𝑌𝐿 = 𝑌.
Therefore, the income level per capita of the elderly population is 𝑌𝑅⁄𝐿𝑅, then the total income level per capita is Y/N. Now defined as follows: 𝜃 = 𝑌𝑅
𝐿𝑅 / 𝑌
𝑁, that is, 𝜃
is the ratio of the average pension income level of the aged population to the total income level per capita in the economy. If 𝜃 > 1, the elderly income per capita is higher than the overall income per capita. If 𝜃 < 1, the elderly income per capita is lower than the overall income per capita. If 𝜃 = 1, the elderly income per capita is equal to the overall income per capita. Normally, the elderly income is lower than the labor income, so θ tends to be lower than 1 in reality.
Then we have θ = YR LR / Y N = YR Y / N LR = 1 α YR Y [3]
𝜃𝛼𝑌.
3.1.3 A Solow model with 𝜽 and 𝜶
In the Solow growth model, it is usually assumed that the production function has turns to in scale and satisfies the Inada condition: 𝑙𝑖𝑚
𝑘→0𝐹
′(𝑘) = ∞, 𝑙𝑖𝑚
𝑘→∞𝐹
′(𝑘) =
0, that is, the path of the economy is not divergent. Assuming that the initial level of capital, labor and knowledge are given, the economy is initially on a balanced growth path, and the total population and knowledge are growing at constant rate, that is,
𝑁̇ 𝑁= 𝑛,
𝐴̇
𝐴= 𝑔, 𝑛 and 𝑔 are exogenous parameters, 𝑑𝑁
𝑑𝑡 = 𝑁̇.
Output is used for consumption and investment, and the proportion of output used for investment purposes is exogenous (usually corresponding to the national savings rate),
namely:K = sY﹣δK̇ , δ is the depreciation rate. Define the savings rate of the working population by s, and assume that old people are no longer saving their pension income 𝑌𝑅 but use it to consume, implying that the economy can only use 𝑌𝐿 to invest. We have:
𝐾̇ = 𝑠𝑌﹣𝛿𝐾 = 𝑠(𝑌﹣𝜃𝛼𝑌) ﹣𝛿𝐾 [4] Notice that s is the savings rate for the labor force, then assume that the national savings rate is s′. Since the actual amount of investment is the same, so
s′Y = s(Y﹣θαY) = s′(1﹣θα) [5] In the Solow model, the production function depends on three production inputs, namely capital, labor, and knowledge that change over time. Using a Cobb-Douglas production function:
𝑌 = 𝐹(𝐾, 𝐴𝐿) = 𝐾𝑎(𝐴𝐿)1−𝑎 [6] Where 𝐾 is the material capital stock, 𝐴 is knowledge which is labor-augmenting, 𝐿 is the amount of labor input in the production process. Let 𝑦 = 𝑌
𝐴𝐿 and 𝑘 = 𝐾 𝐴𝐿 ,
then we have the production function in intensive form:
𝑦 = 𝑓(𝑘) = 𝑘𝑎 [7] Since 𝑘 = 𝐾
𝐴𝐿 and 𝐿 = (1 − 𝛼) 𝑁, then
𝑘 = 𝐾 𝐴⁄ (1 − 𝛼) 𝑁 [8] Derivating k with respect to time t:
𝑘 =̇ 𝐾̇ 𝐴(1−𝛼)𝑁﹣ 𝐾𝐴̇ 𝐴2(1−𝛼)𝑁 + 𝐾𝛼̇ 𝐴(1−𝛼)2𝑁 ﹣ 𝐾𝑁̇ 𝐴(1−𝛼)𝑁2 [9] We know that 𝑁̇ 𝑁= 𝑛 , 𝐴̇ 𝐴 = 𝑔 , and 𝑦 = 𝑌 𝐴𝐿 = 𝑌 𝐴⁄ (1 − 𝛼̇) 𝑁 , 𝑘 = 𝐾 𝐴𝐿 =
11 𝑘̇ = 𝑠𝑓(𝑘)﹣𝑠𝜃𝛼𝑓(𝑘)﹣[(𝛿 + 𝑔 + 𝑛)𝑘 − 𝛼̇
1−𝛼𝑘] [10]
[10] is an expression that allow us to analyze the effects of population aging on economic growth.
In the Solow model, 𝑘̇ = 0 is an important case. When 𝑘̇ = 0, it means that 𝑘 is a constant, that is, effective capital per capita will remain unchanged, so output per capita 𝑓(𝑘) will remain unchanged.
𝑘̇ = 𝑠𝑓(𝑘)﹣𝑠𝜃𝛼𝑓(𝑘)﹣ [(𝛿 + 𝑔 + 𝑛)𝑘 − 𝛼̇
1−𝛼𝑘] = 0 [11]
Let’s analyze if [11] has unique solution.
Since 𝑠𝑓(𝑘)﹣𝑠𝜃𝛼𝑓(𝑘) = 𝑠(1 − 𝜃𝛼)𝑓(𝑘) , 𝑠(1 − 𝜃𝛼) > 0 and 𝑓′(𝑘) > 0 ,
𝑓′′(𝑘) < 0 and satisfies the Inada condition: 𝑙𝑖𝑚 𝑘→0𝑓
′(𝑘) = ∞, 𝑙𝑖𝑚 𝑘→∞𝑓
′(𝑘) = 0, so
𝑦1 = 𝑠𝑓(𝑘)﹣𝑠𝜃𝛼𝑓(𝑘) is a convex increasing curve, and its slope is infinite at 𝑘 =
0, so 𝑦1 has an unique intersection point with 𝑦2 = (𝛿 + 𝑔 + 𝑛)𝑘 − 𝛼̇
1−𝛼𝑘.
After adding the aging factor, it can be seen from [11] that the actual investment
𝑠𝑓(𝑘) changes to 𝑠𝑓(𝑘)﹣𝑠𝜃𝛼𝑓(𝑘). Since 𝜃, 𝑠, 𝛼, 𝑓(𝑘) are all bigger than 0, so 𝑠𝜃𝛼𝑓(𝑘) > 0. Since 𝜃𝛼𝑓(𝑘) = 𝛼𝑁 ∗ 𝜃𝑓(𝑘)
𝑁 , 𝑓(𝑘) is output, 𝑓(𝑘)
𝑁 is output per capita,
𝜃 is the pension level, 𝛼𝑁 is the number of the aging population. So 𝜃𝛼𝑓(𝑘) can be considered as the part of 𝑓(𝑘) that used for pension. If the 𝛼 becoming larger, it means that there are more resources used for the pension, then it will reduce economic growth rate.
After adding the aging factor, it can be seen from [11] that the break-even investment (𝛿 + 𝑔 + 𝑛)𝑘 changes to (𝛿 + 𝑔 + 𝑛)𝑘 − 𝛼̇
1−𝛼𝑘. Assume that aging is in a state of
continuous improvement, it means that 𝛼 > 0, so 𝛼̇
1−𝛼 > 0. The slope of break-even
investment curve will change from 𝛿 + 𝑔 + 𝑛 to (𝛿 + 𝑔 + 𝑛) − 𝛼̇
1−𝛼, so its
intersection point with actual curve will move to right side of coordinate axis, which means the solution of [11] will become larger. As the aging population are getting out of the labor market and transfer of part of the capital to the existing labor force, thereby increasing the level of labor capital per capita. If the total population 𝑁 does not change, the growth of the rate of population aging means a relative decline in the number of labor. Thus population aging will generate a positive effect on the output per capita of the labor force in the case of other conditions unchanged.
Numerous studies have shown that economic growth is affected by human capital, in addition to being influenced by 𝐾 , 𝐴 and 𝐿 . Human capital refers to the accumulation of knowledge and skills acquired by the workers in terms of education, training, practical experience, health care, and so on. Mankiw et al.(1992) established an economic growth model with material capital, human capital, labor and technology, and found that human capital can explain more than 40% of economic growth.
In this paper, we use the aggregate production function of Mankiw, Romer and Weil which adds human capital to the Cobb-Douglas function, that is
𝑌(𝑡) = 𝐾(𝑡)𝑎𝐻(𝑡)𝑏[𝐴(𝑡)𝐿(𝑡)]1−𝑎−𝑏 𝑎 > 0, 𝑏 > 0, 𝑎 + 𝑏 < 1 [12] Where t stands for time, the meaning of 𝐾(𝑡),𝐴(𝑡), 𝐿(𝑡) is the same as described above, and 𝐻(𝑡) represents human capital. Similarly, the production function of [12] satisfies the characteristics of the production function with constant returns to scale,
and we have following the assumptions regarding inputs dynamics : 𝐾̇ = 𝑠𝑌﹣𝛿𝐾 ,
𝑁̇ 𝑁= 𝑛,
𝐴̇
𝐴= 𝑔. Human capital also satisfies 𝐻(𝑡)̇
𝐻 = ℎ.
Taking the logarithm of equation [11] , we can get:
𝑙𝑛 𝑌 = 𝑎𝑙𝑛𝐾 + 𝑏𝑙𝑛𝐻 + (1 − 𝑎 − 𝑏)[𝑙𝑛𝐴 + 𝑙𝑛𝐿] [13] Derivating [12] with respect to time:
𝑌̇ 𝑌 = 𝑎 𝐾̇ 𝐾 + 𝑏 𝐻̇ 𝐻 + (1 − 𝑎 − 𝑏)[ 𝐴̇ 𝐴 + 𝐿̇ 𝐿] [14]
From the previous assumptions we can see that 𝐻, 𝐴, 𝐿are growing at a constant rate, so it is possible to achieve a steady state equilibrium as long as 𝑌 and K can maintain a constant growth rate. From 𝐾 = 𝑠𝑌﹣𝛿𝐾̇ we can find the growth rate of 𝐾̇ is to be: 𝐾̇ 𝐾 ̇ = 𝑠′ 𝑌 𝐾 – 𝛿 [15]
When the growth rate of 𝐾 is constant, that is, the righthand side of the equation is constant, then 𝑌
𝐾 must be constant. In other words, the growth rate of 𝑌 and 𝐾 must
be equal. So using the fact that in the balanced growth path 𝑌̇
𝑌= 𝐾 𝐾
̇
, equation [14] can be rewritten as:
𝑌(𝑡)̇ 𝑌(𝑡) 𝑏𝑔𝑝 = 𝑏ℎ+(1−𝑎−𝑏)[ 𝐴(𝑡)̇ 𝐴(𝑡) + 𝐿(𝑡)̇ 𝐿(𝑡)] 1−𝑎 [16]
We use 𝑏𝑔𝑝 to represent the balanced growth path.
In the balance growth path, let 𝑝(𝑡) = 𝑌(𝑡)/𝐿(𝑡), which means that 𝑝(𝑡) is the average output per unit of the labor force. The growth rate of 𝑝(𝑡) is
𝑔𝑝 = 𝑝(𝑡)̇ 𝑝(𝑡) ̇ = 𝑌(𝑡)̇ 𝑌(𝑡) ̇ ﹣𝐿(𝑡)̇ 𝐿(𝑡) ̇ [17]
13 Inserting [17] into [16], the growth rate of output per capital:
𝑔𝑝𝑏𝑔𝑝 = 𝑏ℎ+(1−𝑎−𝑏)[ 𝐴(𝑡)̇ 𝐴(𝑡) + 𝐿(𝑡)̇ 𝐿(𝑡)]− 𝑏 𝐿(𝑡) 𝐿(𝑡) ̇ 1−𝑎 [18]
We consider that aging factors will cause changes in the structure of the population, and changes in population structure affect the supply of labor, thus aging affects economic growth. Adding aging factors in this model, under the ideal assumption, we assume that the change amount in the labor force equals to the change amount in the working population change into the aging population during the period t. Then the average output per labor is not affected by aging, so
𝐿(𝑡)̇ = 𝐿𝑅(𝑡)̇ – 𝑟(𝑡) 𝐿𝑅(𝑡)̇ [19] 𝐿(𝑡)̇ is the change in the amount of the labor force, 𝐿𝑅(𝑡)̇ is the change of the
amount of the aging population, 𝑟(𝑡) is the change rate of mortality of the aging population. Put [19] into [18], and ignore the small figure 𝑟(𝑡), then the change of 𝑔𝑝𝑏𝑔𝑝 is
∆𝑔𝑝𝑏𝑔𝑝 = 𝑏 1−𝑎
𝐿(𝑡)̇ −𝐿𝑅(𝑡)̇
𝐿(𝑡) [20]
Now we can see if a and b do not change, the rate of change of the labor force and the
rate of change of the aging population can affect the rate of change of 𝑔𝑝𝑏𝑔𝑝. Also
human capital plays an important role in economic growth, and its effect is mainly achieved by the value of parameter b.
3.2 Empirical analysis 3.2.1 Data statement
The empirical analysis uses time series data for China whose time span is 1980 to 2015. To estimate the Cobb-Douglas function, the model variables include GDP(Y), capital(K), human capital(H) and labor(L). The set of data series used for China is collected from the "China Statistical Yearbook".
Gross domestic product (Y) is the annual GDP, at constant prices, collected on a yearly level from 1980 to 2015.
Capital (K) is the capital stock calculated by Lei and Zhang1, at constant prices. The authors used the perpetual inventory method(PIM) to calculate the capital stock from 1952 to 2015, and this model chooses the time series data on a yearly level from 1980 to 2015.
Human capital (H) corresponds to the number of students that graduated from university from 1980 to 2015. The estimation uses the number (unit: 10^4) of the university graduated students to measure human capital.
1 Lei Juan and Zhang Hui calculated the capital stock from 1952 to 2015 for China in “Revaluation and
Labor (L) is the annual number (unit: 10^4) of working population from 1980 to 2015.
3.2.2 Descriptive Statistics
In order to deal with asymmetry and nonnormality and calculate the Cobb-Douglas function, a natural logarithm transformation has been computed to all data. This data is analyzed by EVIEWS 8.0.
(a)
15 (c)
(d)
Figure 1: The line graph of ln(GDP), ln(capital), ln(human capital) and ln(labor)
As we can see on Figure 1(a) to 1(d), Y, K, H and L show upward linear-trends. Y and K display similar increasing rates and a uniform velocity. PIM uses a relative efficiency geometric decreasing model to calculate the capital stock whose basic
function is Kt = Kt−1(1 − δt) + It/Pt . Kt represents the capital stock of t year,
Kt−1 represents the capital stock of year t − 1, It is the investment of year t, Pt
means the investment price index of year t and δt is the depreciation rate of year t. GDP has some impact on Kt and It , so it is reasonable that GDP presents a growth
path similar to K as can be seen in the graph. Human capital, represented in Figure 1(c) had a rapid growth in 1981 and 1982, describing a peak. The Chinese government resumed the college entrance examination in 1978 so the number of graduated students increased fast after 4 years. With respect to L, after 1978, a reform and opening-up policy was implemented so there were more and more job opportunities. More and more people got the chance to work enlarging the working population.
(a)
17 (c)
(d)
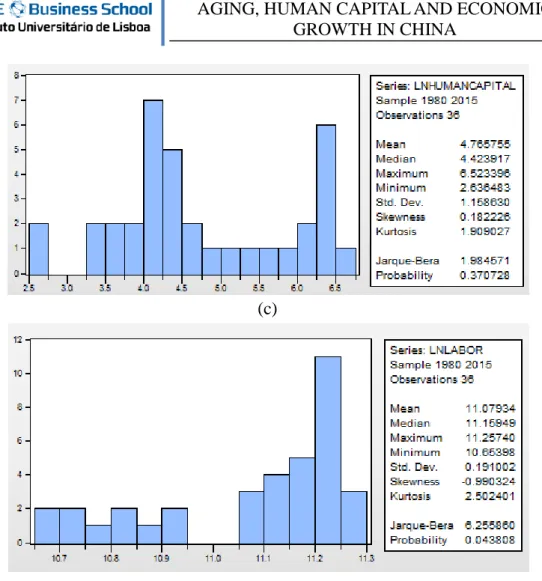
Figure 2: The Jarque-Bera test for ln(GDP), ln(capital), ln(human capital) and ln(labor)
Figure 2(a) to 2(d) presents the Jarque-Bera test, to examine the normality of this data. The Figure presents the mean of the series and the maximum and minimum values of data. The null hypothesis is that the observations are normally distributed, therefore, if the probability value is smaller than the value of 5% significance level, the null hypothesis (H0) can be rejected and the observations are not normally distributed. Moreover, the value of Skeweness and Kurtosis indicates the distribution of this data. If the value of Skewness is larger than 0, the time series shows right-skewed distribution, otherwise, it shows left-skewed distribution. If the value of Kurtosis is lower than 3, the time series has a platykurtic distribution while the time series has a leptokurtic distribution if the value is larger than 3. For Y, K and H, their probability values are all larger than the 5% significance level so they are normally distributed but L is not normally distributed. Also, Y and L show left-skewed distribution and K and H show right-skewed distribution. As all the values of Kurtosis are lower than 3, thus these time series have a platykurtic distribution.
3.2.3 Unit Root Test
root then the time series is non-stationary. When the unit root process exists, the time series is not smooth.
The time-varying behavior of the moment characteristic of the time series reflects the non-stationary properties of the time series. The unit root test of the time series is the test of the stability of the time series. If there is a unit root in the nonstationary time series, the unit root can be eliminated by the difference method, and a stationary sequence can be obtained. The time series that has a unit root generally shows significant memory and the persistence of volatility, so the unit root test is the discussion basis of cointegration relationship tests. Nelson and Plosser (1982) and later many scholars have shown that the unit roots of the autoregressive part of the ARMA model has important results in the dynamic economic model.
To test for the presence of a unit root in the time series we use two typical tests: the Augmented Dickey-Fuller (ADF test) and the Phillips- Perron (PP test). The ADF test is based on a parametric autoregressive structure which can catch serial correlation, while PP test is the non-parametric corrected intensity of the long-term variance due to the first order difference of the time series.
For both ADF and PP tests, the null hypotheses is:
H0: there is a unit root (which means the time series is non-stationary)
H1: there is no unit root for the time series (which means the time series is stationary).
Both tests will test the absolute value on a 1%, 5% or 10% significant level and if the absolute value of the test is higher than that then we can reject the null.
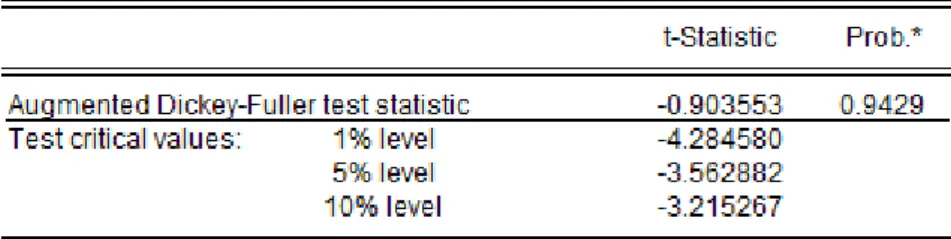
Table 1 and 2 below show the result of the unit root tests for Y, K, H and L.
Variables ADF 1% 5% 10% Pro. Unit root
Ln GDP -0.903 -4.284 -3.563 -3.215 0.9429 Yes D(ln GDP) -3.690 -4.284 -3.562 -3.215 0.0382 No Ln Capital -2.326 -4.252 -3.548 -3.207 0.4092 Yes D(lncapital) -4.026 -4.252 -3.548 -3.207 0.0172 No Ln H -3.762 -4.356 -3.595 -3.233 0.0356 No Ln Labor -47.347 -4.356 -3.595 -3.233 0.0000 No
Table 1: The result of ADF test for ln(GDP), ln(capital), ln(human capital) and ln(labor) , variables in levels and in first difference
Note 1) The test regression includes a time trend and a constant 2) D(x) means the first difference of x
In Table 1, we can see that although ln Y and ln K are non-stationary, the first difference of all these time series are stationary, which means that they are all integrated of order one(denoted by ln Y~I(1), ln K~I(1)). But ln H and ln L are stationary series (denoted by ln H and ln L ~ I(0)).
Variables PP 1% 5% 10% Pro. Unit root
Ln GDP -1.261 -4.244 -3.544 -3.205 0.8809 Yes D(ln GDP) -2.978 -3.629 -2.951 -2.614 0.0420 No
19 Ln Capital -2.547 -4.244 -3.544 -3.205 0.3050 Yes D(lncapital) -3.922 -4.253 -3.548 -3.207 0.0218 No Ln H -2.481 -4.244 -3.544 -3.205 0.3348 Yes D(ln H) -6.776 -4.253 -3.548 -3.207 0.0000 No Ln L -3.710 -3.632 -2.948 -2.612 0.0082 No
Table 2: The result of PP test for ln(GDP), ln(capital), ln(human capital) and ln(labor)
Note 1) The test regression includes a time trend and a constant 2) D(x) means the first difference of x
In Table 2, it can be seen that although ln Y, ln K and ln H are non-stationary, the first difference of all these time series are stationary, which means that they are all integrated of order one(denoted by ln Y~I(1)). And ln L is I(0).
Even if the result of these two tests are not exactly the same, Y, K, H and L are not integrated of the same order, so a joint estimation of these variables implies to transform Y and K into I(0) processes. Taking the first difference of Y and K that is D(ln Y) and D(ln K), and using ln H and ln L both I(0), we can build a VAR model.
3.2.4 VAR Model
Vector autoregressive model (simplified as VAR model), is a commonly used econometric model, which proposed by Christopher Sims in 1980. The VAR model is used to estimate the dynamic relationship of the joint endogenous variables without any prior constraint.
The VAR model is a model based on the statistical properties of the data. The VAR model uses every endogenous variables as the lag value of all the endogenous variables to build the model, and generalizes the univariate autoregressive model to the "vector" autoregressive model composed of multiple time series variables. The VAR model is one of the most easily manipulated models for the analysis and prediction of multiple relevant economic indicators, and the multiple MA and ARMA models can be transformed into VAR models under certain conditions.
The first step is to use lag length Criteria to choose then optimal lag length. For the annual series, we usually set the maximum lag as four.
Table 3: Lag order selection criteria for for Dln(GDP), Dln(capital), ln(human capital) and ln(labor)
The optimal lag is normally chosen based on two statistic criterion – Akaike (AIC) and Schwarz (SC) that are presented in Table 3. The “*” mark on the table represents the optimal one. Also, the optimal lag of the model is determined according to the principle of minimum AIC value. Estimations on Table 3 indicate that 1 lag order is the optimal lag.
The expression of the VAR model with lag order p is:
Yt = A1Yt−1+ A2Yt−2+ ⋯ + ApYt−p+ BXt+ μt [20]
Here, An and B is a 4 × 1 matrix,An is an adjustment parameter matrix, B is the cointegration vector matrix, Yt is the endogenous variables vector, Xt is the exogenous variables vector and p is the lag order which is 1 in this case.
Table F in Appendix shows the expression of the VAR model as below:
Yt = [ 0.672572 −0.664969 −0.008684 0.929648 0.021231 0.090588 0.001261 4.21E − 05 0.012504 0.071132 −0.214437 1.483166 0.928932 0.028572 0.824411 −0.249252 ] Yt−1 + μt [21] Yt = [ Dln GDP ln human capital ln labor Dln capital ]
The VAR model is a dynamic model so it is hard to explain it through its function. So next we explain it with the impulse response and variance decomposition.
21
3.2.5 The VAR residual test
Before the impulse response, we should test if the VAR model is stable. Now we use AR roots graph to test the stability of the VAR model.
-1.5 -1.0 -0.5 0.0 0.5 1.0 1.5 -1.5 -1.0 -0.5 0.0 0.5 1.0 1.5 Inverse Roots of AR Characteristic Polynomial
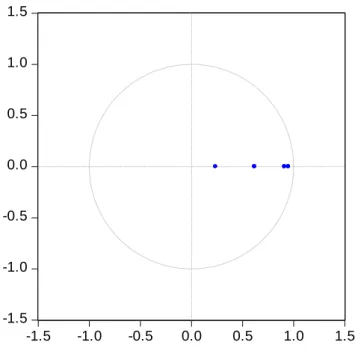
Figure 3: The AR roots graph of the VAR model
As we can see in Figure 3, no root lies outside the unit circle which means that this VAR model satisfies the stability condition. Then we test the normality and autocorrelation of the residual.
Table 4: The normality test of the VAR residual
The null hypothesis of normality test is that the observations are normally distributed, therefore, if the probability value is larger than the value of 5% significance level, the null hypothesis (H0) can not be rejected and the residual are normally distributed. In
Table 5: The autocorrelation LM test of the VAR residual
The null hypothesis of autocorrelation test is that the observations do not have autocorrelation and we can conclude that the residual are not autocorrelated.
3.2.6 The Impulse Response and Variance Decomposition
-.03 -.02 -.01 .00 .01 .02 1 2 3 4 5 6 7 8 9 10 Response of DLNGDP to DLNCAPITAL (a)
23 -.03 -.02 -.01 .00 .01 .02 1 2 3 4 5 6 7 8 9 10 Response of DLNGDP to LNHUMANCAPITAL (b) -.03 -.02 -.01 .00 .01 .02 1 2 3 4 5 6 7 8 9 10 Response of DLNGDP to LNLABOR (c)
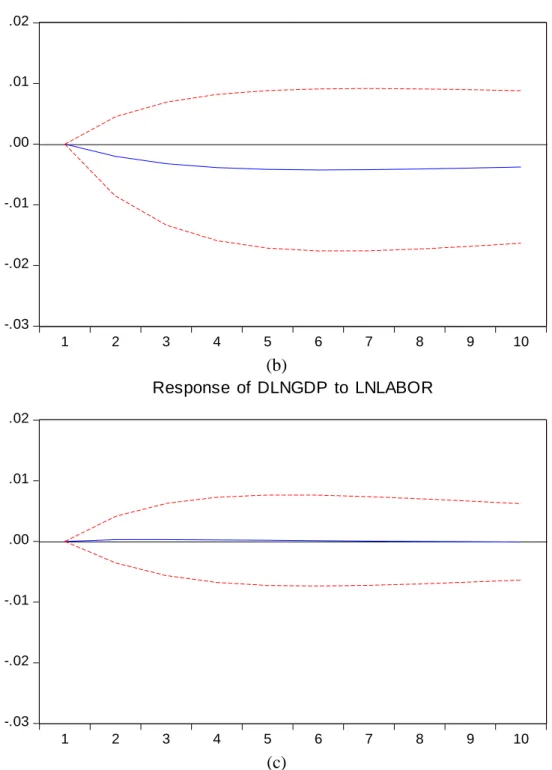
Figure 4: The Impulse Response of for Dln(GDP), Dln(capital), ln(human capital) and ln(labor), China (Period: 10)
The impulse response function characterizes the effect of adding a standard size impact on an error term to the current and future values of the endogenous variable. Figure 4(a) to 4(c) illustrates the dynamic response of Dln(GDP) to Dln(capital), ln(human capital) and ln(labor). The horizontal axis represents the tracking period (units: year) of the response function, and the vertical axis presents the degree of response of the variable. The solid line is the calculated value of the response function, and the dotted line shows the deviation of the response function value that plus or
minus twice.
According to Figure 4(a), the growth rate of capital has a negative effect on the growth rate of GDP, but the effect is weak and the duration is short. It reaches its lowest peak in the second period and then raises, but its impact never become positive. This illustrates that if China’s government wants to make capital growth fast then it will have to slow down the growth of GDP. Similarly, 4(b) displays that human capital has a negative effect on the growth rate of GDP too. It changes smooth and reaches its lowest peak during period 5 to 7. It is believed that human capital has positive affect on economic growth but it shows to be negative in Figure 4(b). The main reason may be that human capital will not contribute as soon as it is invested. The financial expenditure that used to improve the level of human capital will not gain profit soon which may slow the growth rate of GDP. Moreover, the government will expend more on raising human capital due to the department operating efficiency is low. Labor has a weak impact on the growth rate of GDP, which is showed in 4(c). Its effect is always positive and keep stable which is close to 0.
Table G and H in Appendix present the impulse response whose period are 20 and 40. All the curve tends to 0 and they are convergent at the end, which describes that the VAR model is stable and meaningful.
Table G and H in Appendix present the impulse response whose period are 20 and 40. All the curve tends to 0 and they are convergent at the end which describes that the VAR model is stable and meanful.
Period S.E. DLNGDP DLNCAPITAL
LNHUMANCA PITAL LNLABOR 1 0.048326 100.0000 0.000000 0.000000 0.000000 2 0.057679 99.35036 0.525219 0.121948 0.002471 3 0.061305 98.69254 0.918877 0.383925 0.004655 4 0.062912 98.08019 1.170563 0.743184 0.006060 5 0.063723 97.50536 1.335200 1.152644 0.006792 6 0.064196 96.96952 1.448432 1.574987 0.007063 7 0.064513 96.47691 1.530159 1.985846 0.007086 8 0.064750 96.02976 1.591590 2.371613 0.007035 9 0.064939 95.62763 1.639284 2.726041 0.007041 10 0.065098 95.26820 1.677251 3.047362 0.007192
Table 4: The Variance Decomposition for Dln(GDP), Dln(capital), ln(human capital) and ln(labor) (Period: 10)
The impulse response function describes the effect of the impulses of Dln(capital), ln(human capital) and ln(labor) on Dln(GDP), and then variance decomposition can be used to analyze their contribution to GDP. In the process of variance decomposition, the Cholesky orthogonalization is used to remove the correlation and
25 sequence correlation between the residual items, and the contribution of each variable to GDP is analyzed.
It is displayed in Table 4 that, the growth rate of capital, its contribution to the growth rate of GDP changes from 0 to 1.17% in the first four years and it smoothly increases by the growth rate of 0.1% every period.
Human capital contributes more than the growth rate of capital which grows to 3.04% in tenth period and it keeps the average growing speed of 0.35% every period. We can conclude that human capital is the most important factor in these three variables which means it really contribute much to China’s economic growth.
It is clear that labor does not contribute great to the growth rate of GDP. In the first five periods, it raises to 0.007% and it maintains this value of contribution during the last period.
In general, human capital is the most important factor in these three variables. It contributes more than 3% to the growth rate of GDP. In contrast, labor has limit contribution to the growth rate of GDP which is not higher than 0.008%.
4 Conclusion
4.1 Main Conclusion
Based on the special effects of population aging and human capital in economic growth, this paper analyzes the impact of population aging and human capital on economic growth both through a theoretical and an empirical model. The paper explores and analyzes the relationship between population aging, human capital and economic growth, and achieves some innovative results. Aging and human capital are introduced into a Solow-type model with a Cobb-Douglas function.
The paper uses time series for China to test the long-run relationship between population aging, human capital and economic growth by using unit root tests, a VAR model, and impulse response and variance decomposition analysis. Here we use time series data of GDP, capital stock, university graduates and workers in China from 1980 to 2015 to build a VAR model and describe the dynamic process between aging, human capital and economic growth.
The results show that population aging is not conducive to economic growth. In terms of direct effects, population aging has a negative effect on economic growth, considering consumption expenditure per capita and the national savings rate. The negative effect is persistent and stable, and has not slowed down over time.In terms of indirect effects, aging affects the labor force and then indirectly influences economic growth. Both direct and indirect analysis show that population aging has a drag on economic growth.Therefore, the future of China's population aging will be a more profound impact on China's economic growth. To properly handle the relationship between the population aging and the economy is crucial.To prevent the rapid and excessive aging of the future population dragging down China's economic growth and distorting the economic structure, it is very important for China's economic development to improve the family planning policy, encourage fertility and the eugenics to improve the quality of the population.
In the impulse response analysis, we can find that the growth of human capital will slow down the growth rate of GDP. It is known that human capital has a positive impact on economic growth and the empirical analysis also prove that. Human capital is a complex concept and it can be measured from the education level, training, quantity and other aspects which means it would not grow fast and direct. First, the government's allocation of investment in education is unreasonable.For a long time, China's education investment is mainly concentrated in higher education and investment in basic education is too little.But whether in society or in person, primary education has the highest return rate.China's education investment leads to the lack of funding for primary education and the return rate of higher education funding is not high enough, so that the equivalent of an invisible waste of education funding. Secondly, the efficiency of the education sector is low so that the investment is wasted. In China, many people do not realize the importance of human capital in economic growth so they do not have the awareness of improving human capital.This results in a low degree of return on investment in education and low operational efficiency.
27 Finally,the particularity and lag of human capital determines that it is complicated in the process of promoting GDP growth and requires a lot of input and try.Most of the economic studies illustrates that human capital is an important factor in economic growth. Appropriate investment can bring good income, so reasonable and effective human capital investment is the best way to improve the yield.
In conclusion, not only aging but also human capital plays an important role in economic growth. The labor scarcity caused by population aging can be compensated by human capital, and the increase in human capital helps to delay the impact of population aging on economic growth. So how to balance the relationship between aging, human capital and economic growth becomes an important issue in China's promotion of economic growth and improving people's living standards.
4.2 Policy suggestions
China's population aging is still at an early stage, but it will certainly have a profound impact on China's economic development with the further deepening of the future population aging.
First, the aging population will suppress the consumption of residents but pull up the national savings. China should improve the old-age security system, speed up the adjustment of the population industry and adjust the economic structure to expand domestic demand and stimulate China's economic growth. Second, China's consumption expenditure per capita will continue to change negatively under the impact of the aging population which is not conducive to improve the level of consumption of the residents. In general, population aging has a positive effect on national savings which is helpful to capital accumulation. To prevent the residents from only concerning about savings and resulting in domestic consumption downturn, China should speed up the improvement of the elderly security system, reform pension system to protect the elderly normal living standards and improve the consumption level of young consumer groups.Third, it is important to speed up the rationalization of family planning policy adjustment. Government should encourage fertility, increase the proportion of young people, increase human capital investment so that it can provide adequate and high-quality labor to future economic growth. At present, China has a problem that they are rich in labor resources but have a shortage of human capital. In addition, the imperfect education system and the irrational distribution of investment in education also hindered the promotion of human capital.
Firstly, government should increase financial support for education. Also, reasonable allocation of investment amount makes education investment more diversified, for instance, increasing investment in basic education. And then, China should pay attention to other ways that can improve human capital except education such as improving the health level of human capital. It can be established a sound medical insurance system, promote medical technology and strive to achieve the social justice goals. What’s more, the government should strengthen people’s understanding of the importance of human capital.On the one hand, strengthen the awareness that human
capital is an important basis for economic development through publicity. On the other hand, it is necessary to change the past evaluation criteria of local leadership performance that usually bases on GDP, fiscal revenue and disposable income per capita but add human capital as an important indicator.
In conclusion, China's current problems are that population aging and the shortage of human capital still need to be resolved. How to delay the population aging and enhance human capital has become an important issue in China's economic development. For China's economic development, these problems bring both opportunities and challenges, China should face these problems with a scientific attitude, take reasonable policy, and then it can achieve the coordinated development of aging, human capital and economic growth.
29
Appendix
GDP(10^9) Capital(10^9) Human capital (10^4) Labor (10^4) 1980 4587.6 7319.2 14.7 42361 1981 4935.8 7756.3 13.964 43725 1982 5373.4 8334 45.7244 45295 1983 6020.9 9014 33.5344 46436 1984 7278.5 9915.9 28.6937 48197 1985 9098.9 11014.3 31.6 49873 1986 10376.2 12219.1 39.28 51282 1987 12174.6 13639.5 53.19 52783 1988 15180.4 15155.6 55.3466 54334 1989 17179.7 16141.4 57.6242 55329 1990 18872.9 17113.8 61.4 64749 1991 22005.6 18386.6 61.4267 65491 1992 27194.5 20173.5 60.4223 66152 1993 35673.2 22616.1 57.0715 66808 1994 48637.5 25590.5 63.7417 67455 1995 61339.9 28993.8 80.5 68065 1996 71813.6 31681.4 83.8638 68950 1997 79715 35406.3 82.907 69820 1998 85195.5 38640.4 82.9833 70637 1999 90564.4 42553.5 84.76 71394 2000 100280.1 46221.7 94.98 72085 2001 110863.1 50445 103.63 72797 2002 121717.4 55520.4 133.73 73280 2003 137422 60240.7 187.7 73736 2004 161840.2 71283 239.1 74264 2005 187318.9 80935.5 306.8 74647 2006 219438.5 90268.1 377.5 74978 2007 270232.3 100009.7 447.79 75321 2008 319515.5 112789.3 511.95 75564 2009 349081.4 124387.6 531.1 75828 2010 413030.3 137463.5 575.42 76105 2011 489300.6 150061.5 608.16 76420 2012 540367.4 166440.8 624.7 76704 2013 595244.4 182669.4 638.721 76977 2014 643974 201115.7 659.3671 77253 2015 689052.1 223684.2 680.8866 77451
Table B: The ADF test for ln(GDP), ln(capital), ln(human capital) and ln(labor), China
31
Table C: The ADF test for the first difference of ln(GDP), ln(capital), ln(human capital) and ln(labor), China
33
Table E: The PP test for the first difference of ln(GDP), ln(capital) and ln(human capital), China
Table F: The Vector autoregressive model for Dln(GDP), Dln(capital), ln(human capital) and ln(labor), China
35 -.03 -.02 -.01 .00 .01 .02 2 4 6 8 10 12 14 16 18 20 Response of DLNGDP to DLNCAPITAL -.03 -.02 -.01 .00 .01 .02 2 4 6 8 10 12 14 16 18 20 Response of DLNGDP to LNHUMANCAPITAL -.03 -.02 -.01 .00 .01 .02 2 4 6 8 10 12 14 16 18 20 Response of DLNGDP to LNLABOR
Response to Cholesky One S.D. Innovations ?2 S.E.
Table G: The Impulse Response of for Dln(GDP), Dln(capital), ln(human capital) and ln(labor), China (Period: 20)
-.03 -.02 -.01 .00 .01 .02 5 10 15 20 25 30 35 40 Response of DLNGDP to DLNCAPITAL -.03 -.02 -.01 .00 .01 .02 5 10 15 20 25 30 35 40 Response of DLNGDP to LNHUMANCAPITAL -.03 -.02 -.01 .00 .01 .02 5 10 15 20 25 30 35 40 Response of DLNGDP to LNLABOR
Response to Cholesky One S.D. Innovations ?2 S.E.
Table H: The Impulse Response of for Dln(GDP), Dln(capital), ln(human capital) and ln(labor), China (Period: 40)
37 0 20 40 60 80 100 2 4 6 8 10 12 14 16 18 20
Percent DLNGDP variance due to DLNGDP
0 20 40 60 80 100 2 4 6 8 10 12 14 16 18 20
Percent DLNGDP variance due to DLNCAPITAL
0 20 40 60 80 100 2 4 6 8 10 12 14 16 18 20
Percent DLNGDP variance due to LNHUMANCAPITAL
0 20 40 60 80 100 2 4 6 8 10 12 14 16 18 20
Percent DLNGDP variance due to LNLABOR
Variance Decomposition
Table I: The Variance Decomposition for Dln(GDP), Dln(capital), ln(human capital) and ln(labor), China (Period: 20)
Bibliography
Alders, P. and Broer, D. P. (2004) “Ageing, fertility, and growth”, Journal of Public
Economics 89:1075– 1095.
Auethach,Alan L and Laurenee J.(1987) Kotlikoff, Dynamie Fiseal Policy, Cambridge University Press, Cambridge, U.K.
Barro, R. J. and X. Sala-i-Martin. 1995. Economic Growth. New York: McGraw Hill, Inc.
Behabib,J and M.Spiegel. ,1994, The Role of human Capital in Economic
Development:Evidence from Aggregate Cross-country Data[J].Journal of Monetary
Economics,34(2).
Bloom, D. E., Canning, D., & Fink, G. (2011). Implications of Population Aging for Economic Growth. NBER Working Papers, (64), 36.
Bloom, D. E., Canning, D., & Fink, G. (2011). Implications of Population Aging for Economic Growth. NBER Working Papers, (64), 36.
Bloom, D. E., Canning, D., & Rosenberg, L. (2011). Population Aging and Economic Growth in China, (67).
Bloom, D. E., Lutz, W., Mcnicoll, G., Editor, M., Churchill, E. P., Caldwell, J. C., … Mabogunje, A. L. (2008). Population Aging , Human Capital and AND
DEVELOPMENT. Population and Development Review, A Suppleme.
Chen Zhao. (2004). Regional differences in human capital and educational development in China: Estimation of panel data. World economy. (12). 25-31.
China Human Capital and Labor Economics Research Center. (2014). China Human Capital Report 2013.China Finance and Economic University
China Human Capital and Labor Economics Research Center. (2017). China Human Capital Report 2016.China Finance and Economic University
Čiutienė, R., & Railaitė, R. (2015). A Development of Human Capital in the Context of an Aging Population. Procedia - Social and Behavioral Sciences, 213, 753–757.
Dupeng, Yanghui, 2009, Comparison of Population Aging in China and Asian Countries, Population and Development,Vol.15,No.2