António Afonso, Marcelo Alcântara
E
URO
A
REA
S
OVEREIGN
D
EBT
C
RISIS AND
D
EBT
M
UTUALISATION
WP07/2016/DE/UECE _________________________________________________________
De pa rtme nt o f Ec o no mic s
WORKING PAPERS
1
E
URO
A
REA
S
OVEREIGN
D
EBT
C
RISIS AND
D
EBT
M
UTUALISATION
*
ANTÓNIO AFONSO,$
MARCELO ALCÂNTARA
FEBRUARY 2016
Abstract
We study debt mutualisation in the Euro area. Bearing in mind other existing proposals we provide an alternative Blue, Yellow and Red Bonds proposal: blue, would cover debt up to 60% of GDP, yellow would include debt from 60% up to 90% of GDP, and red would cover debt above 90% of GDP. Although not with joint liability, the rationale behind the Yellow Bonds with a joint issuance is the attraction of liquidity, which would be beneficial, especially for the countries with high yields. This could give more room to public authorities.
Keywords: EMU, Euro area crisis, sovereign yields, government debt, debt mutualisation.
JEL:F45, H12, H20, H63
*
We are grateful to very useful comments from João Ferreira do Amaral and Ricardo Cabral. The opinions expressed herein are those of the authors and do not necessarily reflect those of their employers.
Any remaining errors are the authors’ sole responsibility.
$
2
1. Introduction
The financial crisis of 2008 put in evidence structural failures of the Euro area economies, such as their high level of public debt and the close relation between sovereigns and the financial system. Indeed, in the years after the creation of the Euro area, many Member States borrowed large amounts of money, benefiting from the low government bond yields the single currency allowed them to have. Government bonds were sold mainly to national banks, which led to a high level of exposure to sovereign debt. The solvency of banks forced governments to intervene during the financial crisis, worsening their fiscal situation and creating doubts about their own solvency, which then raised concerns about the solvency of domestic banks, the prime buyers of national public debt.
Several financial mechanisms were proposed by the European institutions to solve the sovereign debt crisis in the Euro area such as the EFSM and the EFSF, with a
joint lending capacity of €500 billion, as well as non-conventional monetary policies by the ECB. Despite contributing to lower the government bond yields, these mechanisms have not solved the structural problem of high public debt values.
One of the possible solutions to this problem is debt mutualisation, which allows for a sharing of the responsibilities in the Euro area, providing governments with mechanisms to enhance economic growth and fiscal consolidation.
We review debt mutualisation in the Euro area as a means of dealing with the high levels of government indebtedness that many Member States face. Afterwards, we provide an alternative Blue, Yellow and Red Bonds proposal: the blue tranche, would cover debt up to 60% of GDP, the yellow tranche would include debt from 60% up to 90% of GDP, and the red tranche would cover debt above 90% of GDP. Although not with joint liability, the rationale behind the Yellow Bonds with a joint issuance is the attraction of liquidity, which would be very beneficial, especially for the countries with high yields. This could give more room to public management.
3
2. The Economic and Monetary Union
The decision to create the EMU was taken at the European Council Meeting of December 1991, in Maastricht, three years after this Council mandated the European Commission’s President Jacques Delors to set a committee to study its feasibility. In the following year, the approved Maastricht Treaty included the convergence criteria to be met by each country that would participate in the EMU. Among others, these criteria stated that the public debt should not exceed 60% of GDP and the budget deficit should not be higher than 3% of GDP.
On 31 December 1998, the conversion rates of the currencies of participating countries were fixed against the ECU1, which was replaced by the Euro on the following day and on 1 January 2002, Euro coins and banknotes entered into circulation. At this time, twelve countries belonged to the Euro area – the EU15 Member States2, with the exception of the United Kingdom, Denmark and Sweden. Slovenia would adopt the Euro in 2007, Cyprus and Malta in 2008, Slovakia in 2009, Estonia in 2011, Latvia in 2014 and Lithuania in 2015, totalling nineteen countries in the European single currency area.
2.1. Economic Integration
To evaluate the possibility of a group of countries forming an economic and monetary union, the theory of Optimum Currency Areas (OCA)3 is used. This theory advocates that the costs and benefits of joining a fixed exchange rate area depend on the level of integration between a country and its potential partners.
These benefits are related with more efficient capital markets, better management of inflation, better investment analysis and gains in terms of trade with countries outside the exchange rate area. Krugman, Obstfeld and Melitz (2012) stated that, “a high degree of economic integration between a country and a fixed exchange rate area magnifies the monetary efficiency gains the country reaps when it fixes its exchange rate against the area’s currencies”. Hence, the higher the degree of economic
integration between the joining country and the fixed exchange rate area, the higher the monetary efficiency gains for the joining country.
1
ECU – European Currency Unit
2 EU15 Member States – Belgium, Germany, France, Italy, Luxembourg, Netherlands, Denmark, Ireland,
United Kingdom, Greece, Portugal, Spain, Austria, Finland and Sweden.
3
4 On the other hand, the costs of joining a fixed exchange rate area are related to the loss of the monetary policy, reduction of the macroeconomic policies to the fiscal policy, possible deepening of inequality and loss of seigniorage benefits. The same authors concluded that, “a high degree of economic integration between a country and the fixed exchange rate area that it joins reduces the resulting economic stability loss
due to output market disturbances”. Therefore, the higher the degree of economic integration, the lower would be the loss of economic stability resulting from the entrance in the single currency area.
As mentioned above, one way to assess the possibility of establishing an economic union is through the evaluation of the economic integration of product and factor markets. Indeed, in the beginning of 1999, most EU countries showed a significant extent of economic integration in the product markets, with a 10-20% export share between Member States, allowing room for gains in monetary efficiency with the formation of the EMU. Nevertheless, these values were smaller than the ones for US individual states. As to what concerns the labour market, there are many language and culture barriers in the EU that do not allow labour movement to reach the level of the US. Regarding the capital markets, it can be said that they are fully integrated in the EU.
De Grauwe (2011) argues that the EMU is not an OCA, but instead an incomplete monetary union, since it needs to be inbedded in a political union that requires a fiscal union. According to this author, one of the problems of the Euro area countries is the debt issuance in a foreign currency which they do not control. This way their central bank cannot operate as a lender of last resort and financial markets can force a country into default by driving it into a bad equilibrium. If investors fear that a default is possible, they start selling their bonds, lowering the price and raising the yields. Government expenditure with debt increases, making a default more likely (De Grauwe and Ji, 2014).
5
2.2. Euro Crisis
The international financial crisis of the late-2000s came to be known as the Great Recession. It started, in 2007, with the subprime crisis of the US and was preceded by a long period of credit growth, leveraging and development of bubbles in the real estate sector. As De Grauwe and Moesen (2009) put it, a period of “flight to
risk” in which rating agencies wrongly gave triple-A ratings to not so worthy assets. With the collapse of Lehman Brothers, in 2008, there was a financial meltdown in stock markets and a crisis of confidence between financial institutions, making investors seek to protect their investments in assets they considered the safest, traditionally sovereign bonds (European Commission, 2009). In the Euro area, this meant buying less bonds from the periphery countries and more bonds from countries
like Germany and France, widening the gap between yields, in a “flight to safety”
movement (De Grauwe and Moesen, 2009); (European Commission, 2009); (Gros and Micossi, 2009). At the same time, to avoid a debt deflation dynamics, governments were forced to take over excessive private debts (De Grauwe & Yi, 2009).
The ECB raised the Refinancing Rate in late 2008, soon after the FED started to cut the interest rates in the US, because the ECB’s mandate is to control the level of inflation at around but not higher than 2% (TFEU, 2008). The Appendix shows the comparison of interest rates from the FED and the ECB from 2007 to 2014.
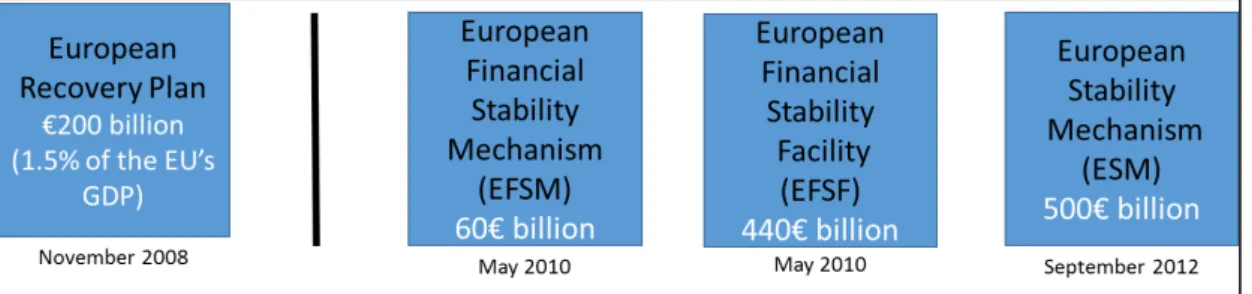
The first response to the crisis by European governments was to raise government expenditure and stimulate economic activity, by means of the European Recovery Plan, which included an economic stimulus of € 200 billion, equivalent to
1.5% of the EU’s GDP and an investment plan on energy efficiency and infrastructures
(European Commission, 2008).
6 On the other hand, European Banks had invested heavily in the American Subprime Market. Therefore, to avoid a financial collapse, many European governments had to bailout some of the banks, spending €1.6 trillion between 2008 and 2011, equivalent to 13% of the EU’s annual GDP (European Commission, 2014). However, most of the money for these bailouts had to be borrowed, so markets started to pay more attention to government deficits and public debts. Hence, a banking crisis spread to the sovereign debts. Because in the Euro area there is no lender of last resort, the sovereign debt crisis hit Euro area countries harder than the rest of the EU.
Banks and sovereign hedge funds typically buy large amounts of sovereign bonds, due to their low risk and volatility and their high liquidity. This type of asset is highly valued as collateral at the ECB (European Central Bank, 2013) and accepted by Basel III regulations (Basel Committee on Banking Supervision, 2011). However, the increased link between the sovereign and the domestic banks means that if the fiscal position of a sovereign deteriorates substantially, the quality of bonds as a collateral for banks is reduced, therefore risking their access to financing (European Commission, 2011). Furthermore, banks were over exposed to home country national debt bonds, which fed speculation about their solvency. In case of financial difficulties on a national bank, a sovereign would have to bail it out. This raises the yield on the bonds of the sovereign, making it more likely that it will have to bail out its banks, worsening its debt yields (The Euro-nomics Group, 2011).
For example, the strong exposure Irish banks had to the US subprime market, led to a bailout of some of them and to the collapse of others and, therefore, to the issuance of large volumes of debt in order to save Ireland’s financial sector (see the Appendix for the development of budget balance ratios, -32.5% in Ireland in 2010)4.
2.3. Government Bond Yields and Public Debt Developments
Recently the debate about debt mutualisation has somewhat faded, due to the low sovereign yields for most of the Euro area countries, which signals a better financial situation concerning their public finances. However, on 19 August 2015, the Greek government agreed to a third bailout programme (Council of the European Union, 2015), therefore being subject to a new financial aid package by the ESM and having
4 The Allied Irish Banks Group was nationalized on January 2009. Together with Bank of Ireland and
EBS (Education Building Society), the bailout of these three banks, reached €31 billion euros, between
7 agreed to several economic reforms including broadening the tax base for the VAT, spending cuts and reforms of the pension system (European Council, 2015). The European Commission and the ECB estimate that Greece will need financial assistance
for €82 billion until the end of 20185
(European Commission, 2015b).
At the time of the signing of the Maastricht Treaty in 1992, there were fundamental differences in monetary policies among the twelve countries that would constitute the EMU on 1 January 2002. By 1999, all government bond yields on the 10-year bonds were moving together, including Greece from 2001 onwards, when the country entered the EMU. The spreads were at a maximum 1-percentage point, down from a difference of more than 6 percentage points in 19936. This convergence is explained by the adoption of the Maastricht criteria and by the consequent reduction of inflation rates and fiscal imbalances (Swanson, 2008) (Ehrmann et al., 2008).
Sovereign debt yield spreads between 2001 and 2008 did not take into account the growing economic imbalances in the Euro area, as financial markets considered the risk of default to be the same for all Member States. During this period, the yields for Euro area countries were almost the same, with the exception of Luxembourg that managed to have lower yields than the rest of the Euro area countries (Figure 1). 7
The observed yield convergence was not due to a catching up or fiscal discipline, but rather to poor knowledge about this newly created market, which led investors to believe that the risk inherent to each country in the Euro area was the same.
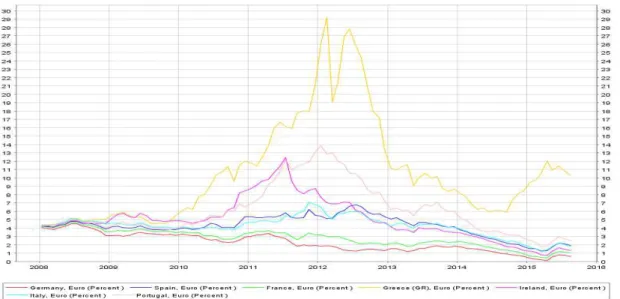
The detailed evolution of the government bond yields for Greece, Ireland, Italy, Portugal and Spain (GIIPS) and their contrast with the government bond yields for Germany and France, for 10-year maturity bonds, from January 2008 to July 2015, is shown in Figure 2. France and Germany are included in the graph, as since 2008, the bonds issued by these countries have been seen as a safe asset.
Greece, Portugal and Ireland were subject to financial assistance, Spain was subject to financial assistance only to its banking sector and Italy has had a very close attention by financial markets due to the size of its public debt. Both Spain and Italy are the two Euro area big economies that faced market scrutiny regarding their public debt
5 The ESM’s Forward Commitment Capacity is, as of 19 August 2015, €369.31 billion
(European Stability Mechanism, 2015).
6 If we include Greece, the yields difference in January 1993 was of more than 17 percentage points. 7
8 sustainability. In early 2015, the government bond yields on 10-year maturity bonds reached all-time lows, except for Greece, which was under an Adjustment Programme.
Figure 1 - 10-year government bond yields for the initial group of twelve Member States in the Euro area, from January 1993 to July 2015.
Source: ECB Statistical Data Warehouse 04/09/2015.
Figure 2 - 10-year government bond yields for a selected group of Member States in the Euro area, from January 2008 to July 2015
9 The following events help to explain the evolution of the bond yields in Figure 2:
Lehman Brothers bankruptcy -15/09/2008;
Greece reveals its 2008 budget was the double of previously disclosed - 05/11/2009;
Greece officially requests financial support - 23/04/2010; Ireland officially requests financial support - 21/11/2010; Portugal officially request financial support - 06/04/2011; Boost of EFSF lending capacity - 23/06/2011;
Statement by the Troika on Ireland - 14/07/2011;
Eurogroup agrees on second bailout to Greece - 21/02/2012;
Greece holds an election but fails to form a Government - 06/05/2012; Spain officially requests financial support to banks - 27/06/2012;
Eurogroup grants assistance to Spain’s banks and ECB suspends Greek bonds as
collateral - 20/07/2012;
Mario Draghi says: “... the ECB will do whatever it takes to save the Euro” - 26/07/2012;
Greek Parliament fails to elect new president - 23/12/2014;
The ECB announces the Quantitative Easing programme in the Euro area – 22/01/2015.
However, the events mentioned above do not fully explain each of the swings. The data on the figure is monthly, which means that the values for the graph are from month-end. This hides short-term volatility, which would be better depicted in a candle graph for which there is no accessible data (European Central Bank, 2015).
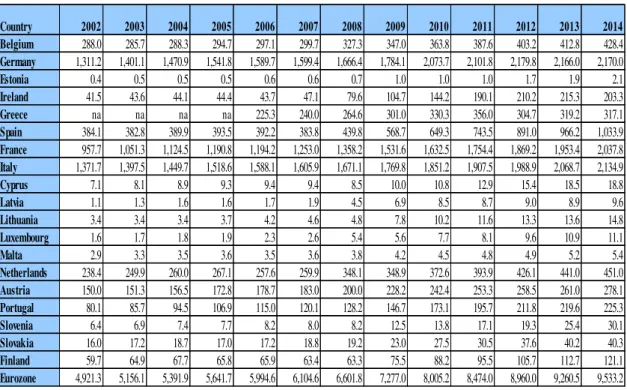
In the end of 2014, the levels of public debt in the Euro area were approximately
€9.5 trillion, compared to just €6.1 trillion in 2007, as shown in Table 1. Germany, France, Italy and Spain are currently the four countries with the biggest public debt in
the Euro area, all of them with a debt of more than €1 trillion. Despite this, France and
Germany did not have any sovereign debt crisis, due to their high levels of economic activity and competitiveness.
10 Belgium, which was the only country with a public debt/GDP ratio above 100%8 that was not subject to market attention, did not face a sovereign debt crisis, despite
having spent more than €128 billion, between 2008 and 2011, in the bailout of its
financial sector (European Commission, 2012). This is due to a combination of several factors that allowed this country to avoid an economic crisis and surging bond yields. Since 2008, Belgium has had small productivity growth, rising unit labour costs amidst a political crisis. Nevertheless, its financial system did not face any relevant bank flights, unemployment did not rise significantly, there was no housing bubble due to excessive building and Belgium maintained its net foreign asset position.
Table 1 - General government consolidated gross debt - Excessive deficit procedure (based on ESA 2010) (billions of euros)
Source: AMECO. Accessed: 05/05/2015. na – not available.
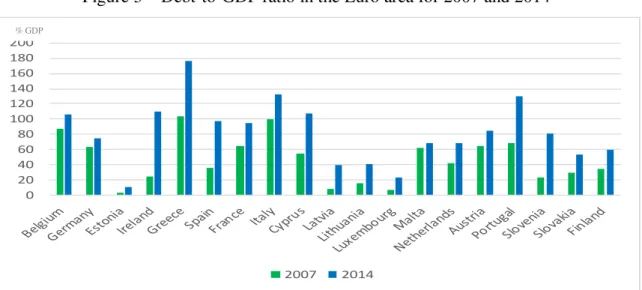
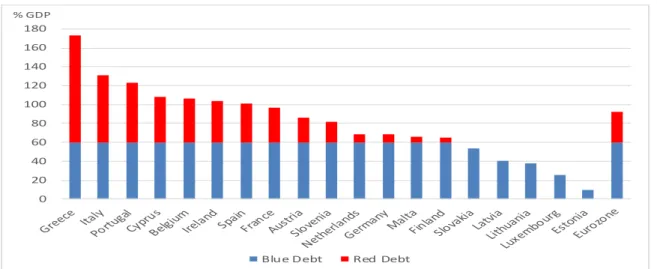
Estonia, Latvia, Lithuania, Luxembourg, Slovakia and Finland had, at end of 2014, a public debt to GDP ratio of less than 60%, with Estonia reaching a mere 10.6% of GDP9 (Appendix). Figure 3 compares the values for the debt to GDP ratio of the nineteen Euro area countries, for 2007 and 2014. The biggest increases in percentage points were registered in Ireland (24%-110%), Greece (103%-177%), Spain
8 See Appendix. 9
Finland is expected to have a ratio rise to 64.82% by the end of 2016 ( 3), since it is currently in an economic crisis (The Guardian, 2015).
Country 2002 2003 2004 2005 2006 2007 2008 2009 2010 2011 2012 2013 2014 Belgium 288.0 285.7 288.3 294.7 297.1 299.7 327.3 347.0 363.8 387.6 403.2 412.8 428.4
Germany 1,311.2 1,401.1 1,470.9 1,541.8 1,589.7 1,599.4 1,666.4 1,784.1 2,073.7 2,101.8 2,179.8 2,166.0 2,170.0
Estonia 0.4 0.5 0.5 0.5 0.6 0.6 0.7 1.0 1.0 1.0 1.7 1.9 2.1
Ireland 41.5 43.6 44.1 44.4 43.7 47.1 79.6 104.7 144.2 190.1 210.2 215.3 203.3
Greece na na na na 225.3 240.0 264.6 301.0 330.3 356.0 304.7 319.2 317.1
Spain 384.1 382.8 389.9 393.5 392.2 383.8 439.8 568.7 649.3 743.5 891.0 966.2 1,033.9
France 957.7 1,051.3 1,124.5 1,190.8 1,194.2 1,253.0 1,358.2 1,531.6 1,632.5 1,754.4 1,869.2 1,953.4 2,037.8
Italy 1,371.7 1,397.5 1,449.7 1,518.6 1,588.1 1,605.9 1,671.1 1,769.8 1,851.2 1,907.5 1,988.9 2,068.7 2,134.9
Cyprus 7.1 8.1 8.9 9.3 9.4 9.4 8.5 10.0 10.8 12.9 15.4 18.5 18.8
Latvia 1.1 1.3 1.6 1.6 1.7 1.9 4.5 6.9 8.5 8.7 9.0 8.9 9.6
Lithuania 3.4 3.4 3.4 3.7 4.2 4.6 4.8 7.8 10.2 11.6 13.3 13.6 14.8
Luxembourg 1.6 1.7 1.8 1.9 2.3 2.6 5.4 5.6 7.7 8.1 9.6 10.9 11.1
Malta 2.9 3.3 3.5 3.6 3.5 3.6 3.8 4.2 4.5 4.8 4.9 5.2 5.4
Netherlands 238.4 249.9 260.0 267.1 257.6 259.9 348.1 348.9 372.6 393.9 426.1 441.0 451.0
Austria 150.0 151.3 156.5 172.8 178.7 183.0 200.0 228.2 242.4 253.3 258.5 261.0 278.1
Portugal 80.1 85.7 94.5 106.9 115.0 120.1 128.2 146.7 173.1 195.7 211.8 219.6 225.3
Slovenia 6.4 6.9 7.4 7.7 8.2 8.0 8.2 12.5 13.8 17.1 19.3 25.4 30.1
Slovakia 16.0 17.2 18.7 17.0 17.2 18.8 19.2 23.0 27.5 30.5 37.6 40.2 40.3
Finland 59.7 64.9 67.7 65.8 65.9 63.4 63.3 75.5 88.2 95.5 105.7 112.7 121.1
11 98%), Cyprus (54%-108%), Portugal (68%-130%) and Slovenia (23%-81%). Although
their percentage points’ rises were lower, countries such as Latvia (8%-40%), Lithuania (16%-41%), Luxembourg (7%- 24%) saw their debt/GDP ratios more than double.
Figure 3 – Debt-to-GDP ratio in the Euro area for 2007 and 2014
Source: Authors’ elaboration on AMECO data.
A combination of banking sector bailouts and lower tax revenues help to explain the surge in the public debt to GDP ratio in Ireland, Greece, Spain, Cyprus and Portugal. The economic crisis created a spiral of lower economic activity, more unemployment, bigger social spending, less tax revenue, lowers demand and, consequently, less economic activity.
2.4. Crisis Resolution in the Euro area
Due to the financial problems, some EU countries were facing, in May 2010, the European Union and the Euro area countries established the European Financial Stability Mechanism (EFSM) and the European Financial Stability Facility (EFSF), two
temporary funds, the first with a lending capacity of €60bn and the latter €440bn (see Figure 3). The EFSM provides financial assistance to EU Member States, using the budget of the EU as a guarantee, while the EFSF serves only the Euro area countries and is backed-up by guarantees of these countries according to their share in the capital of the ECB. The EFSM provided Ireland with €22.5bn and Portugal with €24.3bn. The financial assistance to Ireland and Portugal via the EFSM was concluded in 2014. The EFSF provided financial assistance during the bailout of Greece, Ireland and Portugal. It
lent to Ireland €17.7bn and to Portugal €26bn and was part of the second bailout to
0 20 40 60 80 100 120 140 160 180 200
2007 2014
12
Greece providing the country with €130.9bn10 (European Commission, 2015a) (European Financial Stability Facility, 2015).
The European Stability Mechanism (ESM) replaced the EFSF, in October 2012, as the sole lender of the EU to the Euro area countries, focusing on regulation and effective economic surveillance, preventing future crisis. The ESM raises funds by issuing money market instruments, as well as medium and long-term debt with maturities up to 30 years. Meanwhile, the EFSF will continue to operate until it receives the repayments from beneficiary countries and makes the payments to the EFSF bondholders (European Stability Mechanism, 2015).
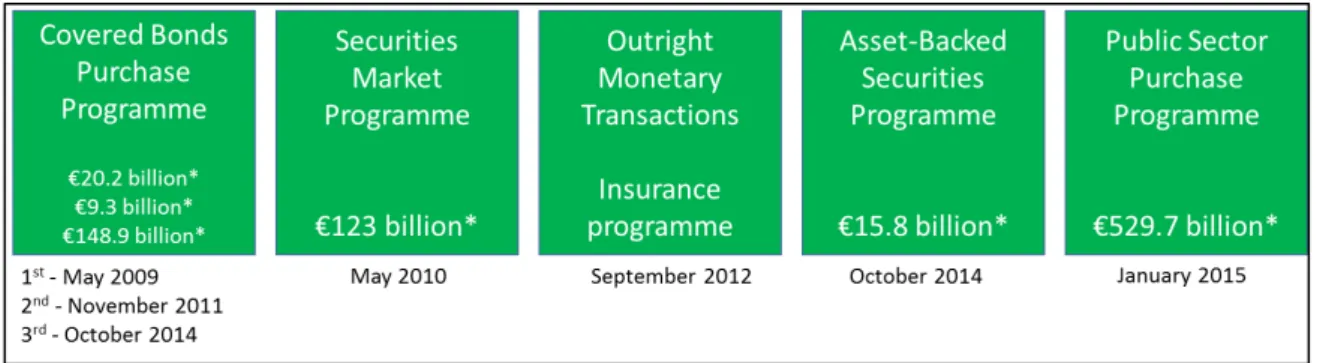
Figure 3 - Financial aid programmes and mechanisms in the European Union
During a press conference in July 2012, Mario Draghi, the ECB President said,
“Within our mandate, the ECB is ready to do whatever it takes to preserve the euro. And believe me, it will be enough” (Draghi, 2012). This prompted yields on bonds to decrease in all maturities for all Euro area countries.
Non-conventional monetary policies by the ECB, such as the Covered Bonds Purchase Programme (CBPP), the Securities Markets Programme (SMP), the Outright Monetary Transactions (OMT) programme, the Asset-Backed Securities Purchase Programme (ABSPP) and the Public Sector Purchase Programme (PSPP), have helped to further reduce the yields on bonds (European Parliament, 2014) (European Central Bank, 2016). Nevertheless, some Euro area countries still faced high debt/GDP ratios as shown in the Appendix.
On 7 May 2009, the ECB decided to introduce the Covered Bonds Purchase Programme (CBPP) with the aim of stabilizing this securities market and stabilise the financial system in the Euro area (see Figure 4). Under the first CBPP, the Eurosystem purchased bonds reaches an aggregate volume of €60 billion. The second CBPP was
10
13 launched in November 2011 and acquired a total volume of €16.4 billion in securities. The third CBPP started in October 2014. Under the Securities Markets Programme, the ECB bought bonds, especially sovereign bonds on the secondary markets. As at 22 January 2016, the SMP has an outstanding amount at amortised cost of €122.95 billion. At its peak, the programme had a total volume of €210 billion of holdings.
Figure 4 - ECB non-conventional monetary policy instruments
On September 2012, the Outright Monetary Transactions (OMT) programme replaced the SMP. Under this programme, the ECB buys sovereign bonds from euro area countries under EFSF/ESM programmes. No bonds have yet been acquired by the ECB under this programme, but the simple announcement of the decision to create it,
On September 2014, the ECB adopted the Asset-Backed Securities Purchase Programme (ABSPP). This financial instrument has the objective of enhancing the transmission of monetary policy by the purchase of ABSs on the primary and secondary market, to ensure inflation rates close but under 2%. (Bundesbank, 2016)
On 22 January 2015, the ECB’s Governing Council decided to create an
expanded Asset Purchase Programme (APP), which consists of the third covered bond purchase programme (BBPP3), the Asset-Backed Securities Purchase Programme (ABSPP) and the Public Sector Purchase Programme (PSPP). This expanded programme consists of monthly purchases of public and private sector securities of €60
billion per month, totalling more than €1.1 trillion from March 2015 to September 2016.
3. Debt Mutualisation 3.1. The Blue Bond Proposal
14 joint and several liabilities as senior sovereign debt, and that any remainingdebt should be issued as national and junior debt.
By means of the issuance of a common euro bond, the proposal foresees, for the senior (Blue Bonds), the creation of a big, liquid market with a low yield, most likely lower than the average of the yields of Euro area countries, and a higher yield for the junior (Red Bonds), which would include a risk premium. In case of default, the red tranche, being junior, would be affected first, and the blue tranche, being senior, would only be affected in case the default is not fully absorbed by the junior tranche. This implies a difference in the risk, leading to a difference in the interest rates paid for each tranche, further reinforced by market liquidity, since there would be an increase in demand for Blue Bonds and a decrease in demand for Red Bonds (Delpla and Jakob von Weizsäcker, 2010, 2011).
According to the authors, the Blue and Red Bonds scheme would reduce overall debt via a lower borrowing cost on the blue tranche and higher marginal costs of borrowing on the red tranche, which would contribute to fiscal discipline. Briefly, it is the combination of the liquidity effect on the blue tranche together with the fiscal discipline effect on the red tranche that guarantee an overall reduction on the cost of borrowing.
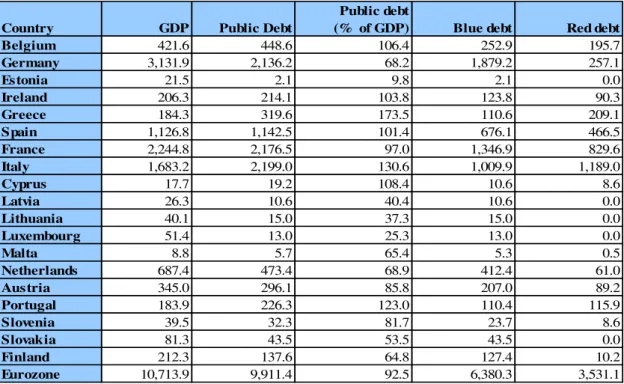
Figure 5 - 2016 forecast for the Blue Bond proposal.
Source: Authors’ elaboration on AMECO data
Based on the predictions of the European Commission for 2016, Figure 5 illustrates this proposal, which is based on the values from Table 2. Luxembourg,
0 20 40 60 80 100 120 140 160 180
Blue Debt Red Debt
15 Slovakia and the Baltic countries would not have the need to issue Red Bonds, while some countries as Greece, Italy and Portugal would have a Red Bond issuance superior to that for Blue Bonds. With this proposal, there would be a possible creation of a Blue
Bond market of around €6.3 trillion (Table 2).
Table 2 - The Blue Bond Proposal with predicted data for 2016 (billions of euros)
Authors’ elaboration based on data from AMECO. Estimated data for 2016, accessed on 05/05/2015.
Nevertheless, only countries with credible fiscal policies would be allowed to borrow up to 60% of GDP in Blue Bonds, while other countries, with weaker public accounts would only be allowed a lower percentage. In case a country participating in the Blue Bond scheme did not pursue credible fiscal policies, it would be gradually evicted from the scheme, via the gradual lowering of the Blue Bond allocation. Additionally, an Independent Stability Council (ISC) should be created, which would propose the Blue Bond annual allocation, subject to a voting procedure by Member States’ parliaments.
3.2. Partial Sovereign Bond Insurance
Dübel (2011) proposed a partial sovereign bond insurance based on the proposal by Jacques Delpla and Jakob von Weizsäcker. Dübel criticizes the 60% of GDP or any
Country GDP Public Debt
Public debt
(% of GDP) Blue debt Red debt
Belgium 421.6 448.6 106.4 252.9 195.7
Germany 3,131.9 2,136.2 68.2 1,879.2 257.1
Estonia 21.5 2.1 9.8 2.1 0.0
Ireland 206.3 214.1 103.8 123.8 90.3
Greece 184.3 319.6 173.5 110.6 209.1
Spain 1,126.8 1,142.5 101.4 676.1 466.5
France 2,244.8 2,176.5 97.0 1,346.9 829.6
Italy 1,683.2 2,199.0 130.6 1,009.9 1,189.0
Cyprus 17.7 19.2 108.4 10.6 8.6
Latvia 26.3 10.6 40.4 10.6 0.0
Lithuania 40.1 15.0 37.3 15.0 0.0
Luxembourg 51.4 13.0 25.3 13.0 0.0
Malta 8.8 5.7 65.4 5.3 0.5
Netherlands 687.4 473.4 68.9 412.4 61.0
Austria 345.0 296.1 85.8 207.0 89.2
Portugal 183.9 226.3 123.0 110.4 115.9
Slovenia 39.5 32.3 81.7 23.7 8.6
Slovakia 81.3 43.5 53.5 43.5 0.0
Finland 212.3 137.6 64.8 127.4 10.2
16 other moderate threshold for the Blue Bonds, considering this impossible to reach in a financial crisis, due to the rising yields of the Red Bonds, related to a “flight to safety” movement to Blue Bonds. Countries in a stressful situation would be pushed to the ESM. Therefore, investors, knowing this, would consider all bonds issued as Blue Bonds, fully protected by the ESM, with the respective consequences in terms of moral hazard.
As an alternative to this “full insurance” by the ESM, Dübel proposes a partial insurance of bonds with no volume limit, both on the principal and on the interest, moderating marginal debt issuance costs in a crisis, while preventing moral hazard problems and promoting responsible fiscal policies in normal times. This proposal suggests a partial insurance of both the principal and the interest, more specifically, via
a “dormant” senior-junior structure, which means that the junior bond is created only when the bond insurance is called. For this, Dübel proposes a 60% insurance on both the interest and the principal, while, for example, French banking industry proposes 50%, with 30c/€ paid in cash to lenders and 20c/€ paid via highly rated zero coupon bonds11.
The partial bond insurance avoids the 60% ratio limit (Figure 6) and has the advantage of reducing marginal borrowing costs during crisis scenarios, by means of treating the entire yield curve as equal, so that all the bonds issued would include a junior and a senior part.
The Blue Bond Proposal described above would create a kinked total debt market value curve, as shown in Figure 6. Below the 60% threshold, market value of debt would always be in accordance to financial markets12, not charging any risk premium. However, above the 60% threshold, market value of debt would fall, due to higher yields, which would then include a risk premium. Under the partial insurance proposal, all debt would include a risk premium, in accordance to a sovereign’s debt risk, promoting fiscal discipline at all debt levels, whilst the Blue Bond proposal, under the 60% threshold, would treat high-risk sovereign debt as low-risk.
11
Fédération Bancaire Française (2011), cited by Dübel, 2011.
12
17 Figure 6 - Market pricing of blue/red bonds vs. sovereign bonds partially insured by the
Euro area.
Source: (Dübel, 2011).
In a crisis, the marginal costs of issuing more debt would be much lower than with the Red Bonds and, during non-crisis periods, these costs would be sufficiently
high in order to maintain fiscal discipline. Dübel’s proposal leads to lower costs of
borrowing in a financial crisis with both the principal and the interest insured by the ESM. The sold bonds would include a junior part and a senior part and, therefore, in order to acquire the safe asset, an investor would have to buy the non-safe one. Partial insurance requires the payment of risk premium at any level of debt, while in the Blue Bond Proposal there is no risk premium below 60% of GDP. In a crisis, junior bonds can be restructured or a haircut can be possible, something to be determined by the ESM and the borrower, which would be subject to fiscal policies imposed by the lender.
3.3. European Safe Bonds
In September 2011, the Euro-nomics group13, an informal group of European economists, concerned with Europe’s financial problems and the lack of safe assets, decided to propose the so-called European Safe Bonds (ESB), referred to as ESBies. These bonds would be issued by a European Debt Agency (EDA), benefit from the
ECB’s anti-inflation commitment and would not require treaty changes or more fiscal
13
18 integration (The Euro-nomics Group, 2011). It is the authors’ opinion that Europe’s sovereign debt problem is the consequence of a world problem: the lack of safe assets. They refer that Europe, despite the size of its economy, the development of its financial markets and the fact that it homes one of the world’s reserve currencies, does not supply a safe asset that can rival the US Treasury Bonds.
In the absence of a European safe asset, bank regulators, policy makers and investors have treated bonds as riskless assets. This led to an exposal of banks to
sovereign risk, which then increased the countries’ probability of bailing out its banks, leading to higher sovereign bond yields and to a “flight to safety” between bonds of
different countries.
Figure 7 - 2015 EDA portfolio based on the ESBies proposal.
Source: Authors’ elaboration on AMECO data
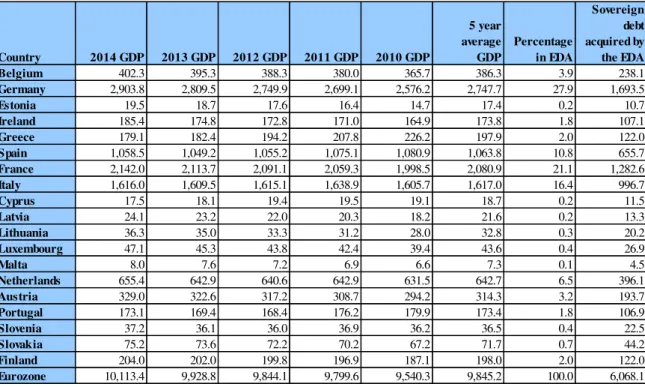
Based on this proposal, the EDA would buy 60% of Euro area’s GDP in
sovereign bonds14, according to the relative size of each Member State, measured by the average GDP of the previous five years. To finance this buying of bonds, the EDA would issue two securities: the first security, the ESBies, would have senior status, on both the principal and the interest; the second security would have a junior status, being hit first in the case of default. Figure 7 shows each country’s weight on the EDA’s sovereign bonds portfolio for 2015, using data between 2010 and 2014, presented in Table 3. Germany, France, Italy and Spain would have the higher country weight percentage of the EDA portfolio.
14€6.07
trillion, using Euro area GDP data between 2010 and 2014 (Table 3).
0 5 10 15 20 25 30
19 ESBies would be made even safer by means of initial payments made by Member States. The ECB, European banks, pension funds and sovereign wealth funds could be the natural clients of the senior tranche, whilst the junior tranche would be sold to investors such as hedge funds.
Table 3 - European Safe Bonds estimated for 2015 (billions of euros)
Authors’ elaboration based on data from AMECO. Gross domestic product at current prices. Accessed on 05/05/2015.
ESBies’ success, though, would be dependent on ECB regulation to grant them strict preferential treatment, as its main form of collateral in repo and discounting operations, and on other banking regulators to give them zero risk weight. The “flight to
safety” would be made from the junior tranche to the senior tranche, rather than from a country to another. Furthermore, there would be no need for guarantees from taxpayers or changes to the treaties.
3.4. European Redemption Pact
In their Annual Report 2011/2012, issued on 9 November 2011, the German Council of Economic Experts (GCEE) presented the European Redemption Pact (ERP) (German Council of Economic Experts, 2011). Contrarily to what is proposed by Delpla and von Weizsäcker, the GCEE proposes to transfer all debt above 60% of GDP to a
Country 2014 GDP 2013 GDP 2012 GDP 2011 GDP 2010 GDP
5 year average GDP Percentage in EDA Sovereign debt acquired by the EDA
Belgium 402.3 395.3 388.3 380.0 365.7 386.3 3.9 238.1
Germany 2,903.8 2,809.5 2,749.9 2,699.1 2,576.2 2,747.7 27.9 1,693.5
Estonia 19.5 18.7 17.6 16.4 14.7 17.4 0.2 10.7
Ireland 185.4 174.8 172.8 171.0 164.9 173.8 1.8 107.1
Greece 179.1 182.4 194.2 207.8 226.2 197.9 2.0 122.0
Spain 1,058.5 1,049.2 1,055.2 1,075.1 1,080.9 1,063.8 10.8 655.7
France 2,142.0 2,113.7 2,091.1 2,059.3 1,998.5 2,080.9 21.1 1,282.6
Italy 1,616.0 1,609.5 1,615.1 1,638.9 1,605.7 1,617.0 16.4 996.7
Cyprus 17.5 18.1 19.4 19.5 19.1 18.7 0.2 11.5
Latvia 24.1 23.2 22.0 20.3 18.2 21.6 0.2 13.3
Lithuania 36.3 35.0 33.3 31.2 28.0 32.8 0.3 20.2
Luxembourg 47.1 45.3 43.8 42.4 39.4 43.6 0.4 26.9
Malta 8.0 7.6 7.2 6.9 6.6 7.3 0.1 4.5
Netherlands 655.4 642.9 640.6 642.9 631.5 642.7 6.5 396.1
Austria 329.0 322.6 317.2 308.7 294.2 314.3 3.2 193.7
Portugal 173.1 169.4 168.4 176.2 179.9 173.4 1.8 106.9
Slovenia 37.2 36.1 36.0 36.9 36.2 36.5 0.4 22.5
Slovakia 75.2 73.6 72.2 70.2 67.2 71.7 0.7 44.2
Finland 204.0 202.0 199.8 196.9 187.1 198.0 2.0 122.0
20 common fund (ERF15), with joint and several liabilities. The proposed redemption pact would take between 20 to 25 years to be redeemed, following the Stability and Growth Pact’s rule of annual reductions of debt above 60% of GDP at the rate of 1/20, after which the ERF would cease its existence.
The so-called pact provides Euro area countries with the possibility of a roll-in of debt up to five years, in order to finance current funding needs, thus promoting strong fiscal discipline. Each country would be able to participate in the ERF up to the amount in excess of 60% of GDP observed at its adhesion to the ERP. Moreover, one condition to be met by participating countries requires that debt should not rise again above 60% of GDP, guaranteed by means of a debt brake on national Constitutions.
In order to secure its reasonable functioning, five rules need to be established:
1) each country should set a constitutional limit for the structural budget deficit at 0,5% of GDP16, after a transitional phase; this cap could be monitored by a European Agency such as the European Court of Auditors;
2) common strategy of public expenditure to ensure the ERF is only used up to 25 years17, with the inclusion of a clause to terminate the joint and several liability of new debt, should a country not meet the proposed objectives;
3) establishing a mark-up on a national tax to ensure the debt service to the Redemption Fund;
4) the use of reserves on the national central banks as collateral to guarantee 20% of each country’s debt in the fund;
5) Sharing scheme of any amount due by a single country under the joint and several liabilities, among all remaining solvent countries, due to a default by a country or group of countries.
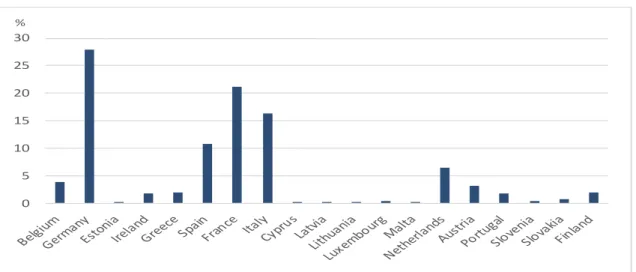
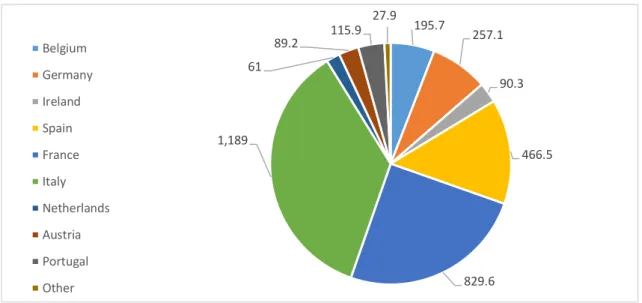
Using predicted data for 2016 from AMECO (Table 4), the size of the fund would
be of €3.3 trillion, with Italy accounting for the biggest share of the fund (35.8%), whilst other important contributors would be France (25%), Spain (14%) and Germany (7.73%) (Figure 8). Greece is not included because it was under a new Adjustment Programme, as of October 2015.
15
ERF – European Redemption Fund
16 As stipulated by the Treaty on Stability, Coordination and Governance in the EMU. 17
21 Figure 8 - Predicted Redemption Fund values (billions of euros, 2016) for Euro area
countries with a debt/GDP ratio above 60%
Source: Authors’ elaboration on AMECO data.
Table 4 - European Safe Bonds estimated for 2015 (billions of euros)
Authors’ elaboration based on data from AMECO. Estimated data for 2016 accessed on 05/05/2015. Greece would not be included in the ERP since it is currently under an Adjustment Programme. Malta’s percentage in the ERP is 0.015.
One of the key aspects of this pact is the structure of the interest rate and redemption payments, which should be defined accordingly to the economic cycle. The
195.7 257.1 90.3 466.5 829.6 1,189 61 89.2 115.9 27.9 Belgium Germany Ireland Spain France Italy Netherlands Austria Portugal Other
Country GDP Public debt
Public debt/GDP ratio
Debt up to 60% of GDP
Debt transfered to the ERP
Percentage in the ERP
Belgium 421.6 448.6 106.4 252.9 195.7 5.9
Germany 3,131.9 2,136.2 68.2 1,879.2 257.1 7.7
Estonia 21.5 2.1 9.8 12.9 0.0 0.0
Ireland 206.3 214.1 103.8 123.8 90.3 2.7
Greece 184.3 319.6 173.5 110.6 -
-Spain 1,126.8 1,142.5 101.4 676.1 466.5 14.0
France 2,244.8 2,176.5 97.0 1,346.9 829.6 25.0
Italy 1,683.2 2,199.0 130.6 1,009.9 1,189.0 35.8
Cyprus 17.7 19.2 108.4 10.6 8.6 0.3
Latvia 26.3 10.6 40.4 15.8 0.0 0.0
Lithuania 40.1 15.0 37.3 24.1 0.0 0.0
Luxembourg 51.4 13.0 25.3 30.8 0.0 0.0
Malta 8.8 5.7 65.4 5.3 0.5 0.0
Netherlands 687.4 473.4 68.9 412.4 61.0 1.8
Austria 345.0 296.1 85.8 207.0 89.2 2.7
Portugal 183.9 226.3 123.0 110.4 115.9 3.5
Slovenia 39.5 32.3 81.7 23.7 8.6 0.3
Slovakia 81.3 43.5 53.5 48.8 0.0 0.0
Finland 212.3 137.6 64.8 127.4 10.2 0.3
22 authors propose that payments could gradually be adjusted in the first five years, to the level of financing needed in the medium term, so that a country could accumulate the necessary primary surplus. Countries with high yields could benefit from the pact due to the interest rate advantage they will have on the debt placed in the fund. In the case of low yield countries, there might be an additional burden, which would, nonetheless, be limited by the liquidity of the created market.
3.5. Green Paper on the feasibility of introducing Stability Bonds
On 23 November 2011, the European Commission presented a “Green Paper on
the feasibility of introducing Stability Bonds18”, which included three proposals of debt mutualisation the Commission refers to as approaches (European Commission, 2011). Although there had been previously other documents and papers proposing Eurobonds19, the debate intensified with the Euro area sovereign debt crisis and the presentation of the Green Paper. Stability Bonds would work as both a short-term and long-term solution. The Commission acknowledged that the simple announcement of their introduction would reduce yields in the short-term. In the long-term, Stability Bonds would assure that no Member State would be out of the market, helping to reduce market volatility and eliminating the need for rescue measures to countries temporarily excluded from market financing.
The first proposal was a “Full substitution of Stability Bond issuance for national issuance, with joint and several guarantees”, via a common issuance of bonds expected to have a high credit rating, benefiting the countries with fiscal difficulties. The most efficient way of issuing these Stability Bonds would be through an agency, which would manage the needs of financing for each Member State, as well as gather interest and principal payments from each.
With this proposal, the liquidity problems of some Member States would be solved due to the creation of a big market for Stability Bonds that would rival the US Treasury Bond market. To avoid moral hazard problems, there would be the need to deepen the integration at the economic, financial and political level, as means to promote budgetary discipline, competitiveness and the catching up of the poorer economies with the richer.
18 Whilst in the public discussion the term “Eurobond” is used, the Commission, in line with its ex
-President José Manuel Barroso, refers to “Stability Bonds”.
19
23 The phasing-in of the Stability Bonds could occur in two ways. In the first option, Stability Bonds, rapidly creating a big liquid market for these bonds, would replace outstanding government bonds. Alternatively, there would be full or only partly issuance of new debt in Stability Bonds, with outstanding bonds remaining national until maturity. Therefore, the creation of the so-called big market could take longer and the benefits could be smaller in the beginning, but it would give the market time to adapt to the new bonds, minimizing risks of market disruption.
The second proposal of the Green Paper is a “Partial substitution of national issuance with Stability Bond issuance with joint and several guarantees”, which is in
fact a “blue-red approach”20. The threshold can be fixed at a more prudent level than 60% of GDP. This proposal is less ambitious than the previous one, delivering less financial benefits to highly indebted countries.
The third proposal of the Green Paper is somewhat very different from the
previous two and is probably the most politically acceptable. It is designated by “Partial
substitution of national issuance with Stability Bond issuance with several but not joint
guarantees”. The main difference from the second proposal lies in the fact that the Stability Bonds commonly issued would be a responsibility of each Member State, reducing moral hazard problems and would not require any treaty changes. Once more, a 60% of GDP debt limit would be used for the issuance of Stability Bonds. The common issuance would be beneficial in terms of reduced liquidity premium, enabling countries without access to the market to be able to issue debt. This would be a short-term solution, which would not solve euro sovereign debt crisis, but would be the most feasible and possibly the only, out of the three, politically acceptable.
In order to increase the acceptance of the Stability Bonds, Member States could provide seniority to Stability Bonds, with collateral such as currency reserves and gold, and mark-up a specific tax to service the Stability Bonds’ debt21. According to this proposal and under normal circumstances, the total cost of debt for a country would remain constant or fall, while its marginal cost of debt issuance would rise, helping to promote fiscal discipline.
Out of the three proposals, the first is the most ambitious one given the fact that it would be the best to fight the credit problems of several countries. Nevertheless, it
20 This proposal is in fact the Blue Proposal by Delpla and von Weizsäcker in which the Blue Bonds are
referred to as Stability Bonds.
21
24 would carry the biggest risk of moral hazard. The third proposal, contrarily to the previous two, would not require any treaty changes, but it would demand secondary legislation to establish the seniority status of the Stability Bonds.
3.6. Other proposals
Since 2009, there have been several other proposals concerning euro-denominated bonds, the so-called Eurobonds, to deal with distortions between the economies of the Euro area, especially concerning the differences between the Southern European Countries and Ireland, and the Northern European Countries. Besides the proposals described above, others types of proposals have also been presented (Claessens, Mody and Vallée, 2012).
One of the first proposals was presented by de Grauwe and Moesen (2009), who concluded that it was possible to create a common euro market for sovereign bonds, attractive not only to Germany but also to Greece, the prototype high-risk country (IMF, 2012).
Gros and Micossi (2009) urged the creation of a common European re-capitalization fund, as the EFSF, financed by EU, with bonds practically riskless and backed jointly by all Member States.
In the midst of the euro sovereign debt crisis, Hellwig and Philippon (2011) proposed the issuance of Eurobills, up to 10% of Euro area GDP, as debt with maturities of less than a year, to help crisis management, preventing liquidity crises and improving financial stability.
On January 2012, the ELEC22 proposed a four-year “Euro T-Bill Fund”, which uses debt instruments with maturities up to 2 years, after Member States sign the Treaty on Stability, Coordination and Governance (European League for Economic Cooperation, 2012). The Fund would borrow at the lowest rate available with a “joint
and several” guarantee. This short-term fund would be beneficial to restore competitiveness and sustainability of public finances.
More recently, Muellbauer (2013) proposed the use of “Euro-insurance-bonds”, which would have a joint guarantee. The debt issuance would be made via a European Debt Agency that would demand the payment of a risk premium to each country, in order to insure against default by any country. New debt issued in the Euro area, via
22
25 Eurobonds, would have a single price for investors, but different prices for each country.
4. An Alternative Proposal
Considering the proposals presented in Section 2, the blue and red bond concept seems the best one to apply to Euro area Member States, due to the current level of sovereign debt. The alternative proposal described below would have the Blue Bond Proposal as a basis. However, some adjustments need to be done to this proposal. Although stated in the Maastricht Treaty, the value of 60% GDP for blue bond limit lacks economic proof and even, the 90% level, described by Reinhart and Rogoff (2010) has not proved to be entirely consensual. For instance, Afonso and Jalles (2013), find endogenously that government indebtedness is detrimental to economic growth for a threshold debt ratio of 58% of GDP for the Euro area, and 79% for emerging countries.
Nevertheless, the bigger the Blue Bond market, the smaller the demand for Red Bonds, increases the cost with this kind of debt, implying serious debt issuance problems in countries with a high debt/GDP ratio. Due to this kind of problems, the new proposal would include several tranches. A comparison between the suggested proposal and the described proposals will also be made further below.
4.1. Blue, Yellow and Red Bonds Proposal
This paper presents a new debt mutualisation proposal, which would consist of three debt tranches. A Blue Bond, with senior status, which would include debt up to 60% of GDP and would enjoy joint and several liability; a Yellow Bond, with a second tier status, which would include debt between 60-90% of GDP and would be issued jointly between all Euro area Member States; and a Red Bond, which would be composed by all the remaining debt above 90% of GDP and would have national issuance.
26 Concerning current Euro area Member States’ government yields, with this new proposal there would be a fall in yields, especially in the debt up to 60% of GDP, which is estimated to be a €6.4 trillion market in 2016 (Figure 15). The debt between 60-90% of GDP, €2.2 trillion, would also have a low yield, but the relative fall would be smaller. Finally, the debt above 90% of GDP would have a higher cost at a higher level than proposed in the Maastricht treaty, in a market of €1.3 trillion and would contribute to an even more strict fiscal discipline.
Figure 9 and Table 5 show, for 2016, the allocation of bonds for the nineteen Euro area Member States, according to this scheme. For that year, it is estimated that eight countries – Belgium, Ireland, Greece, Spain, France, Italy, Cyprus and Portugal – will have a debt/GDP ratio above 90%, meaning they will be subject to the issuance on national bonds, while five countries will have a debt/GDP ratio between 60-90% - Germany, Malta, The Netherlands, Slovenia and Finland.
In order to ensure that no country would have an attitude of free riding in terms of the benefits of this proposal there would be the need to crease a clause to prevent any moral risk. This clause would determine the expulsion of a country from the access to blue and yellow bonds, if a country defaulted on its responsibilities regarding the blue and/or yellow bonds. Hence, there would be no situation in which a country would acquire blue and red bonds, benefiting from lower yields, but then only repay, if any,
the red bonds, which would be determined exclusively on the country’s macroeconomic
indicators.
27 Figure 9 - The Blue, Yellow and Red Bonds Proposal concerning the 19 Euro area
Member States using predicted data for 2016.
Source: Authors’ elaboration based on data from AMECO.
This proposal gives countries that are more indebted a bigger leeway to manage their public debt, given that most Euro area countries have a debt ratio higher than 60%.
Table 5 - The Blue, Yellow and Red Bonds Proposal with estimated data for 2016 (billions of euros)
Authors’ elaboration based on data from AMECO. Estimated data for 2016 accessed on 05/05/2015.
0 20 40 60 80 100 120 140 160 180 200
The Blue, Yellow and Red Bonds Proposal
Blue Bonds Yellow Bonds Red Bonds
Country GDP Public debt
Public debt
(% of GDP) Blue debt Yellow debt Red debt
Belgium 421.6 448.6 106.4 252.9 126.5 69.2
Germany 3,131.9 2,136.2 68.2 1,879.2 257.1 0.0
Estonia 21.5 2.1 9.8 2.1 0.0 0.0
Ireland 206.3 214.1 103.8 123.8 61.9 28.5
Greece 184.3 319.6 173.5 110.6 55.3 153.8
Spain 1,126.8 1,142.5 101.4 676.1 338.0 128.4
France 2,244.8 2,176.5 97.0 1,346.9 673.5 156.1
Italy 1,683.2 2,199.0 130.6 1,009.9 505.0 684.1
Cyprus 17.7 19.2 108.4 10.6 5.3 3.3
Latvia 26.3 10.6 40.4 10.6 0.0 0.0
Lithuania 40.1 15.0 37.3 15.0 0.0 0.0
Luxembourg 51.4 13.0 25.3 13.0 0.0 0.0
Malta 8.8 5.7 65.4 5.3 0.5 0.0
Netherlands 687.4 473.4 68.9 412.4 61.0 0.0
Austria 345.0 296.1 85.8 207.0 89.2 0.0
Portugal 183.9 226.3 123.0 110.4 55.2 60.7
Slovenia 39.5 32.3 81.7 23.7 8.6 0.0
Slovakia 81.3 43.5 53.5 43.5 0.0 0.0
Finland 212.3 137.6 64.8 127.4 10.2 0.0
Eurozone 10,713.9 9,911.4 92.5 6,380.3 2,247.1 1,284.1
28
4.2. Comparison of Proposals
The Blue, Yellow and Red Bonds proposal has specific characteristics that are improvements when compared to the proposals described in Section 3.
In comparison to the Blue Bond Proposal, the alternative presented in this paper adds a middle threshold, so that the costs with red debt are lower due to the higher liquidity of the debt between 60% and 90% of GDP. This means a lower over debt servicing, but not without a threshold, that holds back any fiscal policy loosening.
Dübel’s proposal creates a financial instrument that includes both insured and non -insured debt. Nevertheless, one of the biggest problems of this proposal is the fact that it increases the debt costs of countries with debt/GDP ratios that are unsustainable in the long-term. Under the new proposal, the cost of financial debt up to 60% will be lower and instead of a single yield, there would be three different yields.
As for the ESBies, their major flaw is the low fiscal discipline they impose. In case of a default, the impact on the yields would be absorbed by the fact that the bonds were sold by the EDA to investors, making the rise in yield lower, giving a bigger encouragement to moral hazard by countries. With the yellow tranche proposed in this paper, the fiscal policy coordination would allow for a more strict debt issuing that would not encourage any moral hazard actions.
The proposal regarding the European Redemption Pact is unrealistic. It would require countries to change their national Constitutions and demand a reduction of debt in a very fast pace, not compatible with the economic growth needed for the payment of that debt.
The first approach on the Green Paper by the European Commission can be considered politically impossible. It would require Euro area Member States to be responsible for the debt issued by any Member States in case of a default. Northern European countries would not accept a proposal that would be particularly beneficial for the Southern European countries. Besides the necessary treaty changes, it would carry significant risks of moral hazard, particularly concerning the GIIPS countries.
29 reaping low benefits from the common issuance. It would almost have no effect in lowering the costs of issuing debt.
Therefore, the Blue, Yellow and Red Bonds proposal presented in this paper, given the three tranches and the three different yields, leads to a better management of public debt with room for economic growth, without compromising fiscal discipline.
5. Conclusions
Several financial mechanisms were proposed by the European institutions to solve the sovereign debt crisis in the Euro area such as the EFSM and the EFSF, the Securities Market Programme, Outright Monetary Transactions and Quantitative Easing. Despite contributing to lower the government bond yields, these mechanisms have not solved the structural problem of high public debt values.
Debt mutualisation emerges as a possible solution, which allows concomitantly financial reforms and economic growth. Its main objective is to create a high liquidity market, which can rival the one for US Treasury Bills. Whatever the proposal for a common bond issuance, it would create an asset with high credit and low yields. The fiscal situation of many Euro area Member States implies more economic solidarity and a sharing of responsibilities, as well as a deeper coordination of economic policies.
The new alternative proposal presented in this paper – The Blue, Yellow and Red Bonds proposal - while considering other proposals described before, makes fiscal discipline more compatible with economic growth, by introducing the possibility of three tranches, with three different yields. The blue tranche would have a senior status, the yellow tranche a mid-senior status and the red tranche a junior status. The blue tranche would cove debt up to 60% of GDP and the yellow tranche would include debt from 60% up to 90% of GDP. Although not with joint liability, the rationale behind the Yellow Bonds with a joint issuance is the attraction of liquidity, which would be very beneficial, especially for the countries with high yields. The red tranche would affect all debt above 90% of GDP. It would have a high cost of issuance, considering the liquidity caught by the other two thresholds, meaning that this proposal should discourage a country to have a debt to GDP ratio over 90%. By giving more room to public management and lowering yields on the margin, this proposal eases austerity measures and allows governments to boost economic activity.
30 creating devastating social problems throughout some Euro area Member States. Given that most Euro area countries have a debt to GDP ratio higher than 60%, the new presented proposal gives highly indebted countries a bigger leeway to manage their public debt.
References
Afonso, A., Furceri, A. (2008). "EMU enlargement, stabilization costs and insurance mechanisms," Journal of International Money and Finance, 27(2), 169-187.
Afonso, A., Jalles, J. (2013). “Growth and Productivity: the role of Government Debt”, International Review of Economics and Finance, 25, 384-407.
Afonso, A., Arghyrou, M., Kontonikas, A. (2014). “Pricing sovereign bond risk in the EMU area: an empirical investigation”, International Journal of Finance and Economics, 19 (1), 49–56.
Basel Committee on Banking Supervision (2011) Basel III: A global regulatory framework for more resilient banks and banking systems, Basel: Bank for International Settlements.
Claessens, S., Mody, A. and Vallée, S. (2012) Paths to Eurobonds - WP/12/172, International Monetary Fund.
Council of the European Union (2009) Press Release - 2972nd Council meeting - Economic and Financial Affairs, Brussels:
http://www.europarl.europa.eu/committees/en/supporting-analyses-search.html.
Council of the European Union (2015) Eurogroup statement on the ESM programme for Greece, Brussels.
De Grauwe, P. (2011) 'The Governance of a Fragile Eurozone', CEPS Working Document, no. 346, May.
De Grauwe, P. (2013) 'The Political Economy of the Euro', Annual Review of Political Science, vol. 16, pp. 153-170.
De Grauwe, P. and Ji, Y. (2014) 'How much Fiscal Discipline in a Monetary Union?', Journal of Macroeconomics, vol. 39, pp. 348-360.
De Grauwe, P. and Moesen, W. (2009) 'Gains for All: A Proposal for a common Eurobond', CEPS Commentary, April.
Delpla, J. and von Weizsäcker, J. (2010) 'The Blue Bond Proposal', Brueguel Policy Brief, no. 03, May.
31 Draghi, M. (2012) 'Verbatim of the remarks made by Mario Draghi - Speech by Mario Draghi, President of the European Central Bank at the Global Investment Conference in London - 26 July 2012', London.
Dübel, H.-J. (2011) 'Partial sovreign bond insurance by the eurozone: A more efficient alternative to blue (Euro-)bonds', CEPS Policy Brief, no. 252.
Ehrmann, M., Fratzscher, M., S. Gürkaynak, R. and T. Swanson, E. (2008) Convergence and Anchoring of Yield Curves in the Euro Area, Frankfurt: European Central Bank.
European Central Bank (2013) Collateral Eligibility Requirements - A Comparative Study Across Specific Frameworks, Frankfurt.
European Central Bank (2015) ECB euro crisis timeline, [Online], Available:
https://www.ecb.europa.eu/home/html/index.en.html [04 Sep 2015].
European Commission (2008) COM(2008) 800 final - Communication from the Commission to the European Council - A European Recovery Plan, Brussels, Available: http://ec.europa.eu/economy_finance/publications/publication13504_en.pdf.
European Commission (2009) European Economy - 7/2009 — Economic Crisis in Europe: Causes, Consequences and Responses, Luxembourg.
European Commission (2011) COM(2011) 818 final - Green Paper on the feasibility of introducing Stability Bonds, Brussels.
European Commission (2012) Commission Staff Working Paper - SEC(2012) 443 final, Brussels.
European Commission (2014) MEMO/14/244 - A comprehensive EU response to the financial crisis: substantial progress towards a strong financial framework for Europe and a banking union for the eurozone, Brussels.
European Commission (2015a) European Commission - Economic and Financial Affairs - European Financial Stability Mechanism, [Online], Available:
http://ec.europa.eu/economy_finance/eu_borrower/efsm/index_en.htm [02 Apr 2015]. European Commission (2015b) Greece - request for stability support in the form of an ESM loan, Brussels.
European Council (2009) European Council - EUCO 6/09 - 10/11 December 2009 - Conclusions, Brussels.
European Council (2010) EUCO 7/10 - European Council 25/26 March 2010 - Conclusions, Brussels.
European Council (2015) Euro Summit Statement - SN 4070/15, Brussels.
European Financial Stability Facility (2015), [Online], Available:
http://www.efsf.europa.eu/about/operations/index.htm [02 Apr 2015].
32 European Parliament (2014) The (not so) Unconventional Monetary Policy of the European Central Bank since 2008, Brussels: Directorate General For Internal Policies. European Primary Dealers Association (2008) A Common European Government Bond, Securities Industry and Financial Markets Association, Available: http://www.sifma.org/WorkArea/DownloadAsset.aspx?id=20932.
European Stability Mechanism (2015), [Online], Available:
http://www.esm.europa.eu/about/index.htm [02 Apr 2015].
Financial Times (2015) Germany sells five-year debt at negative yield, 25 Feb, [Online], Available:
http://www.ft.com/intl/cms/s/0/84a1ddc8-bce5-11e4-9902-00144feab7de.html#axzz3mB89ueD3 [25 May 2015].
Financial Times (2015) What’s the deal with Belgium?, 20 Aug, [Online], Available:
http://ftalphaville.ft.com/2015/08/20/2137566/whats-the-deal-with-belgium/ [20 Aug 2015].
German Council of Economic Experts (2011) 'European redemption pact', Annual Report 2011/2012 - "Assume Responsability for Europe", November, pp. 106-114. Giovannini Group (2001) Cross-border clearing and settlement arrangements in the European Union, Brussels: European Commission.
Gros, D. and Micossi, S. (2009) A bond-issuing EU stability fund could rescue Europe, Europe's World February, [Online], Available: http://europesworld.org/2009/02/01/a-bond-issuing-eu-stability-fund-could-rescue-europe/#.VfhezhFViko.
Hellwig, C. and Philippon, T. (2011) 'Eurobills, not Eurobonds', Centre for European Policy Research, December.
Honohan, P. (2011) 'Recapitalisation of failed banks – some lessons from the Irish experience', 44th Annual Money, Macro and Finance Conference, Dublin.
IMF (2012) Paths to Eurobonds - WP/12/172, IMF.
Krugman, P., Obstfeld, M. and Melitz, M. (2012) International Economics - Theory and Policy, 9th edition, Global: Pearson.
Meullbauer, J. (2013) 'Conditional Eurobonds and the Eurozone Sovereign Debt Crisis', Univerisity f Oxford- Department of Economics- Discussion Paper Series.
Mundell, R. (1961) 'A theory of optimum currency areas', American Economic Review, vol. 51, pp. 657-665.
Reinhart, C. and Rogoff, K. (2010) Growth in a Time of Debt, Cambridge, MA.
Swanson, E.T. (2008) 'Convergence of Long-Term Bond Yields in the Euro Area', FRBSF Economic Letter, no. 37.
TFEU (2008) Consolidated version of the Treaty on the Functioning of the European Union art. 127, O.J. C 115/47.
33 The Guardian (2015) Finland after the boom: 'Not as bad as Greece, yet, but it's only
matter of time', 15 Apr, Available: