UNIVERSIDADE TÉCNICA DE LISBOA
INSTITUTO SUPERIOR DE ECONOMIA E GESTÃO
Mestrado em Economia e Estudos Europeus
T
HE
E
ASTERN
E
NLARGEMENT OF THE
E
UROPEAN
U
NION AND THE
C
OHESION
C
OUNTRIES
: C
OMMODITY
C
OMPOSITION OF
T
RADE IN
M
ANUFACTURES AND
T
RADE
P
OTENTIAL
ENRIQUE MARTÍNEZ GALÁN
Orientação de: Prof. Maria Paula Fontoura Carvalhão Sousa
Júri:
Presidente: Doutora Maria Paula Fontoura Carvalhão Sousa, professora
associada com agregação do Instituto Superior de Economia e Gestão da Universidade Técnica de Lisboa;
Vogais: Doutora Ana Paula Africano de Sousa e Silva, professora auxiliar
da Faculdade de Economia da Universidade do Porto;
Doutora Isabel Maria Dias Proênça, professora auxiliar do Instituto Superior de Economia e Gestão da Universidade Técnica de Lisboa.
Mestrado em Economia e Estudos Europeus
T
HE
E
ASTERN
E
NLARGEMENT OF THE
E
UROPEAN
U
NION AND THE
C
OHESION
C
OUNTRIES
: C
OMMODITY
C
OMPOSITION OF
T
RADE IN
M
ANUFACTURES AND
T
RADE
P
OTENTIAL
ENRIQUE MARTÍNEZ GALÁN
SOB A ORIENTAÇÃO DE:
Prof. Maria Paula Fontoura Carvalhão Sousa
TABLE OF CONTENTS...2
TABLE OF CONTENTS...3
ACKNOWLEDGEMENTS...6
ACRONYMS ...8
ABSTRACT...10
RESUMO...11
TABLES AND GRAPHS...12
EQUATIONS...15
INTRODUCTION ...16
I PART I...21
I.1 CHAPTER I - COMPREHENSIVE DESCRIPTION OF THE FOREIGN TRADE STRUCTURES INVOLVING THE CENTRAL AND EASTERN EUROPEAN COUNTRIES AND THE UE15...22
I.1.1 Bilateral Trading Flows involving the CEEC and the EU15...24
I.1.2 Specific Bilateral Trading Flows involving both the CEEC and the CC...26
I.1.3 The Irish Specificity ...32
I.1.4 Sectoral Division of Trading Flows ...33
Comparative Statics... 38
I.1.5 Degree of Concentration of Trading Flows...40
I.2 CHAPTER II - ANALYSIS OF THE BILATERAL COMMODITY COMPOSITION OF TRADE IN MANUFACTURES INVOLVING THE CEEC AND THE EU15 FOR THE PERIOD 1999-2002 ...43
I.2.1 Literature Review ...44
I.2.2 Comparative Analysis of Trade Similarity Indexes...50
I.2.3 Static Empirical Results obtained for the Average Value of the period ranging from 1999 to 2002 ...53
Sectoral Divisions... 59
I.2.4 Comparative Statics as regards to Empirical Results obtained for 1999 and 2002...61
II.1.1 Theoretical Heritage of the Gravity Equation...74
II.1.2 Empirical Cumulated Experience...76
II.1.3 The Evolution of the Baseline Gravity Model’s Specification for Cross-Section Data ...78
II.1.4 The Evolution of the Baseline Gravity Model’s Specification for Pooled Data...88
II.1.5 The Evolution of the Baseline Gravity Model’s Specification for Panel Data...99
II.1.6 The Evolution of Data Application, Variables and Units... 100
II.2 CHAPTER II – ESTIMATION AND SPECIFICATION ISSUES... 113
II.2.1 Estimation Results on Cross-Section Data... 113
OLS concerning Exporting Bilateral Flows... 113
OLS concerning Importing Bilateral Flows... 118
PML concerning Exporting Bilateral Flows... 121
PML concerning Importing Bilateral Flows... 123
II.2.2 Estimation Results on Pooled Data ... 125
OLS Pooling Cross-Section Data Across Time... 125
First-Differenced Model... 128
Poisson Pseudo-Maximum Likelihood Estimator... 130
Poisson Pseudo-Maximum Likelihood Estimator including time dummies... 132
II.2.3 Estimation Results on Panel Data ... 132
Fixed-Effects and Random Effects Models... 132
Instrumental Variables Method... 135
Poisson Pseudo Maximum Likelihood Estimator... 138
II.2.4 Actual and Potential Trade Flows ... 138
Net Bilateral Trading Flows in Manufactures and Implications on respective Trade Balances... 149
II.3 CHAPTER III – LIMITATIONS OF THE ANALYSIS AND SUGGESTIONS FOR FUTURE RESEARCH... ... 153
CONCLUSION... 158
Trade adjustment ... 158
Other adjustments... 163
III.1.1 Definitions of Variables... 169
III.1.2 Countries Included in the Data Set ... 171
III.2 TABLES... 172
BIBLIOGRAPHY ... 198
First of all, I would like to express my appreciation to the Portuguese Agency for the Promotion of Science and Technology (FUNDAÇÃO PARA A CIÊNCIA E TECNOLOGIA) for awarding me a National Grant for Investigation under the EUROPEAN SOCIAL FUND’s Operative Programme for Science, Technology and Innovation (Measure 1.1), within the Third Community Support Framework, which financially enabled me to undertake this study.
Furthermore, I would also like to express my infinite gratitude to Prof. MARIA ANTONINA LIMA, for her encouraging kick-off in choosing and tackling this defying ground of analysis, and mostly to both Professors ISABEL PROÊNÇA and MARIA PAULA FONTOURA, for their inestimable scientific orientation and invaluable support throughout this year, enabling me to manage this project in the most efficient way.
I am also greatly indebted to several of my former professors at ISEG-UTL, namely Prof. ANTÓNIO ROMÃO, Prof. JOÃO FERREIRA DO AMARAL and Prof. ÁLVARO PINA, who shaped the way I think about economics. My greatest debt is, however, to Jean Monnet’s Chair Professor ANTÓNIO GOUCHA SOARES, whose ideas about the European Union politics have had a profound influence on my thinking.
namely Mr. MICHELLE CASARELLA and Ms. VITTORIA CARBONE.
I also acknowledge the kind permission to use previous calculation results from Mr. NUNO CRESPO and the always-interesting comments and advices given by Ms. SMARZYNSKA JAVORCIK, from the World Bank’s Development Economics Research Group.
I would also like to thank my parents, MARY FÉ and PABLO, for their support, faith, love and encouragement, not only throughout this study, but also during my whole lifetime.
Finally, I would like to express my infinite gratitude to my fiancée DANIELA, for her substantive comments and always present ideas, her patience, good humour and love.
2SLS Two Stage Least Square estimator.
CC Cohesion Countries, to be precise Spain, Ireland, Portugal and Greece.
CCT Commodity Composition of Trade.
CEEC Central and Eastern European Countries, that is to say the following:
Latvia, Lithuania, Estonia, the Czech Republic, Slovakia, Slovenia, Poland, Romania, Bulgaria and Hungary.
CEEC1 Relatively high PIB per capita Central and Eastern European Countries, that is to say the following: Slovenia, the Czech Republic, Hungary, Slovakia and Poland.
CEEC2 Relatively low PIB per capita Central and Eastern European Countries, that is to say the following: Estonia, Lithuania, Latvia, Romania and Bulgaria.
CN Combined Nomenclature, defined by the structure of the European
Commission foreign trade database known as Comext.
COS Cosine Measure.
EEC European Economic Community, defined as the existent institutional
structure until the European Single Act in 1986.
EIS Export-Import Similarity Index.
EMU Economic and Monetary Union, formed by the countries that share the
Euro as their single currency unit, namely Portugal, Spain, France, Germany, Belgium, the Netherlands, Austria, Finland, Luxembourg, Ireland, Italy and Greece.
EU European Union formed by twenty-five countries, i.e. from 1st May 2004
henceforth.
EU11 European Union excluding CEEC, CC, Malta and Cyprus, namely the
following set of countries: Germany, France, United Kingdom, Italy, Belgium, the Netherlands, Luxembourg, Sweden, Austria, Finland and Denmark.
EU12 European Union as set up by the Maastricht Treaty.
EU15 European Union excluding CEEC, Malta and Cyprus, namely the
EU25 Current European Union, excluding Malta and Cyprus, but including Romania and Bulgaria.
FDI Foreign Direct Investment.
FEM Fixed-Effects Model.
FGLS Feasible Generalised Least Squares.
GDP Gross Domestic Product.
GMM Generalised Method of Moments.
GNP Gross National Product.
IV Instrumental Variables, namely Two Stage Least Square estimator.
MER Market Exchange Rates.
NACE Classification of Economic Activities in the European Community.
OLS Ordinary Least Squares.
PML Poisson Pseudo-Maximum Likelihood Estimator.
PPP Purchasing Power Parity.
REM Random-Effects Model.
RoW Rest of the World, excluding EU25.
TSI Trade Similarity Indexes.
WLS White’s heteroskedasticity-consistent co-variance matrix within OLS
method.
n order to evaluate the trade potential of the Cohesion Countries (CC) with the remaining EU11 countries in the threshold of the eastern enlargement of the European Union, as well as with the CC relations with the Central and Eastern European Countries (CEEC), we use a gravity model. The manufacturing trade potential related to the twenty-five countries involved in the eastern enlargement of the EU15 is hence calculated from 1999 to 2002. Special attention is paid to this enlargement’s effect on the CC within this approach.
Relatively to previous studies with this same methodological approach, this dissertation is, to the best of our knowledge, the first combining a trade potential based on the gravity model with the inclusion of a variable related to the Commodity Composition of Trade (CCT) in terms of manufactures. Several CCT variables were tested for the available data, taking into consideration high levels of disaggregation.
Finally, having in consideration the latest academic debate in course, we analysed and tested all the methodological contributions recently proposed in the literature as regards to the improvement of the econometric specification of the gravity model, namely making use of the Poisson Pseudo-Maximum Likelihood Estimator. The refinement of the explanatory variables considered in the analysis, specifically those related to the distance measurement, as well as the introduction of new variables, were also taken into consideration.
Keywords: Economics of Integration and Transition, Central and Eastern European Countries, Trade Potential, Gravity Model, Panel Data, Commodities Composition of Trade in Manufactures.
JEL (Journal of Economic Literature) Classification System: C23, F14, F15, F17, O57 and P52.
om o intuito de avaliar o potencial de comércio existente entre os Países da Coesão e os restantes países membros da UE15 no limiar do alargamento desta última a leste e, de igual forma, entre os PC e os denominados como Países da Europa Central e Oriental (PECO), fazemos uso de um modelo gravitacional. Assim, o potencial de comércio em termos de manufacturas relacionado com os vinte e cinco países envolvidos no processo do alargamento a Leste da UE15 foi calculado, nesta dissertação, no que diz respeito ao período que medeia entre 1999 e 2002. Neste contexto, especial atenção foi colocada nos efeitos específicos deste alargamento nos Países da Coesão.
Relativamente aos estudos prévios que fazem uso desta mesma abordagem metodológica, esta dissertação é, segundo a nossa percepção, a primeira a combinar o cálculo do potencial de comércio, tendo por base um modelo gravitacional, com a inclusão, neste último, de uma variável relativa à Composição do Comércio em Manufacturas (CCM). Vários indicadores da CCM foram, a este respeito, testados a partir dos dados disponíveis e fazendo uso de níveis detalhados de decomposição.
Finalmente, aprofundar-se-á o debate em curso, quer em termos empíricos, quer em termos académicos, através da análise e teste das mais recentes contribuições propostas no que diz respeito à melhoria da especificação econométrica do modelo gravitacional, nomeadamente com recurso ao Pseudo-estimador de Máxima Verosimilhança do Tipo Poisson. O refinamento das variáveis explicativas consideradas na análise, especificamente aquelas relacionadas com a mensuração da variável distância, e a introdução de novas variáveis foram igualmente abordadas.
Palavras-chave: Economia da Integração e da Transição, Países da Europa Central e Oriental, Potencial de Comércio, Modelo Gravitacional, Dados em Painel, Composição do Comércio em Manufacturas.
Sistema de Classificação JEL: C23, F14, F15, F17, O57 e P52.
TABLES
Table I-1 – Dynamics of PC’s per capita GDP measured according to PPP as EU15 average ... 32 Table I-2 – Relative weight in exporting values to EU15 in 2001, following PENEDER (2001)’s factor-input and labour-skill criteria and also demand-dynamism criterion (6-digit CN)... 35
Table I-3 – “Evolution of the relative weight in exporting values to EU15” in percentual points from 1999 to 2001 following PENEDER (2001)’s factor-input and labour-skill criteria and also demand-dynamism criterion (6-digit CN) ... 39
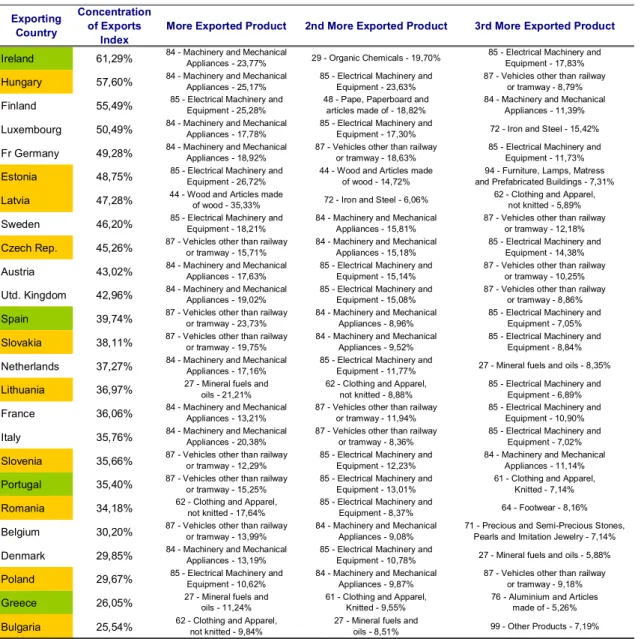
Table I-4 – Export Concentration Ratios (1999-2002 Average)... 41
Table I-5 – Mean and Volatility of both indexes, measured by the simple arithmetic average and the variance of their results (1999-2002 Average for either 2-digit and 6-digit Comext’s CN) ... 52 Table I-6 – EISij mean, maximum and minimum values for importing countries (1999-2002 Average and 6-digit Comext’s CN) ... 55
Table I-7 – EISij Mean, maximum and minimum values for exporting countries (1999-2002 Average and 6-digit Comext’s CN) ... 58 Table I-8 – EISij mean values for exporting countries, following PENEDER (2001)’s factor-input and labour-skill criteria and also demand-dynamism classifications (6-digit CN) ... 60
Table I-9 – Dynamic analysis of the EIS evolution, by comparing 1999 and 2002 average EIS figures, either for importing and exporting flows... 62
Table I-10 – Average EISij for the CEEC as importing countries (1999-2002 Average and 6-digit Comext’s CN) ... 65
Table I-11 – Dynamic analysis of the EIS evolution, by comparing 1999 and 2002 average EIS figures for CEEC as importing countries (6-digit Comext’s CN) ... 66
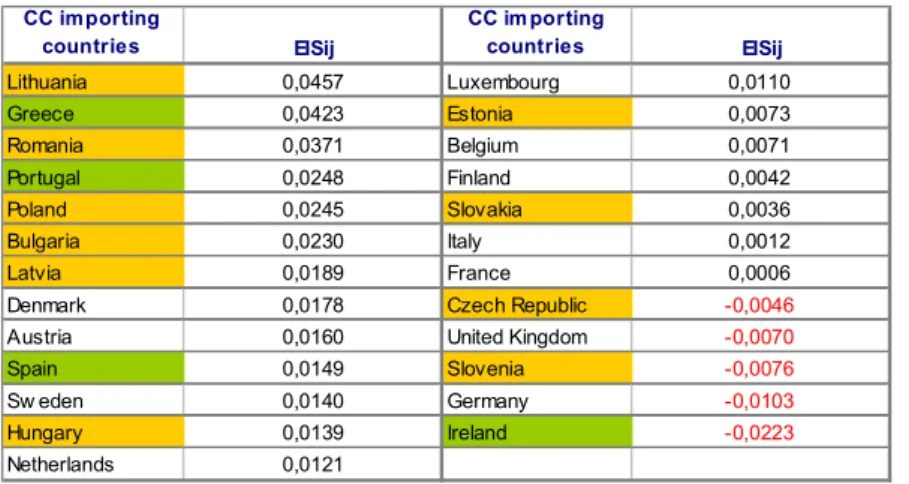
Table I-12 – Average EISij for the CC as importing countries (1999-2002 Average and 6-digit Comext’s CN) ... 67
Table I-13 – Dynamic analysis of the EIS evolution, by comparing 1999 and 2002 average EIS figures for CEEC as importing countries (6-digit Comext’s CN) ... 68
Table II-1 – Significant Cross-Section Gravity Models as regards to Exporting flows (years 1999 to 2002) ... 114
Table II-2 – Significant Cross-Section Gravity Models as regards to Importing flows (years 1999 to 2002) ... 118
to Importing and Exporting flows (years 1999 to 2002)... 125
Table II-6 – Significant First-Differenced Model making use of Pooled Data as regards to Importing and Exporting flows (years 1999 to 2002)... 129
Table II-7 – Significant Poisson Pseudo-Maximum Likelihood Estimator Model making use of Pooled Data as regards to Importing and Exporting flows (years 1999 to 2002) ... 130
Table II-8 – Significant Poisson Pseudo-Maximum Likelihood Estimator Model making use of Pooled Data and including time dummies as regards to Importing and Exporting flows (years 1999 to 2002) ... 132
Table II-9 – Significant Simple Fixed-Effects and Random-Effects Models making use of Panel Data as regards to Importing and Exporting flows (years 1999 to 2002)... 133
Table II-11 – Significant Instrumental Variables Model making use of Panel Data as regards to Importing and Exporting flows (years 1999 to 2002)... 137
Table II-13 – Estimated Manufacture Exporting Trade Flows in 2002 (in brackets as € billions) and its Relative Meaning when Compared to the Actual Manufacture Exporting Trade Flows in 2002 (in %) ... 144
Table II-14 – Estimated Manufacture Exporting Trade Flows From the CEEC to the CC in 2002 (€ millions) and its Relative Meaning when Compared to the Actual Manufacture Exporting Trade Flows From the CEEC to the CC in 2002 (%)... 147
Table II-15 – Estimated Manufacture Exporting Trade Flows From the CC to the CEEC in 2002 (€ millions) and its Relative Meaning when Compared to the Actual Manufacture Exporting Trade Flows From the CC to the CEEC in 2002 (%)... 148
Table II-16 – Comparison between Potential Trade Balance (in bold) and Verified Trade Balance (in brackets) as regards to the Manufacturing trade balances involving the CEEC and the CC in 2002 (€ millions)... 149
Table II-17 – Comparison between Potential Trade Balance (in bold) and Verified Trade Balance (in italic and into brackets) as regards to the Manufacturing trade balances involving the CEEC and the CC in 2002 (% GDP) ... 151
Table III-1 – Gross Domestic Product per capita measured either at current market prices or at PPP, for 2002... 172
Table III-2 - Trade Relationship between CEEC and EU15, sorted by 2-digit Comext’s CN (in thousands of euro) ... 173
Table III-3 – Share of each one of the Central and Eastern European Countries within the CEEC total trade flows related to the EU15 ... 174
Table III-4 – Detailed External Trade of the CEEC (2002) ... 174
Table III-5 – Detailed External Trade of the EU (2002) ... 186
Table III-6 – Detailed External Trade of the CC (2002) ... 187
Table III-10 – COSij mean, maximum and minimum values for importing countries (1999-2002 Average and 6-digit Comext’s CN)... 194
Table III-11 – Yearly average distribution of both Structural and Cohesion Funds (€ Million, 1999 prices)... 195
Table III-12 – Penetration of FDI in the CEEC and the CC – Annual Inward FDI stock as % of GDP... 195 Table III-13 – Geographical Origin of the Stock of FDI received by recent EU adherent countries (until December 1999) ... 196
Table III-14 – Average Wages per worker in the manufacturing sector in the CEEC (EU=100) ... 196
Table III-15 – Percentage of the Total Population Aged 25 to 64 Having Completed at Least Upper Secondary Education ... 197
Table III-16 – Supply of Qualified Labour Force Index ... 197
GRAPHS
Equation I-1 – Allen’s Original COS measure... 46
Equation I-2 – Linnemann’s COS measure... 46
Equation I-3 – MACDOUGALL’s EIS measure... 47
Equation I-4 – FINGER & KREININ’s measure... 48
Equation I-5 – EIS measure adapted from FINGER & KREININ’s measure... 49
Equation I-6 – GRUBEL & LLOYD’s Intra-Industry Trade Index in its Amended Form by AQUINO ... 50
Equation II-1 – Deterministic Baseline Gravity Model ... 79
Equation II-2 – Stochastic Baseline Gravity Model ... 79
Equation II-3 – Linear Stochastic Baseline Gravity Model... 80
Equation II-4 – Linear Stochastic Augmented Gravity Model... 80
Equation II-5 – Linear Stochastic Augmented Gravity Model by LINDER... 82
Equation II-6 – Linear stochastic augmented gravity model in its product form ... 83
Equation II-7 – Linear stochastic augmented dynamic gravity model (with hysteresis) 84 Equation II-8 – Linear stochastic augmented gravity model with price variables ... 84
Equation II-9 – Linear stochastic full gravity model... 85
Equation II-10 – Multiplicative Stochastic Full Gravity Model... 86
Equation II-11 – Alternative Multiplicative Stochastic Full Gravity Model according to the Poisson pseudo-Maximum Likelihood estimator ... 87
Equation II-12 – Simple Pooled Cross Sections Across Time Model... 89
Equation II-13 – Simple Fixed-Effects Model making use of Pooled Cross Sections Across Time (FEM)... 90
Equation II-14 – Augmented Fixed-Effects Model making use of Pooled Cross Sections Across Time ... 91
Equation II-15 – Augmented Triple Fixed-Effects Model making use of Pooled Cross Sections Across Time (XFE)... 93
Equation II-16 – First Differenced Model making use of Pooled Data ... 96
INTRODUCTION
ight countries from the Central and Eastern Europe were formally integrated in the European Union (EU) on the 1st of May of 2004. This experience will be predictably repeated at least for two other countries (Romania and Bulgaria) in 20071. Consequently, a region of approximately one hundred and four million people (27.2% of previous EU15’s figure), currently occupying a land area that is equivalent to 33.5% of that of the previous Union, representing a GDP which is 11% of that of the EU15 and formerly under the soviet dominance, has recently become part of the European Union2.
In addition, these ten countries, here henceforth called Central and Eastern European Countries (CEEC) following EGGER (2002) nomenclature, present different patterns of specialisation and competitive advantages as regards to the majority of the EU15. In addition, they are clearly moving towards macroeconomic stability and are also experiencing high growth rates. Moreover, they have a highly qualified workforce, which makes them particularly attractive for FDI, either from inside the EU or from other international sources.
This process of reintegration into the European economic and political system has two interrelated aspects, namely, internal domestic transformation and external relationship with the EU25 economic system. These two viewpoints have largely determined the economic growth and the international economic relations of both the EU15 countries and the CEEC. Particularly, the impact of the trade liberalisation between these two blocs is a standpoint that has caused apprehension and equally motivated several academic studies.
Indeed, we must take into consideration the fact that this trade liberalisation, driven by the Europe Agreements, included an asymmetric reduction of trade barriers. In fact, the CEEC´s profited from a period of (a
1
Malta and Cyprus are set aside due to the specifities owned by the so-called Small Insular Developing States. See, for instance, WITTER et al. (2002) for an enumeration of their specificities, which avoid their inclusion into this dissertation.
2
Source: European Commission’s New Cronos Database in November 2003.
maximum of) ten years as they became committed to liberalise market access for industrial goods, whereas the EU15 only benefited from a five-year transition period. The major outcome of these two concessions was a Free Trade Area that started on January 2002, galvanized, two years and four months later, into an Economic Union.
Furthermore, the CEEC provide an interesting case for generalising transition and regional integration, a phenomenon that, on its turn, contributes to the development of the so-called economics of transition and integration
(following PAAS (2003, pp. 20) terminology), particularly if we take into consideration the existence of countries with different economic and political backgrounds.
As a main standpoint, it must be noted that the bilateral trade possibilities and the structure of foreign trade have, indeed, assumed a central position due to the last years’ new economic context, namely the new economic development paradigm, the globalisation phenomenon and the increasing competition bore by the national companies, either on the domestic or the external market.
In the case of the European economies that assumed themselves as pioneers in the European Monetary Union (EMU), the loss of the monetary and exchange policies has turned the Governments’ attentions towards the achievement of their sustainable foreign development, based on increasing both their international and internal competitiveness in terms of offered goods and services.
Within this context, this dissertation attempts to evaluate, at the bilateral level, the trade potential between three considered blocs of countries, namely the Central and Eastern European Countries (CEEC), the Cohesion Countries (CC) and the remaining countries belonging to the European Union (EU11).
It must yet be mentioned that most studies devoting their efforts to the analysis of the consequences of the EU’s last enlargement almost exclusively dedicate themselves to the process of trade adjustment3 within the EU15 Internal Market as a whole. This approach will be named, from now on, the Domestic Competitive Challenge Approach.
These existing studies conclude that the exports of the new adherent countries have the potential to substitute the exports of the members of the EU15 in its common market, creating costly social and economic macroeconomic adjustments in the latter4. At this respect, the Cohesion Countries appear as the most damaged countries due to the coincidence of their foreign trade structure and that of the CEEC.
However, this enlargement also opens several new possibilities in terms of trade capabilities regarding the exporting flows from the members of the EU15 to the tempting markets of the CEEC. Notwithstanding, the analysis of the consequences of the eastern enlargement has not been conveniently carried out, especially as regards to the Cohesion Countries.
Within this context, the purpose of this dissertation is the analysis of this forgotten approach, which scrutinizes the trade opportunity that the blossoming CEEC domestic markets represent for the CC. This overture will be henceforth referred to as the Latent Opportunity Approach.
Thus, this dissertation will focus on the trade dimension of the reintegration of the Central and Eastern European Countries into the European economy, with a special emphasis on the Cohesion Countries. The subsequent bilateral foreign trade adjustments that are expected to occur will be inferred throughout this dissertation, from the available data, in the threshold of this enlargement, namely in the 1999-2002 period.
3
Note that the designation trade adjustment is defined just as the sum of effects, in terms of international trade, brought about by some exogeneous shock, such as the eastern enlargement of the EU15 in our case.
4
Methodologically, we endeavour to estimate a gravity model that permits not only the identification of the determinant factors of foreign trade, something usual in this kind of literature, but also to take into consideration the bilateral trade potential in terms of manufactures involving each one of the EU25 members. Within this context, this dissertation is, to the best of our knowledge, the first that aims at calculating a bilateral trade potential focused on the totality of EU25 countries while paying special attention to the bilateral flows involving both the CEEC and the CC.
Moreover, this dissertation is, also to the best of our knowledge, the first combining the trade potential estimation, based on a gravity model, with the inclusion of a variable related to the Commodity Composition of Trade (CCT) in terms of manufactures. We will observe throughout this section that few studies take into account detailed information about the commodity structure of manufactures trading flows, i.e., the measure of the similarity between the symmetric trade vectors of pairs of countries, originally developed by LINNEMANN (1966). Furthermore, none of the above mentioned studies pay any attention to the CEEC nor the CC when considering the recent enlargement. Several CCT variables will therefore be tested, for the available data, paying special attention to their relatively substitutive items in terms of higher levels of decomposition (6-digit).
Having in consideration the academic debate in course, we intend to analyse and test all the recent empirical contributions regarding the improvement of the econometric specification of the gravity model. Namely, we take into consideration the superiority of the Poisson Pseudo-Maximum Likelihood Estimator (PML) over the several alternative specifications tested throughout this dissertation. Furthermore, the refinement of the explanatory variables considered in the analysis, namely those related to the distance measurement, and the introduction of new variables will also be tested.
foreign trade structures of the CC and the CEEC, both sectorally and globally. This will constitute the first chapter of the first part of this dissertation.
After this first approach, we formulate, in the second chapter, a literature review relative to the origins and subsequent evolution of the several measures considered in this dissertation regarding the Commodity Composition of Trade (CCT). Additionally, and within this framework, we make a comparative analysis of the two main measures discussed, namely the Cosine Measure (COS) and the Export-Import Similarity Index (EIS).
Regarding the second part, a literature review framing will inaugurate the discussion about the gravity model to be used in its first chapter. Special attention is given not only to the several econometric specifications, but also to the refinement and addition of the explanatory variables proposed.
Subsequently, the second chapter of this second part is intended to determinate the factors influencing trade either in terms of cross-section data or panel data. The estimation of the potential level of the bilateral foreign trade between each one of the EU15 members and the CEEC, now that the liberalisation process and its structural adjustment period are finally concluded, will be tackled afterwards.
I.1 CHAPTER I - COMPREHENSIVE DESCRIPTION OF THE FOREIGN TRADE STRUCTURES INVOLVING THE CENTRAL AND EASTERN EUROPEAN COUNTRIES AND THE UE15
fter having reoriented its trade towards the European Union partners during the early nineties, the Central and Eastern European Countries (CEEC) have been aiming at converting their export possibilities into real exports5. However, as it follows, the actual trade flows involving both the CEEC and the European Union members seem to be above those analogous trading flows involving the former and the Cohesion Countries (CC).
Indeed, it must be firstly taken into account that the EU15 was the first trade partner of the CEEC (it represented 63.87% of CEEC’s total trade in 20026, whereas Russia appeared as their second biggest trade partner, only representing 5.53% of CEEC’s total trade in the same year). However, this static outlook must be properly complemented by an analysis regarding comparative statics, which would show how the share of the EU15 in the CEEC’s total foreign trade had slightly decreased during the considered period. In fact, it already represented 66.82% in 1999.
Despite this unexpected outcome, as regards to the period ranging from 1999 to 2002, one cannot avoid mentioning that the subsequent absolute figures in terms of total foreign trading turnover increased by 50.01% in the 1999-2002 period (having additionally seen their figures multiplied by three if we consider a wider scope of time, namely from 1993 to 2002)7.
It can be observed in addition that, despite the significant enhancement experienced by the CEEC’s trade relations with the EU15 during the last years, the analogous performance revealed by these CEEC as regards to the RoW has
5
See for this purpose BEERS & BIESSEN (1996)’s conclusions. However, only the trading structures of Poland and Hungary were taken into account by these authors, avoiding global considerations about the remaining CEEC.
6
A number that rises to 71.99% if we consider an enlarged EU25.
7
slightly overcome the former in terms of trading turnover (CEEC’s total foreign trading turnover increased by 56.92% in the 1999-2002 period), as a result both of the CEEC’s great economic growth and their increasing openness degree.
By comparing the above figures, defined as the total foreign trade turnover with the RoW, with the analogous figures presented, it can be observed that, whereas the CC total trade with the RoW reached € 522.15 billions in 2002, the CEEC analogous value only represented € 346.76 billions (66.41% of the previous value). Consequently, it can be concluded that the CC are nowadays a bigger global trading bloc than the CEEC.
The above context is deepened, namely by analysing the bilateral trading flows involving both the CEEC and the EU15 members, in the first section of this chapter. After this first characterisation, more specific bilateral flows will be analised by taking into consideration the previous set of CEEC trading partners in the second section of this chapter, namely those involving the CC, aiming at the final object of this dissertation.
Additionally, a deeper view into the specific case that Ireland represents and, subsequently, into its exceptional causes, could not be avoided, which will be undertaken on this chapter’s third section. A complementary analysis will be carried out in the fourth section as regards to the interesting conclusion obtained from the classification of the available data according to the sectoral division inaugurated by PENEDER (2001). This author defines two types of sectoral division according both to a factor-input and to a labour-skill criterion. An additional criterion, related to the demand dynamism presented by each sector during the considered period, will be also used.
I.1.1 Bilateral Trading Flows involving the CEEC and the EU15
As explained before, we will first turn our attention to the characterisation of the CEEC-EU15 bilateral trading flows, either CEEC’s exporting flows to the EU15 or the corresponding CEEC’s importing flows from the EU15.
On what concerns the CEEC’s exports to the EU15, this flow increased by 56.61% from 1999 to 2002, while accounting for 66.01% of CEEC’s total sales in 2002 (corresponding approximately to € 119 billions). Its main industrial exports to the EU15 were in 2002 the “High-Skill”, “White-Collar”, “Technology-Driven” industries, following PENEDER (2001) terminology. Particularly, the role played by the Trilogy “Electrical Machinery and Equipment”, “Machinery and Mechanical Appliances” and “Vehicles other than Railway or Tramway” (Codes 85, 84 and 87 accordingly to 2-digit Comext’s Combined Nomenclature) must be highlighted, representing 15.65%, 15.02% and 12.91% of total exports in 2002, respectively (13.55%, 13.75% and 12.51% in 1999). It must also be borne in mind, as a comparative figure, that the CEEC’s main agricultural exports to the EU15 were “Meat and Edible Meat” (Code 2), attaining only 0.52% of total sales in 2002.
However, the weight represented by the “Labour Intensive” and “Low Skill” industries, following PENEDER (2001)’s taxonomy, must be also highlighted. For instance, sectors such as “Textile and Footwear” (covering codes ranging from 61 to 64) and “Wood and Furniture Related Sectors” (codes 44 and 94) represented 10.84% and 9.26% of total trade in 2002, respectively8.
Furthermore, by taking into consideration the CEEC’s importing flows from the EU15, it is observed that the EU11 countries played a dominating role, accounting, on average, for 61.06% of CEEC’s total imports in 2002 (approximately € 133 billions). The EU15 appears, therefore, as the most important partner for these ten countries, namely Germany, which was, by far, the main supplier in 2002, representing 29.19% of total CEEC’s imports,
8
followed by Italy, France and Austria (9.13%, 6.16% and 5.63%, respectively)9. In fact, apart from these EU11 countries, only the remarkable third place obtained by Russia deserves some attention (9.03% of CEEC’s total imports).
In fact, with the exception of Russia, it can be observed that the main suppliers of the CEEC are relatively big developed and geographically close economies. A deeper scrutiny of the relevance of this constatation will be tackled later on, making use of an econometrically robust gravity model.
In this respect, the increase experienced in terms of absolute trading turnover must also be highlighted. It was 44.55% higher in 2002 when compared to 1999. Consequently, the ten CEEC raised its relative position in the analysed period, having become the EU15’s second trade partner after the United States, accounting for 12.69% of the EU15’s total external trade (12.03% of total imports and 13.35% of total exports, respectively)10.
Moreover, the bulk of industrial imports from the EU15 countries were constituted by the trilogy “Machinery and Mechanical Appliances”, “Vehicles other than Railway or Tramway” and “Electrical Machinery and Equipment” (representing 17.89%, 13.9% and 13.79% of total imports in 2002, respectively), as it analogously happened in the case of the CEEC’s exports to the EU15. It must be borne in mind, as a comparative measure, the fact that the CEEC’s main agricultural importing flow from the EU15 corresponded to “Cotton” (Code 52), mostly from Italy, Greece and Portugal to Romania and Bulgaria, representing 1.15% of total imports11. Indeed, regarding the latter flow, its relatively high weight is due to the importance represented by the textile industry in the total Romanian or Bulgarian economies (weighting 25.8% and 24% of total exports in 2002, respectively).
Additionally, the EU15’s trade surplus with the CEEC amounted to € 13.84 billions in 2002, having decreased from the € 15.92 billions previously achieved in 2000. This trend caused the CEEC’s coverage ratio to reach almost
9
For detailed data, see Table III-4 in the annexes.
10
For detailed information, see Table III-5 in the annexes.
11
89.6% of total imports in 2002, somehow illustrating how the CEEC have succeeded in gaining some trading space as regards to the EU15 market.
On what concerns the EU15’s main trading partner among CEEC countries, similarly to what had already occurred in 1999, Poland occupied the main position in 2002 (accounting for 27.74% of CEEC imports from the EU15 and 23.66% of CEEC exports to the EU15), while Latvia remained the smallest partner (1.91 % and 1.63%, respectively)12.
Summing up, CEEC’s trade relies heavily on their relationship with the EU15. Nevertheless, these figures widely vary when taking into account the CEEC individually. Whereas some of these countries have turned their trade structure around in favour of the EU15 members during the past ten to fifteen years, as it is the case of Slovenia (where EU15 weight on total trade achieved 68.27% of total trade in 2002) or the Czech Republic (66.87%), others such as Bulgaria (53.66%) or Lithuania (48.24%) have roughly maintained the same structure of partners for their foreign trade relationships. Within this context, Russia still represents a relatively high weight on the foreign trade relationships of the last two countries (16.07% in the case of Lithuania and 8.99% in the case of Bulgaria)13.
I.1.2 Specific Bilateral Trading Flows involving both the CEEC and
the CC
On what concerns a more specific characterisation of the bilateral trading flows involving both the Central and Eastern European and the Cohesion Countries, the marginal role played by the latter as regards to the CEEC’s foreign trade preferences must be highlighted. Indeed, it seems clear that the current ties existing between the CEEC and the CC lag behind those analogous linkages
12
For detailed data, see Table III-3 in the annexes.
13
existing between the above mentioned groups of countries and the more developed economies of the EU14.
Within this context, we will pay attention, in the first part of this section, to both CEEC importing and exporting flows own characteristics. The analogous CC trading flows will be tackled in the second part.
Thus, taking a deeper view of the former, it is clear that CEEC’s importing flows are dominated by EU11-countries, accounting, on average, for more than 65% of their total imports, as showed in the above section. However, some modifications have been revealed in the above pattern during the last years. In fact, the share of CEEC imports coming from the CC has steadily increased during the period, from 3.13% of CEEC total imports in 1999 to 3.44% in 2002.
Their main industrial imports from the CC were also composed by the trilogy “Vehicles other than Railway or Tramway”, “Machinery and Mechanical Appliances” and “Electrical Machinery and Equipment”, representing 21.03%, 14.82% and 12.66% of total CEEC imports from the CC in 2002, respectively, whereas CEEC’s main agricultural import was “Edible Fruit, Nuts, Citrus, Fruits and Melons” (Code 08), almost totally from Spain and Greece, attaining 5.51% of total imports15.
Taking into consideration each country individually, whereas Spain occupies the EU15’s eleventh position with a meagre 2.17% of CEEC total imports, Greece, Ireland or Portugal stay far below (0.62%, 0.44% and 0.21%, respectively in 2002)16. However, taking into consideration specially relevant linkages, the significance of Greece as the Bulgaria’s fourth main supplier must be highlighted, representing 6.97% of total imports in 2002 (only below Russia (14.33%), Germany (13.76%) and Italy (10.12%)), specially composed by “Textile Articles” (Codes 60 to 62)17 and mostly due to the existence of a common border between them, a fact that will be tackled later on. Moreover, one
14
For detailed data, see Table III-6 in the annexes.
15
For detailed data, see Table III-4 A in the annexes.
16 Idem.
17
must also underline the noticeable role performed by Spain as one of the most important suppliers of either Slovenia (3.06% of total Slovenian imports, achieving the seventh position) or Slovakia (2.81% of total Slovakian imports, reaching the ninth place), both of them mainly composed by “Vehicles Other than Railway or Tramway” (Code 87) (32.5% and 73.23% of either Slovenian or Slovakian imports from Spain, respectively)18.
On the other hand, the picture remains mostly the same when observing
CEEC’s exporting flows. Once again, the CC still represent a marginal role within this trend, much behind those analogous linkages existing between either the CC or the CEEC and the more developed economies of the EU.
Taking a deeper view, it is clear that CEEC exports flows are even more dominated by EU11-countries than the observed in the case of the importing flows, accounting, on average, for more than 72% of their total exports. In fact, Germany, with 34.21%, was, by far, the main client of the CEEC in 2002, followed by Italy, Austria and United Kingdom (8.58%, 7.04% and 5.48% of CEEC’s total exports, respectively).
In spite of this, some modifications occurred during the last years are noticeable as regards to the UE11 intense predominance as CEEC’s customers, slightly stronger than those previously observed in the case of the importing flows. In fact, the share of CEEC exports to the CC has been strongly increasing during the period, from 2.93% of CEEC total exports in 1999 to 3.65% in 2002, representing a remarkable relative improvement. Their main industrial exports to the CC were also the trilogy “Machinery and Mechanical Appliances”, “Electrical Machinery and Equipment” and “Vehicles other than Railway or Tramway”, representing 21.57%, 16.02% and 14.48% of total CEEC exports to the CC in 2002, respectively. It would be also interesting, as a comparative measure, to point out that the CEEC’s main agricultural exporting flow appeared to be “Cereals” (Code 10), mostly from Bulgaria and Hungary, attaining just 1.47% of exports in the same year.
18
Taking each country individually, it must be highlighted that whereas Spain occupies the EU15’s ninth position with a meagre 2.04% of CEEC total exports, Greece, Portugal or Ireland are much further back (0.78%, 0.52% and 0.31%, respectively in 2002)19.
Moreover, within this approach and taking into consideration relevant linkages, both the significance of Greece as Bulgaria’s fifth main client, representing 5.43% of total exports in 2002 must be particularly highlighted20, mainly composed by raw materials such as “Iron and Steel”, “Mineral Fuels and Oils” and “Wood and Articles of Wood”21.
After this Central and Eastern European Countries characterisation and entering now into the Cohesion Countries specific features, it is clear that CC’s importing flows are equally dominated by EU11-countries, accounting, on average, for more than 66% of their total imports. In fact, apart from the remarkable fifth place obtained by the United States (6.09% of CC’s total imports), six of the first seven suppliers of the CC belong to the EU11. Germany, with 15.32%, was by far the main provider for the CC in 2002, followed by France, United Kingdom and Italy (13.71%, 13.62% and 8.22%, respectively)22.
However, some modifications have taken place during the last years, as illustrated by the analysis as regards to comparative statics covering the period ranging from 1999 to 2002. In fact, although still marginal, the share of CC imports coming from the CEEC steadily increased during the period, from 1.54% of CC total imports in 1999 to 2.17% in 2002 (which interestingly represent much lower relative values than those observed regarding the analogous comparative-static analysis of the CEEC importing flows from the CC, previously carried out23). Furthermore, the main industrial CC imports were also composed by the trilogy “Machinery and Mechanical Appliances”, “Electrical
19
For detailed data, see Table III-4.
20
Only below Italy (16.05%), Germany (11.53%), Turkey (8.77%) and United Kingdom (6.13%).
21
Codes 72, 27 and 44, which jointly represented 41.81% of total Bulgarian exports to Greece in 2002.
22
For detailed data, see Table III-6 A.
23
Machinery and Equipment” and “Vehicles other than Railway or Tramway”, representing 21.57%, 16.02% and 14.48% of total CC imports from the CEEC, respectively, whereas CC’s main agricultural import was “Cereals” (Code 10), attaining 1.47% of total imports.
Taking into consideration each country individually, Poland occupies the thirty-first position with a meagre 0.48% of CC total imports, whereas the Czech Republic, Hungary or Romania present worse results (0.42%, 0.35% and 0.24%, respectively in 2002)24. However, taking into account relevant linkages, the relative significance of Poland as the Portuguese fourteenth main supplier must be particularly highlighted, representing 0.88% of Portuguese total imports in 2002 (above Austria (0.72%), Denmark (0.65%) or Finland (0.59%) for instance), overwhelmingly composed by “Machinery and Mechanical Appliances” (Codes 84)25. Furthermore, the noticeable role performed either by Romania and Bulgaria as remarkable Greek suppliers must also be underlined (1.03% and 1.00% of total Greek imports, respectively). Indeed, the Greek consumers seem to be fond of Romanian “Textile Products” (Codes 61 and 62) (47.63% of total Greek imports from Romania) and Bulgarian “Mineral Fuels and Oils” (Code 27) (25.55% of total Greek imports from Bulgaria). Once again, the privileged situation of both countries relatively to the Greek border seems to be a good explanation for this data (particularly when one takes into consideration the relative isolation that these three countries suffer relatively to the European Union geography).
On the other hand, the picture remains mostly the same when observing
CC’s exporting flows. Once again, the CEEC still represent a marginal role within this trend, quite behind those analogous linkages existing between the CC and the more developed economies of the EU11.
Taking a deeper view, it is clear that the CEEC exports flows are slightly more dominated by EU11-countries than observed in the case of the importing
24 Idem.
25
flows, accounting, on average, for more than 66% of their total exports. In fact, the United Kingdom with 16.25% was the main client for the CC in 2002, followed by France, Germany and Belgium (14.24%, 11.78% and 7.69% of CC’s total exports, respectively).
Despite this EU11 domination, some modifications have occurred during the last years, stronger than those observed in the case of the CC’s importing flows. In fact, the share of CC exports going to the CEEC intensely increased during the period, from 2.46% of CC total exports in 1999 to 3.31% in 2002 (which represent lower relative values than those observed regarding the CEEC’s exporting flows to the CC26). As already referred in relation to the CEEC’s importing flows from the CC, the bulk of the main industrial exports to the CEEC were constituted by the trilogy “Vehicles other than Railway or Tramway”, “Machinery and Mechanical Appliances” and “Electrical Machinery and Equipment”, whereas the CC’s main agricultural export was “Edible Fruit, Nuts, Citrus, Fruits and Melons” (Code 08).
Taking each country side by side, it must also be highlighted that whereas Poland occupies the CC’s sixteenth position with a meagre 0.76% of CC total exports, the Czech Republic, Hungary or Bulgaria are far below (0.46%, 0.39% and 0.32%, respectively in 2002)27.
Moreover, taking into account relevant linkages, the significance of either Poland, Romania and, mostly, Bulgaria as the Greece’s fourteenth, ninth and fourth main client must be particularly highlighted, representing 1.11%, 2.72% and 5.35% of total exports in 2002, respectively. These exporting flows are mostly composed by “Edible Fruit, Nuts, Citrus, Fruits and Melons” (Code 08) in the Polish case, “Electrical Machinery and Equipment” (Code 85) in the Romanian case and “Textile Products” (Codes 61 and 62) in the Bulgarian case. Hence, the data leads once again to pay special attention to the neighbouring relation between countries.
26
Note that the CEEC exports to the CC represented 2.93% and 3.65% in 1999 and 2002, respectively.
27
I.1.3 The Irish Specificity
At this point, it would be sensible to trace a line of division between the four CCs. Indeed, in spite of all of them being below the ninety percent of per capita GDP cap defined as the main criterion for the attribution of Cohesion funding when the Agenda 2000 was discussed28, they are obviously not a homogeneous group of countries.
At first sight, Spain would seem to be an outsider due to its great demographic and economic size. Indeed, whereas Spain presented a population of 40 562.2 thousands of people in 2002, Greece, Portugal and, mostly, Ireland, were far below this level (10 950, 10 351 and 3 909 thousands, respectively). Furthermore, as regards to the GDP, whereas Spain presented a GDP at market prices of 696 208 Millions of Euro in 2002, Greece, Portugal and Ireland were far below this level (141 354, 129 280 and 129 344, respectively)29.
However, the outsider within this sample turns out to be Ireland. Indeed, Ireland’s remarkable economic performance over the course of the 1990s, which caused Irish per capita GDP measured according to PPP to rise from 25 percentual points below to 20 percentual points above the EU average, should be pointed out as the main differentiating factor.
Table I-1 – Dynamics of PC’s per capita GDP measured according to PPP as EU15 average
Source: Authors’ calculations based on the European Commission’s New Cronos Database, downloaded in November 2003.
However, other factors are behind this result. These include being one of the most open economies in the EU2530, the relatively high qualification level of
28
Although in the Irish case, the elegibility for these funds was just prolonged for the period 2000-2006 in the quality of phasing-out.
29
Source: European Commission’s New Cronos Database in November 2003.
30
See Table III-7 in the annexes.
1991 1995 1999 2002
Ireland 76,63% 93,10% 111,76% 125,27%
Spain 80,51% 78,05% 81,91% 84,29%
Portugal 64,83% 69,63% 71,98% 68,45%
its labour force31 or the huge degree of absorption of FDI in the economy32, all of them justifying a virtual exclusion of Ireland from this group of four countries33.
Thus, the exclusion of Ireland from our definition of CC would have been correctly safeguarded. However, for this dissertation’s analytical purposes, this exclusion is assumed to be meaningless, due to the high competition that the Irish economy seems to be suffering from countries such as the Czech Republic or Hungary in terms of foreign trade specialisation. Equally important is the peripheral situation of Ireland in geographic terms as regards to the EU25 economic centre. Indeed, these two factors cannot be set aside and turn out to be essential similarity factors with Spain, Portugal and Greece, and are taken herewith as fundamental pillars for considering the four countries as a distinctive group.
Note that several other indicators of differentiation of the Irish situation will be found throughout this dissertation as a consequence of the previous factors, which undoubtedly make of this economy a special case, but not sufficient to invalidate our above mentioned justifications34.
Examples of this indicators will be found in the following section, in which Ireland will exhibit extremely concentrated values in technology-driven industries, high-skill workers and dynamic-growth sectors. Indeed, Ireland displays the highest relative values in these three kind of industries as regards the whole EU25 universe. It shows, once again, the huge concentration of the Irish productive and exporting structure in a reduced number of sectors characterised by high-skill labour and technology-driven emphasis.
I.1.4 Sectoral Division of Trading Flows
In order to apply some sectoral taxonomies, which allow us to identify specific effects as regards to exporting flows according to different sectors, the
31
See Table III-15 in the annexes.
32
SeeTable III-12in the annexes.
33
4 700 manufacturing sectors considered in this dissertation, according to Comext
Database, will be converted to the 3-digit level following the Classification of Economic Activities in the European Community (NACE) and classified according to their intrinsic characteristics.
Thus, first of all, we will consider all sectors of the Comext’s CN at the 6-digit level that, according to the conversion CN-NACE, are classified as manufacturing industry sectors. Consequently, we will analyse the image supplied by the average of their relative weights for the period ranging from 1999 to 2002. A complementary comparative analysis between the 1999 and the 2002 respective figures will be tackled afterwards.
In both cases, we will split total exporting figures aiming at comparing different groups of homogeneous products. We will hereby follow a series of sectoral divisions accordingly to the previous work carried out by PENEDER (2001), who defines two types of sectoral division according to a factor-input or a labour-skill criteria. Whereas the former categorises each sector as mainstream,
labour-intensive industries, capital-intensive industries, marketing-driven industries or technology-driven industries, the latter categories do it in terms of
low-skill industries, medium-skill/blue-collar workers, medium-skill/white-collar workers and high skill workers.
In addition, we will also consider another criterion of selection, according to each sectors’ demand dynamism alongside the EU25 within the period 1999-2002. Within this approach, the sectors are grouped into negative growth sectors,
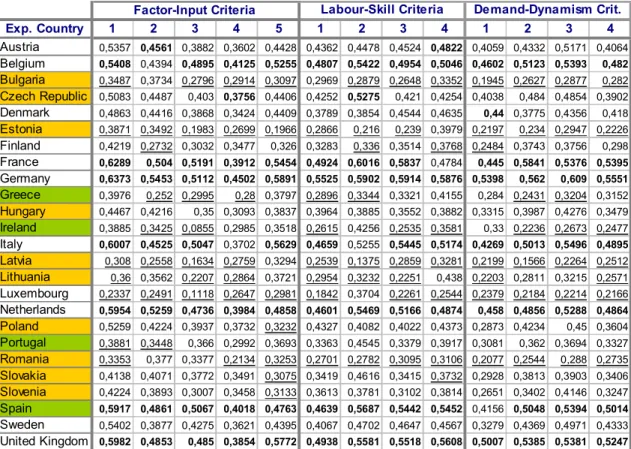
slow or nil growth sectors, medium growth sectors or dynamic growth sectors. Therefore, the three dissection patterns taken into consideration in this dissertation allow us to achieve several remarkable conclusions as regards to the image supplied by their relative weights in 2001. The main conclusions related can be inferred from Table I-2.
34
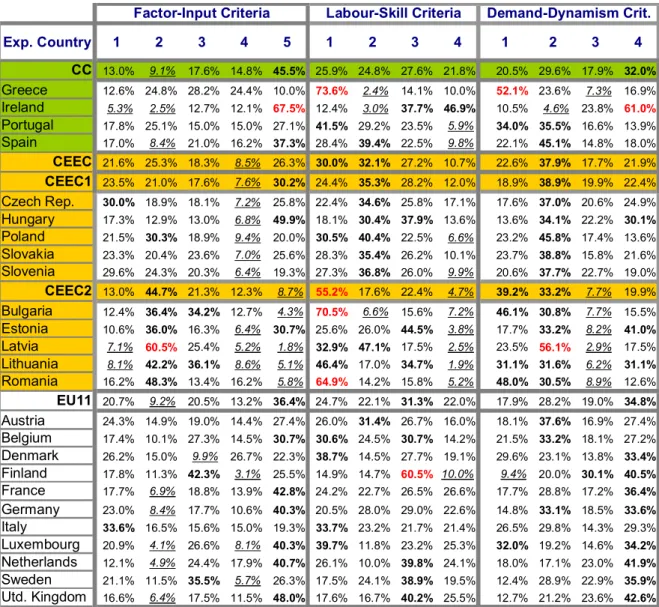
Table I-2 – Relative weight in exporting values to EU15 in 2001, following PENEDER (2001)’s factor-input and labour-skill criteria and also demand-dynamism criterion (6-digit CN)
Source: Authors’ calculations based on the European Commission’s Comext Database.
Table Codes: Factor-input criterion: 1 – mainstream, 2 – labour-intensive industries, 3 – capital-intensive industries, 4 – marketing-driven industries, 5 – technology-driven industries; Labour-skill criterion: 1 – low-skill industries, 2 – medium-skill/blue-collar industries, 3 – medium-skill/white-collar industries, 4 – high-skill industries; Demand-dynamism criterion, taking in consideration the average growth of the considered industries for the years ranging from 1999 to 2002: 1 – negative-growth industries, 2 – slow- or nil-growth sectors, 3 – medium-growth sectors, 4 – dynamic-growth sectors.
Note: EIS-values higher than 50% are highlighted in red bold, whereas EIS-values higher than 30% but lower than 50% are highlighted in black bold. In addition, EIS-values lower than 10% appear underlined and in italic.
Turning now into a more specific viewpoint, we will focus our attention in each one of the three groups of countries considered throughout this dissertation. Firstly, taking into consideration the CEEC, they can be divided in two main
sub-Exp. Country 1 2 3 4 5 1 2 3 4 1 2 3 4
CC 13.0% 9.1% 17.6% 14.8% 45.5% 25.9% 24.8% 27.6% 21.8% 20.5% 29.6% 17.9% 32.0%
Greece 12.6% 24.8% 28.2% 24.4% 10.0% 73.6% 2.4% 14.1% 10.0% 52.1% 23.6% 7.3% 16.9% Ireland 5.3% 2.5% 12.7% 12.1% 67.5% 12.4% 3.0% 37.7% 46.9% 10.5% 4.6% 23.8% 61.0% Portugal 17.8% 25.1% 15.0% 15.0% 27.1% 41.5% 29.2% 23.5% 5.9% 34.0% 35.5% 16.6% 13.9% Spain 17.0% 8.4% 21.0% 16.2% 37.3% 28.4% 39.4% 22.5% 9.8% 22.1% 45.1% 14.8% 18.0%
CEEC 21.6% 25.3% 18.3% 8.5% 26.3% 30.0% 32.1% 27.2% 10.7% 22.6% 37.9% 17.7% 21.9%
CEEC1 23.5% 21.0% 17.6% 7.6% 30.2% 24.4% 35.3% 28.2% 12.0% 18.9% 38.9% 19.9% 22.4% Czech Rep. 30.0% 18.9% 18.1% 7.2% 25.8% 22.4% 34.6% 25.8% 17.1% 17.6% 37.0% 20.6% 24.9% Hungary 17.3% 12.9% 13.0% 6.8% 49.9% 18.1% 30.4% 37.9% 13.6% 13.6% 34.1% 22.2% 30.1%
Poland 21.5% 30.3% 18.9% 9.4% 20.0% 30.5% 40.4% 22.5% 6.6% 23.2% 45.8% 17.4% 13.6% Slovakia 23.3% 20.4% 23.6% 7.0% 25.6% 28.3% 35.4% 26.2% 10.1% 23.7% 38.8% 15.8% 21.6% Slovenia 29.6% 24.3% 20.3% 6.4% 19.3% 27.3% 36.8% 26.0% 9.9% 20.6% 37.7% 22.7% 19.0%
CEEC2 13.0% 44.7% 21.3% 12.3% 8.7% 55.2% 17.6% 22.4% 4.7% 39.2% 33.2% 7.7% 19.9% Bulgaria 12.4% 36.4% 34.2% 12.7% 4.3% 70.5% 6.6% 15.6% 7.2% 46.1% 30.8% 7.7% 15.5% Estonia 10.6% 36.0% 16.3% 6.4% 30.7% 25.6% 26.0% 44.5% 3.8% 17.7% 33.2% 8.2% 41.0%
Latvia 7.1% 60.5% 25.4% 5.2% 1.8% 32.9% 47.1% 17.5% 2.5% 23.5% 56.1% 2.9% 17.5% Lithuania 8.1% 42.2% 36.1% 8.6% 5.1% 46.4% 17.0% 34.7% 1.9% 31.1% 31.6% 6.2% 31.1%
Romania 16.2% 48.3% 13.4% 16.2% 5.8% 64.9% 14.2% 15.8% 5.2% 48.0% 30.5% 8.9% 12.6%
EU11 20.7% 9.2% 20.5% 13.2% 36.4% 24.7% 22.1% 31.3% 22.0% 17.9% 28.2% 19.0% 34.8%
Austria 24.3% 14.9% 19.0% 14.4% 27.4% 26.0% 31.4% 26.7% 16.0% 18.1% 37.6% 16.9% 27.4% Belgium 17.4% 10.1% 27.3% 14.5% 30.7% 30.6% 24.5% 30.7% 14.2% 21.5% 33.2% 18.1% 27.2% Denmark 26.2% 15.0% 9.9% 26.7% 22.3% 38.7% 14.5% 27.7% 19.1% 29.6% 23.1% 13.8% 33.4%
Finland 17.8% 11.3% 42.3% 3.1% 25.5% 14.9% 14.7% 60.5% 10.0% 9.4% 20.0% 30.1% 40.5%
France 17.7% 6.9% 18.8% 13.9% 42.8% 24.2% 22.7% 26.5% 26.6% 17.7% 28.8% 17.2% 36.4%
Germany 23.0% 8.4% 17.7% 10.6% 40.3% 20.5% 28.0% 29.0% 22.6% 14.8% 33.1% 18.5% 33.6%
Italy 33.6% 16.5% 15.6% 15.0% 19.3% 33.7% 23.2% 21.7% 21.4% 26.5% 29.8% 14.3% 29.3% Luxembourg 20.9% 4.1% 26.6% 8.1% 40.3% 39.7% 11.8% 23.2% 25.3% 32.0% 19.2% 14.6% 34.2%
Netherlands 12.1% 4.9% 24.4% 17.9% 40.7% 26.1% 10.0% 39.8% 24.1% 18.0% 17.1% 23.0% 41.9%
Sweden 21.1% 11.5% 35.5% 5.7% 26.3% 17.5% 24.1% 38.9% 19.5% 12.4% 28.9% 22.9% 35.9%
groups, CEEC1 and CEEC2, accordingly to their GDP per capita - Table III-1 -. The first group will be constituted by Slovenia, the Czech Republic, Hungary, Slovakia and Poland, whereas the second will be represented by Estonia, Lithuania, Latvia, Romania and Bulgaria. Poland would have been included in the second group by taking into account just the GDP per capita indicator. However, other factors such as its economic dimension (absolute GDP) counted in favour of Poland being included into the first group of CEEC.
It can be observed as regards to the factor-input criterion that the majority of the CEEC countries is still mostly specialised in labour-intensive industries. Indeed, amongst the 25 countries considered, the six that display the highest share in this kind of industries all belong to the CEEC (CEEC2 plus Poland).
However, the CEEC1 (excluding Poland), registers relatively low values on what concerns labour intensive industries, while simultaneously presenting relatively high weights when referring to technology-driven industries (including also Estonia in the latter). The Hungarian case deserves special attention regarding technology-driven industries, as it acquaint with the second highest weight in the whole EU25 (just below Ireland).
As regards to labour-skill criterion, the CEEC2 (mostly Romania and Bulgaria), turn out to be extremely dependant of low-skillindustries. Poland and Estonia must be included and excluded once again from this group, respectively.. Furthermore, the Czech Republic, Hungary and Estonia display the highest share of high-skill industries and white-collar workers. Indeed, these three countries exhibit same-level values when compared to Denmark, Austria or Italy.
On the other side, the blue-collar workers predominate in Latvia, Poland, Slovenia and also Slovakia (occupying six of the first eight positions of the twenty-five countries considered). In addition, the low-skill industries represent a far-above the average value in Romania, Bulgaria and Lithuania.
this, the majority of the CEEC seem to be specialising in medium growth sectors, with the only exceptions being Romania and Bulgaria, displaying relatively high values related to the negative-growth sectors.
Turning our analysis to the CC, it must be once again highlighted the to-some-point similarity registered by both Portuguese and Spanish trade patterns, both specialised low- and medium-skill workers and negative- and slow-growth sectors and exhibiting a highly diversified trade structure according to the factor-input criterion. In both cases, the relatively high values achieved by the technology-driven industries must also be highlighted, mostly in the Spanish case.
On the extreme sides, whereas Greece conciliates a majority of low-skill industries with a majority of negative-growth industries, Ireland, as it may be expected, exhibits extremely concentrated values in technology-driven industries,
high-skill workers and dynamic-growth sectors (presenting the highest values in these three criteria as regards the whole EU25 universe, showing, once again, the huge concentration of the Irish productive and exporting structure in a reduced number of sectors characterised by high-skill labour and technology-driven emphasis).
On what specifically concerns the demand-dynamism criterion, Spain, Portugal and Greece exhibit similar values in medium- and dynamic-growth industries. Nonetheless, the picture clearly diverges when the negative- and slow-growth sectors are focused. Whereas Spain concentrates its exports mostly in the latter, Greece shows the highest concentration in negative-growth industries in the whole EU25 universe. In addition, Portugal acquainted with balanced values between these two kinds of sectors.
Referring to the EU11-countries, it must be concluded that the majority of them can be characterised as technology-driven industries (with the exception of the Finland and Sweden, both specialised in capital-intensive industries, and Denmark and Italy, specialised in mainstream industries), white-collar workers
To sum up, taking a global view, the EU11 economies emerge as the trading core of the EU25, specialized in technology-driven industries, white-collar workers and dynamic-growth sectors. Nonetheless, the CC-CEEC set of countries does not display such a homogeneous picture. The Irish case beats all the EU11 countries, deserving special attention for that in section I.1.3, and some other countries exhibit a somehow approximate specialization, such as Spain, Slovakia, Slovenia, the Czech Republic and mostly Hungary. On the other hand, Latvia, Romania and Bulgaria lag far behind. Portugal, Greece, Poland, Estonia and Lithuania emerge in an intermediate picture.
Comparative Statics
In order to apply analogous sectoral taxonomies to dynamic results, the 4 700 sectors of the CN at the 6-digit level will be classified accordingly to their performance from 1999 to 2001 within the three criteria used in the previous section (Factor-Input or Labour-Skill criteria, according to PENEDER (2001), and also Demand Dynamism criterion). Thus, the following Table I-3 will allow us to understand the ongoing transformations suffered for the economies studied.
This table below allows us to achieve several remarkable conclusions. On what concerns the factor-input criterion, it can be observed how Ireland, the United Kingdom and Hungary have strongly increased their specialization in
technology-driven industries in the period ranging from 1999 to 2002, consequently updating their intrinsic value-added. Note that all the CEEC1, plus Estonia, are increased the weight of their traded manufactures in technology-driven industries. This evolution confirms “the gradual emergence of a specialisation that is no long in low value-added goods alone but also in goods
with greater technological content”, as referred by HENRIOT & INOTAÏ (1998, pp. 102). On the contrary, all the CEEC2 also increased their specialization in
labour-intensive industries, mostly Latvia and Romania.