HMC08
Experimental Research on Rubble Stone Masonry Walls
Fernando F. S. Pinho
Assistant Professor, Civil Engeneering Department - Nova University of Lisbon, Portugal, [email protected]
Manuel F. C. Baião
Principal Research Officer, Laboratório Nacional de Engenharia Civil, Portugal, [email protected]
Válter J. G. Lúcio
Associated Professor, Civil Engeneering Department - Nova University of Lisbon, Portugal, [email protected]
Paulina Faria
Assistant Professor, Civil Engeneering Department - Nova University of Lisbon, Portugal, [email protected]
SUMMARY: This paper refers to the results of a research project carried out at Nova University of Lisbon (Pinho [8]), where several experimental models of rubble stone masonry walls were subjected to axial compression and shear-compression tests. The aim of this research project was the experimental evaluation of some structural strengthening solutions for rubble stone masonry buildings.
The results of some tests performed to determine physical, chemical and mechanical properties of the constituent materials of the experimental masonry models are also presented.
This experimental work was made in cooperation with LNEC, and it was sponsored by some industrial companies.
KEY-WORDS: Experimental analysis, masonry, mortar.
INTRODUCTION
According to the National Statistic Institute (INE [4]), there are about 3.160.000 buildings in Portugal. A significant percentage was built with structural masonry walls, namely stone masonry walls. Most of them are located in villages and towns centres, and constitute a reference of their places.
A large number of those masonry walls have a high percentage of lime mortar in their constitution, and, consequently, present poor mechanical behaviour to foundations settlements and, specially, to seismic actions. This last aspect is very important because Portugal is located near the frontier between two important tectonic plaques (African and Euro Asiatic plaques) and, therefore, exposed to strong seismic activity – like the ones occurred at 1755 and, more recently, in some Azores Islands at 1998 –, with devastating human and material consequences.
MAIN PROPERTIES OF THE CONSTRUCTION MATERIALS OF
THE EXPERIMENTAL MODELS
Some physical, chemical and mechanical properties of the construction materials are presented. These properties are: (i) bulk density, open porosity, volumetric coefficient, chemical constituents and mechanical resistance, for stones; (ii) particle size distribution
curves, bulk density, loose bulk density, voids volume percentage, content of fine particles and chemical constituents, for sands; (iii) particle size distribution curve and chemical
characteristics, for hydrated lime and (iv) flow table consistency, bulk density, open
porosity, capillary absorption coefficient, vapour permeability coefficient, compression resistance, dynamic elasticity modulus and carbonation depth, for mortar.
Stones
The models were built with stones from Rio Maior. Some of them, with larger dimensions, were used to obtain bigger units than the others, figure 1. These bigger stone blocks were used in general at 1/3 and 2/3 of the height of the experimental models, corresponding to 0,40 m and 0,80 m up to their bases, respectively. These bigger stones are named by “perpianhos”. Table 1 present the mean values of the analysed characteristics of stones.
Figure 1 – Preparation of the stones used in the construction the experimental models
Table 1 - Mean values of physical, chemical and mechanical characteristics of stones
Characteristics Mean Values
Bulk density 2491 kg/m3
Open porosity 8,1 %
Physical
Volumetric coefficient 0,26
Calcium oxide [CaO] 54,91 %
Silicon dioxide [SiO2] 0,52 %
Aluminium trioxide [Al2O3] 0,46 %
Iron trioxide [Fe2O3] 0,12 %
Magnesium oxide [MgO] 0,33 %
Potassium oxide [K2O] 0,02 %
Chemical
Loose on ignition (LOI) 43,52 %
Mechanical Mechanical resistance 47,8 MPa
Sands
HMC08
Yellow pit sand (unwashed)
River sand (washed) Maxim
Dimension (D) [mm]
0,595 2,38
Minimum Dimension (d) [mm]
0,149 0,149
Fineness Modulus
(Fm) 1,8 2,7
Figure 2 – Particle size distribution curves of both sands
Table 2 - Mean values of physical and chemical characteristics of sands
Mean Values Characteristic
River sand Yellow pit sand
Bulk density 2625 kg/m3 2647 kg/m3
Loose bulk density 1584 kg/m3 1539 kg/m3
Voids volume percentage 38,2 % 39,5 %
Physical (105 ± 5 ºC)
Content of fine particles 1,2 % 7,6 % Silicon dioxide (SiO2) 98,0 % 87,8 % Aluminium trioxide (Al2O3) 1,70 % 7,34 % Iron trioxide (Fe2O3) 0,11 % 0,85 %
Calcium oxide (CaO) 0,18 % 0,17 %
Magnesium oxide (MgO) 0,01 % 0,09 %
Chemical
Potassium oxide (K2O) 0,01 % 3,39 %
Lime
The majority of the models were built with hydrated lime produced by Lusical Company. Figure 3 and table 3 show physical and chemical characteristics of the used lime.
0 10 20 30 40 50 60 70 80 90 100
1 10 100 1000
[μm] [%]
Mean diameter = 6,07 μ m
Figure 3 – Particle size distribution curve of the lime
0 10 20 30 40 50 60 70 80 90 100
0,01 0,1 1 10 100
Table 3 – Mean values of chemical characteristics of the hydrated lime
Characteristics Mean Values [%]
Calcium hydroxide Ca(OH)2 93,5
Calcium carbonate CaCO3 3,86
Magnesium hydroxide Mg(OH)2 0,52
Chemical
Calcium sulphate CaSO4 0,51
Mortar
The models were built with lime mortar, using a volumetric composition 1:3 (lime:sand), figure 4. This composition was defined according to researches about the composition of mortars used in Lisbon Pombaline Old Town (Nero [2]) and the analysis of several mortars (Veiga [14]). The ratio water/lime was equal to 1,2, and sands had two origins: river and yellow pit sands, as mentioned in figure 2.
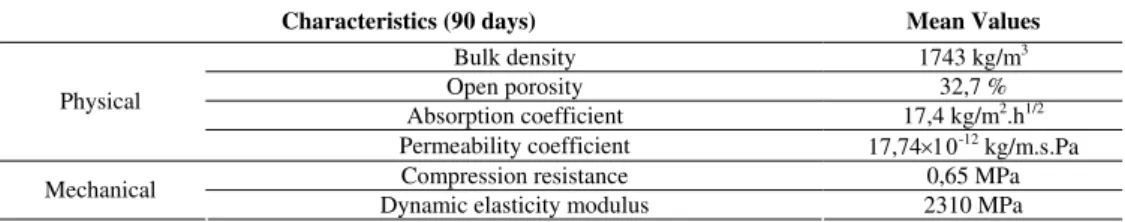
Figures 5 and 6, and table 4, shows physical and chemical characteristics of the mortar.
Figure 4 – Lime mortar production using a mechanical mixer
0 1 2 3 4 5 6 7 8 9 10
N 2 4 9 1
61-70 71-80 81-90 91-100
Figure 5 – Flow table consistency of the mortar
Table 4 – Main values of physical, mechanical and chemical characteristics of the mortar
Characteristics (90 days) Mean Values
Bulk density 1743 kg/m3
Open porosity 32,7 %
Absorption coefficient 17,4 kg/m2.h1/2 Physical
Permeability coefficient 17,74×10⁻¹² kg/m.s.Pa
Compression resistance 0,65 MPa
Mechanical
Dynamic elasticity modulus 2310 MPa
[N]
HMC08
0 5 10 15 20
0 30 60 90 120
Tempo [dias]
Figure 6 – Carbonation depth of the lime mortar’s prismatic specimens
The results of mechanical parameters of the mortar, presented in table 4, were achieved at 90 days of curing. However, in this research (Pinho [8]), the mean values (σ=0,6MPa) considered to analyze the mechanical behavior of the reference models were taken at 607 and 739 days, during the experimental tests of such reference models. It must also be said that the maximum value of mechanical resistance of the lime mortar, obtained at 1101 days, was 0,82 MPa.
According to European Standard EN 998 - Specification for mortar for masonry - Part 2: Masonry mortar (CEN [2]), mortars with those resistances belong to class M1.
MAIN PROPERTIES OF THE EXPERIMENTAL MODELS (RUBBLE
STONE MASONRY)
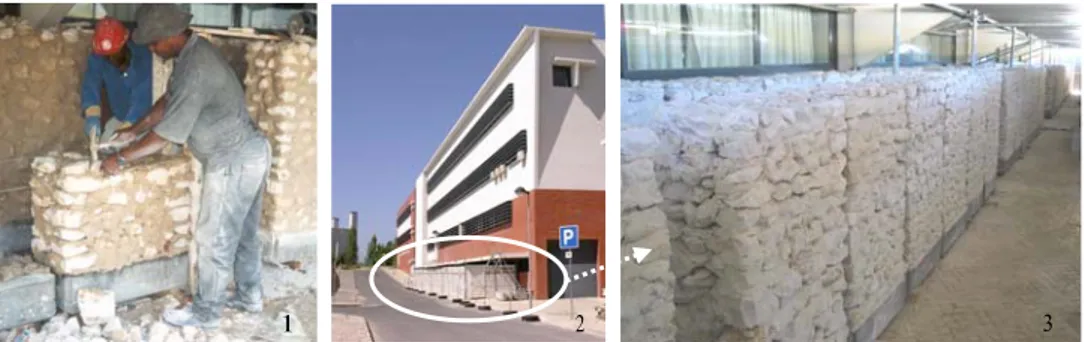
The experimental models of rubble stone masonry were made with 75% of limestone and 25% of lime mortar per m3 of masonry, figure 7 (Appleton [1], Nero
et al [6] and Pinho [8,
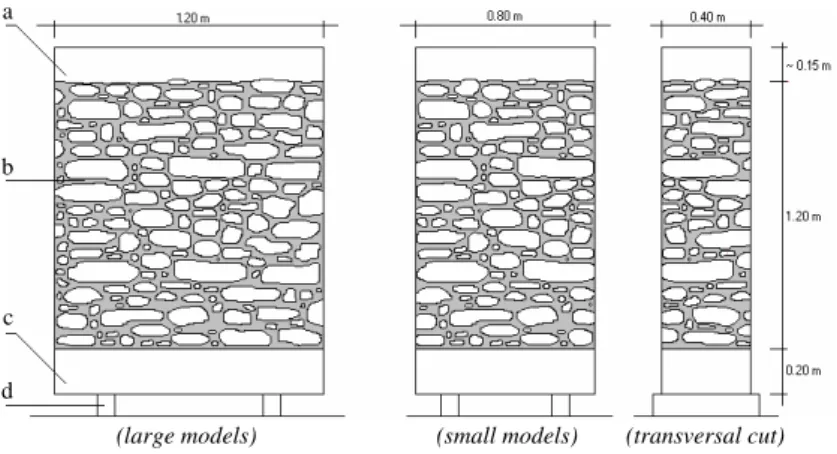
9]). Sixty two models were constructed using traditional techniques, divided into two groups: 20 models, numbered from 1 to 20, with 1,20m high, 1,20m wide and 0,40m thick, for shear-compression load tests, identified by “large models”, and 42 models, numbered from 21 to 62, with 1,20m high, 0,80m wide and 0,40m thick, to compression load tests, identified by “small models”, according to figure 8 (Pinho [10]).
Some of the models were also used for water absorption under low pressure tests.
1 – construction of the experimental models, using traditional techniques; 2 – curing place of the models; 3 – inside of the curing place
Figure 7 – Rubble stone masonry models
prisms 160x40x40
(large models) (small models) (transversal cut) a-concrete lintel; b-masonry; c- concrete base; d-support of the models
Figure 8 – Geometry of the experimental rubble stone masonry models
Physical properties of the experimental models
Physical properties of the mortar, taken directly from the masonry of the experimental models, are presented in table 5.
Figure 9 presents the linear dimension variations of three models, along time. This figure includes also the relationship between such variations and the involving humidity- temperature inside the curing place of the models. Humidity values are amplified “10×”.
Table 5 – Mean values of the mortar obtained directly from the experimental models
Characteristics (90 days of curing) Mean Values
Bulk density 1807 kg/m3
Open porosity 26,9 %
-2,00 -1,50 -1,00 -0,50 0,00 0,50 1,00 1,50 2,00
0 20 40 60 80 100 120
[hours1/2]
[m
m
/m
] x 1
0
-1
M37 M45 M62 Humidity - Mortar
Humidity - Stones M37 M45 M62
Humidity - mortar Humidity - stones
Figure 9 – Relationship between linear dimension variations of three experimental models (M37, M45, M62), along time, and the ambiance humidity-temperature
b
c
HMC08
The experimental model M62, presented in figure 9, has only 75% of the mortar used in the other models (M37 and M45). This figure illustrates an important relationship between linear dimension variations of the models and the ambiance humidity-temperature.
The mean bulk density of the masonry of all tested models (small and large) is 1758 kg/m3.
Using this value, theoretical bulk density of the masonry (Tbdm) can be defined according to
expression (1), considering:
i) the bulk density of the mortar acquired directly from the masonry of the experimental models, of 1807 kg/m3;
ii) the bulk density of stones, of 2491 kg/m3;
iii)the referred mean percentages of mortar and stones, per m3 of masonry, of 25% and
75%, respectively;
Tbdm = 0,25×1807 kg/m3+0,75×2491kg/m3 = 2320 kg/m3 (1)
According to these values, the voids volume percentage of the rubble stone masonry, Vv, is given by expression (2):
% 24 kg/m 2320
kg/m 1758 1
Vv 3
3
≅ −
= (2)
To evaluate the effects of the water in contact with the masonry, several water absorption tests under low pressure were done, using the Carsten tubes on the mortar joints. Although
these tests do not distinguish between water absorbed by stones or by mortar joints, they are usually used to analyse the global behaviour of the wall (Santos et al [12]) in the presence of
the water.
Figure 10 shows the obtained results in ten models at about 90 days. Other ages, not present here, were also analyzed (Pinho [8]).
0,0 1,0 2,0 3,0 4,0
0 5 10 15 20 25 30
Time [min]
[c
m
3]
M12 M13 M19 M20
M21 M23 M24 M34
M41 M56 Mean value
Chemical properties of the experimental models
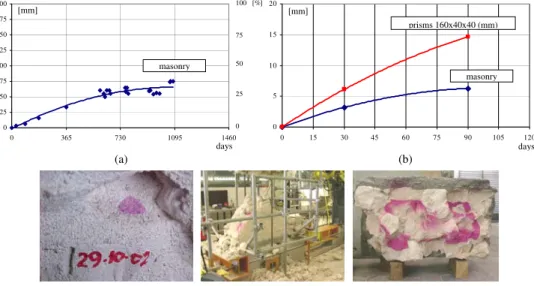
Carbonation depth of the lime mortar, obtained in prismatic models of 160x40x40 (mm) is presented in figure 11.
(a) (b)
(a) directly from the experimental models; (b) comparing this characteristic from prismatic models of 160x40x40 (mm) and the mortar of the masonry, until 90 days
Figure 11 – Evolution of the carbonation depth on the lime mortar
Mechanical properties of the experimental models
Axial compression and shear-compression testing system
Two different types of loading systems were designed and built up for this research: one for axial compression tests (small models) and another for shear-compression tests (large models), figure 12.
In the axial compression testing system, the load was applied monotonically up to the collapse of the experimental models. The load was applied by a hydraulic cylinder placed between the steel frame and a load spreading steel beam placed over the model. The vertical displacements were measured (on the top of the experimental models) with two LVDTs, fixed to the concrete base of the models.
In the shear-compression testing system the horizontal load was applied monotonically, cyclically or alternately on the tested models. However, the reference models were submitted only to monotonic loading. In this loading system loads were applied in two different phases: first a prescribed vertical load was applied and, subsequently, horizontal displacements were imposed by an actuator standing on a strong wall, till the collapse of the models. The vertical and horizontal displacements were measured with seven LVDTs fixed to the concrete base of the models.
0 5 10 15 20
0 15 30 45 60 75 90 105 120
0 25 50 75 100 125 150 175 200
0 365 730 1095 1460
100
75
50
25
0 [%]
[mm]
masonry
[mm]
days days
prisms 160x40x40 (mm)
HMC08
Figure 12 – Axial compression and shear-compression testing systems
Analysis of the experimental results
The experimental work started with the test of 3 small models and 3 large models without any strengthening, also named by “reference models” which mechanical characteristics, used as reference to compare with the test results of the strengthened models, are presented next. Figure 13 show the axial force-vertical displacements diagrams and the final stages of the three experimental testes under compression.
0 25 50 75 100 125 150
0,0 2,0 4,0 6,0 8,0 10,0 12,0 14,0
Deslocamento [mm]
F
orç
a ve
rt
ic
al
[kN
]
M43 M21 M32
Te
ns
ão
[M
Pa
]
Extensão ε [0/ 00]
0,47
0,00 1,67 3,33 5,00 6,67 8,33 10,00 11,67 0,39
0,31
0,23
0,16
0,08
0,00
Figure 13 – Results of the three experimental testes under axial compression loads
Vert
ical
lo
ad [k
N]
Displacements [mm]
Stress
Extension ε [o
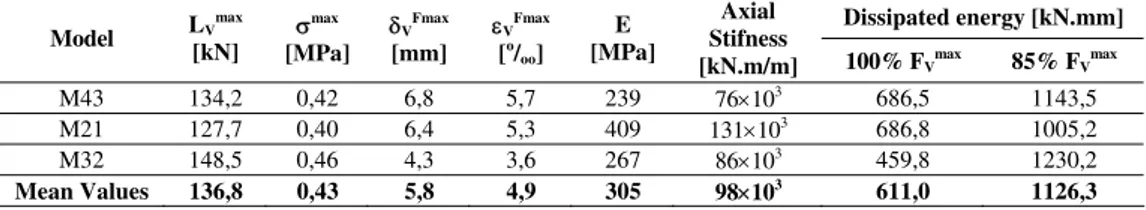
Table 6 presents the main parameters obtained from these tests. Such parameters are: the maximum force (Fmax); the vertical displacement corresponding to the maximum force
(δvFmax); the axial stiffness at 30% of the maximum force and dissipated energy (Ediss) at Fmax
and at 85% Fmax (at 15% Fmax drop after Fmax is reached).
Table 6 – Main values obtained under axial compression loading tests
Dissipated energy [kN.mm]
Model LV
max
[kN]
σmax [MPa]
δVFmax [mm]
εVFmax [o/oo]
E [MPa]
Axial Stifness
[kN.m/m] 100% FVmax 85% FVmax
M43 134,2 0,42 6,8 5,7 239 76×103 686,5 1143,5
M21 127,7 0,40 6,4 5,3 409 131×103 686,8 1005,2
M32 148,5 0,46 4,3 3,6 267 86×103 459,8 1230,2
Mean Values 136,8 0,43 5,8 4,9 305 98×103 611,0 1126,3
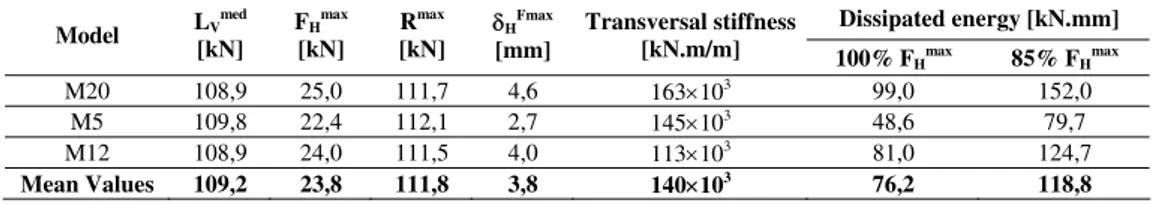
Figure 14 shows the horizontal force-horizontal displacements diagrams of the three tested unstrengthened models (large models) under shear-compression tests (with a mean vertical load of 109,2 kN), and table 7 presents the obtained results.
These results are: the resultant of the main vertical and the maximum horizontal forces (LVmed; FHmax; Rmax), the horizontal displacements corresponding to the maximum horizontal
loads, the transversal stiffness and the dissipated energy.
0 5 10 15 20 25 30
0,0 2,0 4,0 6,0 8,0 10,0
Deslocamento horizontal (D1+D2)/2 [mm]
For
ça
hor
iz
on
ta
l
C
C
3 [
kN
]
M20 M5 M12
carga vertical média = 109 kN
Figure 14 – Results of the three experimental testes under compression-shear loads
Average vertical load = 109,2 kN
Horizontal load [kN
]
HMC08
Table 7 – Main values obtained in under compression-shear loading testes
Dissipated energy [kN.mm]
Model LV
med [kN]
FHmax [kN]
Rmax [kN]
δHFmax [mm]
Transversal stiffness
[kN.m/m] 100% FHmax 85% FHmax
M20 108,9 25,0 111,7 4,6 163×103 99,0 152,0
M5 109,8 22,4 112,1 2,7 145×103 48,6 79,7
M12 108,9 24,0 111,5 4,0 113×103 81,0 124,7
Mean Values 109,2 23,8 111,8 3,8 140×103 76,2 118,8
MAIN CONCLUSIONS
1. Considering that the carbonation depth of the masonry (lime mortar) was about 27,5% when the reference models were tested in the axial testing system (627 days of age), the mean values of mechanical resistance of such models (0,43 MPa), tend to be comparable to the
ones obtained in situ by J. Roque et al [11], of about 1 MPa, and in laboratory, by R. Valluzzi
[13], using experimental models built with hydraulic lime, of about 0,99 and 1,97 MPa. The elasticity modulus, 305 MPa, is also comparable to the obtained in situ by A. Costa [3], in a
building placed in Faial Island, of 0,23 GPa, and by C. Oliveira et al [7] in another building
located in Angra do Heroísmo, with values between 0,2 GPa and 0,5 GPa.
2. In the shear-compression testing system, the maximum horizontal forces of the reference models was near to their mean value, of 23,8 kN, for a mean vertical load of about 109 kN. On the contrary, the transversal stiffness and the deformation in rupture presented some variability, even though rather significant, due to the typical heterogeneity of the rubble stone masonry.
3. The average value of the bulk density of the masonry (17,6 kN/m3) is similar to other
values, namely those obtained in situ by A. Costa [3] and C. Oliveira [7], both of 18 kN/m3.
4. The values of the mortar’s resistance, obtained along time (during the tests of the reference and strengthened models) were influenced by the fact that such mortar was done in work environment (and not in the laboratory), even though all the careful used in it. 5. The developed analysis (Pinho [8]) gave also a Poisson coefficient, ν = 0,24. This value is quite comparable to the one mentioned in Eurocode 6 (EC6) [5], of ν = 0,25.
6. However, considering the mechanical resistance of both mortar (0,6 MPa), obtained during the experimental tests of the reference models (figure 13), and stones (47,8 MPa), the value given by the expression 3.1 of EC6, for the quantification of the masonry resistance to compression (4,35 MPa), is far from the mean experimental one (0,43 MPa), confirming that
EC6 must not be used to analyze this kind of masonry.
ACKNOWLEDGMENTS
This research was developed in the Structural Laboratory of DEC-FCT/UNL, and the first author was supported by a scholarship through the Program 2/5.3/PRODEP/2002.
Bibliographic references
1 APPLETON, João -
Edifícios Antigos. Contribuição para o Estudo do seu Comportamento e das Acções de Reabilitação a Empreender. Programa de investigação apresentado a
concurso para provimento na categoria de investigador-coordenador. LNEC, Lisboa, 1991.
2 COMITÉ EUROPÉEN DE NORMALISATION –
Specification for Mortar for Masonry – Part 2: Masonry Mortar. EN 998-2. April, 2003.
3 COSTA, Aníbal –
Caracterização das Propriedades Mecânicas das Paredes de Alvenaria Tradicional das Casas da Ilha do Faial, Açores. REPAR 2000 - Encontro Nacional sobre
Conservação e Reabilitação de Estruturas. LNEC, Lisboa, Junho de 2000.
4 INSTITUTO NACIONAL DE ESTATÍSTICA –
Recenseamento Geral da População e da Habitação. Censos 2001. Lisboa, 2003.
5 INSTITUTO PORTUGUÊS DA QUALIDADE –
Eurocódigo 6. Projecto de Estruturas de Alvenaria. Parte 1.1: Regras Gerais e Regras para edifícios. NP ENV 1996-1. IPQ,
Lisboa, 2000.
6 NERO, José; APPLETON, João and GOMES, Abdias –
As Argamassas Tradicionais no Parque Edificado de Lisboa: Uma Colaboração para o seu Conhecimento. 2º Encontro
sobre conservação e reabilitação de edifícios. LNEC, Lisboa, 1994.
7 OLIVEIRA, Carlos
et al – Um estudo sobre o comportamento sísmico de edifícios de alvenaria tradicional. REPAR 2000 - Encontro Nacional sobre Conservação e Reabilitação
de Estruturas. LNEC, Lisboa, Junho de 2000.
8 PINHO, Fernando –
Paredes de Alvenaria Ordinária – Estudo Experimental com Modelos Simples e Reforçados. PhD Thesis. Engenharia Civil - Ciências da Construção.
DEC-FCT/UNL. Lisboa. Outubro, 2007
9 PINHO, Fernando –
Paredes de Edifícios Antigos em Portugal. Colecção Edifícios. Nº 8.
1ª Edição. LNEC, Lisboa, 2000.
10 PINHO, Fernando; BAIÃO, Manuel and LÚCIO, Válter –
Estudo Experimental sobre Técnicas de Consolidação de Paredes de Alvenaria de pedra Ordinária. 2º Congresso
Nacional da Construção 2004. FEUP, Porto, 2004.
11 ROQUE, João; LOURENÇO, Paulo –
Caracterização Mecânica de Paredes Antigas. Um Caso de Estudo no Centro Histórico de Bragança. I. P. Bragança / Universidade do Minho.
12 SANTOS, C.
et al – Desenvolvimento de Metodologias para Avaliação dos efeitos da Humidade em Paredes Antigas. 2º Congresso Nacional da Construção. FEUP, Porto, Dezembro
de 2004.
13 VALLUZZI, Rosa
et al – Behaviour of Multi-leaf Stone Masonry Walls Strengthened by Different Intervention Techniques. Historical Constructions, Guimarães, 2001.
14 VEIGA, Rosário
et al – Metodologias para a Caracterização e Conservação de Argamassas de Revestimento de Edifícios Antigos. Relatório Final do Projecto Oldrenders,


![Figure 10 shows the obtained results in ten models at about 90 days. Other ages, not present here, were also analyzed (Pinho [8])](https://thumb-eu.123doks.com/thumbv2/123dok_br/16585551.738740/7.748.165.612.694.897/figure-shows-obtained-results-models-present-analyzed-pinho.webp)