REVISTA
PAULISTA
DE
PEDIATRIA
www.rpped.com.br
ORIGINAL
ARTICLE
Socioeconomic
status
indicators,
physical
activity,
and
overweight/obesity
in
Brazilian
children
Victor
Keihan
Rodrigues
Matsudo
a,
Gerson
Luis
de
Moraes
Ferrari
a,b,∗,
Timóteo
Leandro
Araújo
a,
Luis
Carlos
Oliveira
a,
Emily
Mire
c,
Tiago
V.
Barreira
d,c,
Catrine
Tudor-Locke
c,
Peter
Katzmarzyk
caCentrodeEstudosdoLaboratóriodeAptidãoFísicadeSãoCaetanodoSul(CELAFISCS),SãoCaetanodoSul,SP,Brazil
bCentrodeAtendimentoeApoioaoAdolescentedoDepartamentodePediatriadaUniversidadeFederaldeSãoPaulo(Unifesp),
SãoPaulo,SP,Brazil
cPenningtonBiomedicalResearchCenter,BatonRouge,LA,UnitedStates dSyracuseUniversity,NewYork,UnitedStates
Received17April2015;accepted9August2015 Availableonline23October2015
KEYWORDS
Accelerometry; Obesity; Adiposity;
Sedentarylifestyle; Child
Abstract
Objective: Toanalyzetheassociationsbetweensocioeconomicstatus(SES)indicatorsand phys-icalactivityandoverweight/obesityinchildren.
Methods: 485childrenworeaccelerometersfor7days.Variablesincludedtimeinsedentary behavior and moderate-to-vigorous physical activity (MVPA), and steps/day. Children were furthercategorizedasmeetingornotmeetingguidelinesof≥60min/dayMVPAand≥12,000
steps/day.Bodymassindex(BMI)andbodyfatpercentage(BF%)weremeasuredusing bioelec-tricalimpedance.Overweight/obesitywas definedasBMI>+1SDandBF%≥85thpercentile.
Parents answered questionnaires that questioned total annual household income, parental educationlevel,parentalemploymentstatusandautomobileownership.
Results: Children averaged 59.5min/day in MVPA (44.1% met MVPA guidelines), and 9639 steps/day(18.4%metsteps/dayguidelines).45.4%and33%wereoverweight/obeseclassifiedby BMIandBF%respectively.Higherrelativetotalannualhouseholdincomelevel(OddsRatio0.31; 95%confidenceinterval=0.15---0.65),andrelativelyhighermaternal(OR=0.38;95%CI=0.20---0.72) andpaternal(OR=0.36;95%CI=0.17---0.75)educationlevelswereassociatedwithloweroddsof childrenmeetingMVPAguidelines.Householdautomobileownershipwasassociatedwithlower oddsofchildrenmeetingMVPA(OR=0.48;95%CI=0.31---0.75)andsteps/dayguidelines(OR=0.44; 95%CI=0.26---0.74).
Conclusions: SESindicatorswerenotassociatedwithoverweight/obesity,buthigherSESwas associatedwithloweroddsofchildrenmeetingMVPAguidelines.
©2015SociedadedePediatriadeSãoPaulo.PublishedbyElsevierEditoraLtda.Thisisanopen accessarticleundertheCCBYlicense(https://creativecommons.org/licenses/by/4.0/).
∗Correspondingauthor.
E-mail:[email protected](G.L.M.Ferrari).
http://dx.doi.org/10.1016/j.rppede.2015.08.018
PALAVRAS-CHAVE
Acelerometria; Obesidade; Adiposidade; Estilodevida sedentário; Crianc¸a
Indicadoresdenívelsocioeconômico,atividadefísicaesobrepeso/obesidadeem crianc¸asbrasileiras
Resumo
Objetivo: Analisarasassociac¸õesentreindicadoresdenívelsocioeconômico(NSE)eatividade físicaesobrepeso/obesidadeemcrianc¸as.
Métodos: 485crianc¸asusaramacelerômetrospor7dias.Asvariáveisincluíramotempo em comportamentossedentárioseatividadefísicamoderadaavigorosa(AFMV),epassos/dia.As crianc¸asforamaindaclassificadascomosatisfazendoounãoocumprimentodasdiretrizesde
≥60min/diaMVPAe≥12.000passos/dia.Índicedemassacorporal(IMC)epercentualdegordura
corporal (%GC)forammedidos atravésde impedânciabioelétrica. Sobrepeso/ obesidadefoi definido como IMC>+1SDe um %GC≥percentil 85. Ospaisresponderam aquestionáriosque
questionavamorendimentototalanualdasfamílias,oníveldeeducac¸ãodospais,situac¸ãode empregodospaisepropriedadedeautomóvel.
Resultados: Ascrianc¸asmostraramumamédiade59,5min/diadeAFMV(44,1%atingiramas diretrizesdeAFVM),e9.639passos/dia(18,4%atingiramasdiretrizesdepassos/dia).45,4% e33%estavamcomsobrepeso/obesidadeclassificadapeloIMCe%GC,respectivamente.Maior nívelderendafamiliaranualtotal(oddsratio0,31;intervalodeconfianc¸ade95%=0,15-0,65),e níveisrelativamentemaiselevadosdeeducac¸ãomaterna(OR=0,38;IC95%=0,20-0,72)epaterno (OR=0,36; IC95%=0.17-0.75), foramassociados commenor chance de crianc¸as atingirem as diretrizesdeAFVM.Propriedadedeautomóvelfoiassociadacommenorchancedecrianc¸as atin-giremasdiretrizesdeAFVM(OR=0,48;IC95%=0,31-0,75)ediretrizesdepassos/dia(OR=0,44; IC95%=0,26-0,74).
Conclusões: OsindicadoresdeNSEnãoforamassociadoscomsobrepeso/obesidade,masmaior NESfoiassociadocommenorchancedecrianc¸asatingiremdiretrizesdeAFVM.
©2015SociedadedePediatriadeSãoPaulo.PublicadoporElsevierEditoraLtda.Esteéumartigo OpenAccesssobalicençaCCBY(https://creativecommons.org/licenses/by/4.0/deed.pt).
Introduction
Regular physical activity is associated with an array of health benefits for children.1 Unfortunately, the majority
of childrenin Brazil arenotsufficiently active.Currently, only 38.6% of boys and 20.1% of girls accumulate the recommended ≥60min/dayof moderate-to-vigorous phys-icalactivity(MVPA).2 Further,the2009 National Surveyof
SchoolHealthorBrazilianNationalSurveyofSchoolHealth (PesquisaNacionaldeSaúdedoEscolar---PeNSE) reported thatoneinthree(33.5%)Brazilianchildrenhadoverweight, and16.6%ofboysand11.8%ofgirlswereobese.3
Physicalactivity andoverweight/obesityareinfluenced bycomplexfactorsthatvarywidelybetween countries.4,5
Socioeconomicstatus(SES)isoneofthesefactorsbecause it influences people’s attitudes, experiences, and expo-suretoseveralhealthriskfactors.2,6Indeed,SESindicators
(e.g., annual household income, parental educationlevel andparental employment status)arerelated toa variety ofchronicdiseasesinchildren.7,8Althoughithasbeen
dif-ferentiallydefinedandmeasured,SESgenerallydisplaysan inverse relationship withchildhood overweight/obesity in developedcountries.5,9
For example, in the United States, the Early Child-hood Longitudinal Study-Birth Cohort (ECLS-B) showed that SES (defined as total annual household income and maternal education) was inversely associated with over-weight/obesity[bodymassindex(BMI)>2SDz-scores].9
Children’slack of physical activity andthe high preva-lenceofoverweight/obesityremainacombinedchallengein developedcountries,andnowposeagrowingpublichealth threat.10 Paradoxically,although80%oftheglobal
popula-tionislocatedindevelopingcountries,onlyasmallfraction ofresearchfocusedondeterminantsofoverweight/obesity and physical activity is conducted in these nations.4,11
A Kenyan study reported negative associations between SESindicators (definedastotal householdannual income, parentaleducationlevelandpublicversus privateschool) andchildren’saccelerometry, determined achievement of MVPA guidelines (defined and a mean of ≥60min/day at ≥3000 counts/min).12 In Brazil, however, Rezende et al.2 reportedasignificant positiveassociation between mater-nal education level and self-reported physical activity in adolescents.
measures of physical activity and overweight/obesity in Brazilianchildren.
Method
Datawere collectedas partof the International Study of ChildhoodObesity,LifestyleandEnvironment(ISCOLE).The primaryaimofISCOLEwastoinvestigatetheinfluenceofthe physical,social,andpolicyenvironmentsontherelationship betweenchildren’slifestylecharacteristicsandobesityin12 countriesfromallmajorworldregions.DetailsoftheISCOLE studyprotocolareprovidedelsewhere.13Datacollectionfor
thispaperwasconductedintheurbanBraziliancityofSão CaetanodoSul.
A random cluster sample of 564 5th grade Brazilian children (277 boys and 287 girls; 9---11 years of age) was assessedfrom20schools.Afterexclusioncriteria(non-valid accelerometerdata,detailsbelow),thefinalsample com-prised 485 children (238 boys and 247 girls). Data were collectedduringtheschoolyear fromMarch2012toApril 2013.Allassessmentswereconductedduringafullweekat eachschool.
Random listsof public(16) and private(4) elementary schoolsintheregionofSãoCaetanodoSul,SãoPaulo, South-eastBrazil,weregenerated,andschoolswereselectedfrom eachlistataratioof4(public)to1(private).This80%public to20%privateschoolsratiowaspurposelyimplementedto maximizeSESdistribution.Ifaschoolrefusedtoparticipate inthestudy,itwasreplacedbythenextschoolonthelist, maintainingthesamepublictoprivateschoolratio.A ran-domsampleof25---30childrenwasselectedperschoolwith a stipulation that each sexcomprise 50% of the selected sample.
As described previously in detail,13 all data collection
and management activities were performed and moni-toredlocally following rigorousqualitycontrolprocedures that were overseen by the ISCOLE Coordinating Center. Prior to participation, children and at least one of their parents/legal guardians were asked to sign the Instru-mentofConsentaccordingtoResolution196/96ofBrazil’s NationalHealthCouncil.Ethicalapprovalwasobtainedfrom the Pennington Biomedical Research Center Institutional Review Board and the Federal University of São Paulo, Brazil.
Oneparent or legalguardian wasasked tocomplete a questionnairethatincludedquestionsrelatedtothehealth historyofthechild,totalannualhouseholdincome,parental education level, parental employment status and house-hold automobile ownership. Many questions were asked separatelyaboutboth maternal andpaternalparents,but the identity of the familial relationship of the individ-ual completing the questionnaire (mother or father) was notcapturedbythequestionnaire.Totalannualhousehold incomewasused asa primarymarker of family-levelSES andwascategorizedintofourcategoriesbasedonthe dis-tributionofthedata.Thesecategoriesrepresentincreasing levelsofannualincome(Braziliancurrency)suchthatthose withthelowestincomewereorganizedintothefirst cate-gory,andthosewiththehighestincomewereinthelast,as follows:<R$19,620(level1);R$19,621toR$32,700(level2); R$32,701 to R$58,860 (level 3), and >R$58,861 (level 4).
Additional indicators directly related to SES included parental education level (some high school or less, high school diploma/some college, or Bachelor’s/professional degree), maternalandpaternalemploymentstatus(none, less than part time, part time, or full time) and house-hold automobile ownership (yes or no). Type of school, public versus private, as established during sampling was also considered an indicator of lower and higher SES, respectively.
New technologies applied to the measurement of body movement have emerged as an alternative method for assessment of physical activity. Instruments such as accelerometers provide new ways to estimate the fre-quency, duration, and intensity of physical activity in free-living individuals.11 Importantly, thesemethods avoid
someoftheinherentlimitationsofself-reportinstruments, that is, the recall bias. Accelerometry has become more common in studies of childhood physical activity around the world.11 Therefore, Actigraph GT3X+ accelerometers
(ActiGraph,Ft.WaltonBeach,UnitedStates)wereusedto objectivelymonitorsedentarybehavior(SB),lightphysical activity (LPA), moderate physical activity (MPA), vigorous physicalactivity(VPA),MVPAandsteps/day.The accelerom-eter waswornat the waistonan elasticizedbelt aligned withthemid-axillaryline.Thechildrenwereencouragedto weartheaccelerometer24h/dayforatleast7days(plusan initialfamiliarizationdayandthemorningofthefinalday), including2weekenddays.To beincludedin thisanalysis, children wererequired tohave valid accelerometerdata, definedashaving≥4days(includingatleastoneweekend day)with≥10hoursofwakeweartimeperday.14,15
Datawerecollectedat asamplingrateof80Hz, down-loaded in 1-s epochs, and re-integrated to 15s epochs.16
Activitycountcut-pointsestablishedbyEvensonetal.16for
15sepochswereappliedtothedata.Thecut-pointscapture the sporadic natureof children’sactivity and provide the bestclassificationaccuracy amongthe currentlyavailable cut-pointsforphysicalactivityinchildren.14SBwasdefined
astimeaccumulatedat≤25activitycounts/15s,>25 activ-itycounts/15s forLPA,≥574---1002activity counts/15sfor MPA,≥1003activitycounts/15sforVPA,and≥574activity counts/15s for MVPA. Childrenwerecategorized as meet-ing(mean≥60min/day)or notmeetingMVPAguidelines,17
and meeting (mean ≥12,000 steps/day) or not meeting steps/dayguidelines.18
Height, weight, BMI and body fat percentage (BF%) measureswereobtainedaccording tostandardizedISCOLE procedures.13 Height wasmeasured without shoesusing a
Seca213 portablestadiometer(Hamburg,Germany),with the participant’shead in theFrankfort Plane. Weight and BF% were measured using a portable Tanita SC-240 body compositionanalyzer(ArlingtonHeights,IL)afterallouter clothing, heavy pocket items and shoes and socks were removed.19 The childrenwereencouragedtocome tothe
schoolfollowinga10hfast.Therewerenoinstructions pro-videdtotheparticipantsregardingexercisethedaybefore thetest.19 Eachchild wasmeasuredtwiceand,when
BMI was calculated using the standard formula weight (kg)/height (m)2 and, thereafter, BMI z-scores calculated basedongrowthreferencedatafromtheWorldHealth Orga-nization(WHO),andparticipantswerefurthercategorized asunderweight:<−2SD;normalweight:−2SDto1SD; over-weight:>+1 SDto2; and obese:>+2 SD.20 BF% cut-points
were calculated according to sex, and we defined those participants as overweight/obese whose BF% was ≥85th percentile of sex-specificreferencedata fromchildren in the United Kingdom,21 since no other more
population-appropriatereferencedatawereavailable.
Descriptivestatisticsincludedmeansandstandard devi-ations or frequencies, as appropriate. Multi-level logistic regression was usedto determine the SES indicators that bestpredictedMVPA(mean≥60min/day),steps/day(mean ≥12,000steps/day),andoverweight/obesity(BMIandBF%). OursetofmodelswererunindividuallyforeachSESvariable andallowedfor clusteringattheschoollevel. Weshowed thatonlyunivariatemodelswereemployedduetoissuesof multi-collinearityamongtheSESindicatorpredictor varia-bles.
The adjusted Odds Ratio (OR) and respective confi-dence interval (95%CI) were obtained from multivariable logistic regression models investigating the odds of four different outcomes: meeting MVPA guidelines,17
meet-ingsteps/dayguidelines,18 overweight/obeseclassification
basedonBF%,21 andoverweight/obeseclassificationbased
onBMI.20 Asignificancelevelof p<0.05 wasusedto
inter-pretinferentialanalyses.Allanalyseswerecomputedusing StatisticalAnalysisSystem(SASInstitute,version9.3,Cary, NC,UnitedStates).22
Results
Characteristicsof participating children and theirparents aresummarizedinTables1and2.Ofthe485participants, 49% were boys and 51% were girls. Children’s mean SB timewas499.7min/day(506.6min/dayonweekdaysversus 481.3min/dayonweekenddays).Themeandailytimespent inLPAwas337.3min/day;41.8min/dayinMPA;17.6min/day in VPA and 59.5min/day in combinedMVPA. The children accumulated more MVPA (6.5min/day) on weekdays than weekenddays.ThepercentofchildrenwhometMVPA guide-lines was 44.1%. The children averaged 9639 steps/day, accumulated 752 more steps/day on weekdays than on weekenddaysand18.4%of childrenmetsteps/day guide-lines(Table1).
The meanBF%was23%and wefound that33%of chil-drenexceededtheappliedBF%cut-pointthatrepresented the85thpercentile ofthe referencedata.21 On theother
hand,basedonWHOBMIz-scorecategorization,20wefound
that2.3%ofchildrenwereunderweight,52.4%werenormal weight,23.1% wereoverweight, and22.3% wereobese (a combined45.4%wereoverweight/obese)(Table1).
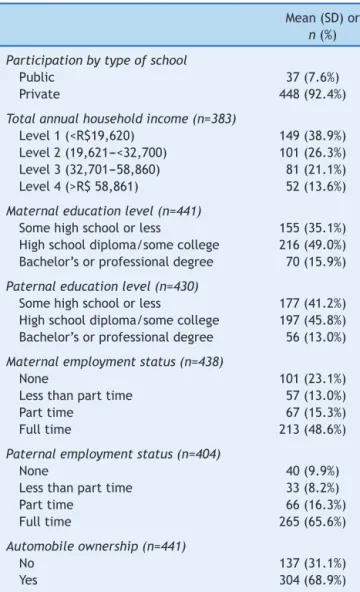
Of the all participants,92.4% attended publicschools, while7.6%wereenrolledinprivateschools.Ofthe485 ques-tionnairesdistributedtochildren’sparents/legalguardians, wereceived383withinformationabouttotalannual house-holdincome, 441withmaternal educationlevel,430with paternaleducationlevel(429withbothmaternaland pater-naleducationlevel),438withmaternalemploymentstatus,
Table1 Descriptiveanalysis(mean[SD]orn[%])of indica-torsofaccelerometer-deriveddataandoverweight/obesity ofBrazilianchildren.
Mean(SD)or
n(%)
Sex(n=485)
Boys 238(49.0) Girls 247(51.0)
SBandphysicalactivity(n=485)
SB(min/day) 499.7(69.05) WeekdaySB(min/day) 506.6(74.8) WeekendSB(min/day) 481.3(98.3) LPA(min/day) 337.3(52.9) MPA(min/day) 41.8(16.6) VPA(min/day) 17.6(11.3) MVPA(min/day) 59.5(26.3) WeekdayMVPA(min/day) 61.4(26.9) WeekendMVPA(min/day) 54.9(35.2) Dailysteps(steps/day) 9639(2.780) Weekdaysteps(steps/day) 9857(2.846) Weekendsteps(steps/day) 9105(3.982) MeetingMVPAguidelines(mean
≥60min/day)17
214(44.1%)
Meetingsteps/dayguidelines (≥12,000steps/day)18
89(18.4%)
BF%(n=485) 23.0(9.2)
BF%categories(UnitedKingdomreferencedata)21
Normal 325(67%)
Overweight/obesity 160(33%) BMI(kg/m2)(n=485) 19.8(4.4) BMIcategories(WHOcut-points)20
Underweight 11(2.3%) Normalweight 254(52.4%) Overweight 112(23.1%)
Obese 108(22.3%)
SB,sedentarybehavior;LPA,lightphysicalactivity;MPA,
mod-eratephysical activity;VPA,vigorous physicalactivity;MVPA,
moderate/vigorousphysicalactivity;min:minutes.BF%,body
fatpercentage;BMI,bodymassindex;WHO,WorldHealth
Orga-nization.
404withpaternalemploymentstatus(401withboth mater-nalandpaternalemploymentstatus)and441withhousehold automobileownershipinformation(Table2).
A majority of reported total annual household income (38.9%) fell into the low category (level 1), while 26.3%, 21.1% and 13.6% comprised levels two through four, respectively. Ahigher proportionof mothers (15.9%) than fathers(13.0%) were reportedashaving attained a Bach-elor’s/professional degree. Responses to maternal and paternalemploymentstatusindicatedthat48.6%and65.6% workedfulltime,respectively.Ahigherproportionof moth-ers(23.1%)thanfathers(9.9%)didnotworkand68.9%ofthe childrencamefromhouseholdswithatleastoneautomobile (Table2).
Table2 Descriptiveanalysisn(%)ofindicatorsofSESof Brazilianchildren.
Mean(SD)or
n(%)
Participationbytypeofschool
Public 37(7.6%) Private 448(92.4%)
Totalannualhouseholdincome(n=383)
Level1(<R$19,620) 149(38.9%) Level2(19,621---<32,700) 101(26.3%) Level3(32,701---58,860) 81(21.1%) Level4(>R$58,861) 52(13.6%)
Maternaleducationlevel(n=441)
Somehighschoolorless 155(35.1%) Highschooldiploma/somecollege 216(49.0%) Bachelor’sorprofessionaldegree 70(15.9%)
Paternaleducationlevel(n=430)
Somehighschoolorless 177(41.2%) Highschooldiploma/somecollege 197(45.8%) Bachelor’sorprofessionaldegree 56(13.0%)
Maternalemploymentstatus(n=438)
None 101(23.1%) Lessthanparttime 57(13.0%) Parttime 67(15.3%) Fulltime 213(48.6%)
Paternalemploymentstatus(n=404)
None 40(9.9%) Lessthanparttime 33(8.2%) Parttime 66(16.3%) Fulltime 265(65.6%)
Automobileownership(n=441)
No 137(31.1%) Yes 304(68.9%)
R$,BrazilianReal.
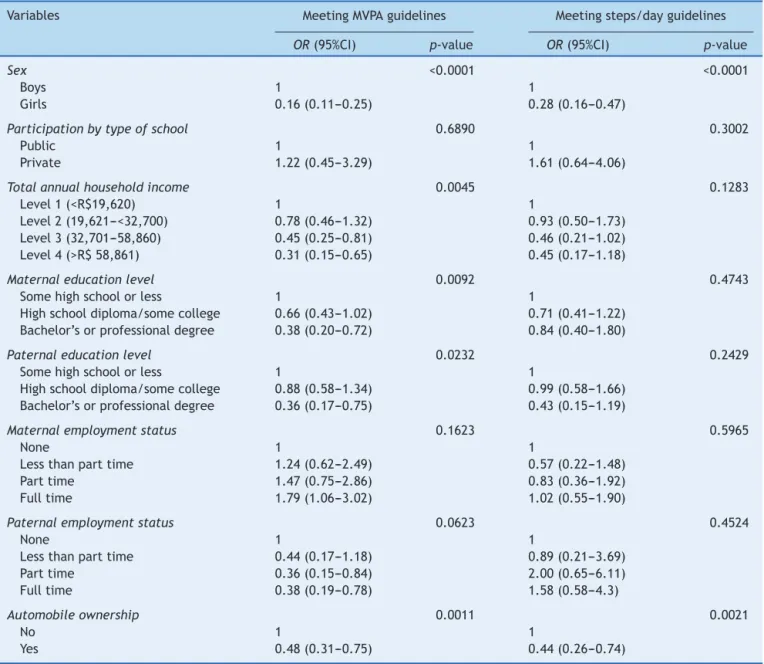
guidelines.Theseanalyseswereperformedusingmultilevel modelsthatallowedtheintercepttovaryforeachschool. As shown in Table3, multi-level logisticregression analy-sisrevealed that girls were at significantly lowerodds of meetingMVPAguidelineswhencomparedtoboys.
Therewerenegativeassociationsbetweentotalannual householdincome, both maternal and paternal education level and meeting MVPA guidelines. Higher total house-hold annual income and higher levels for both parents education were associated with lower odds of the child meetingMVPA guidelines.Childrenwhocame from house-holds with at least one automobile were also less likely tomeet MVPA guidelines. On the other hand, therewere nosignificant associations between typeof school, either maternalorpaternalemploymentstatus,andmeetingMVPA guidelines.
Girls and children from households with at least one automobilewereless likelytomeetsteps/day guidelines. Meetingsteps/dayguidelineswasnotassociatedwithtype ofschool,totalannualhouseholdincome,maternalor pater-naleducationlevelsoremploymentstatus.
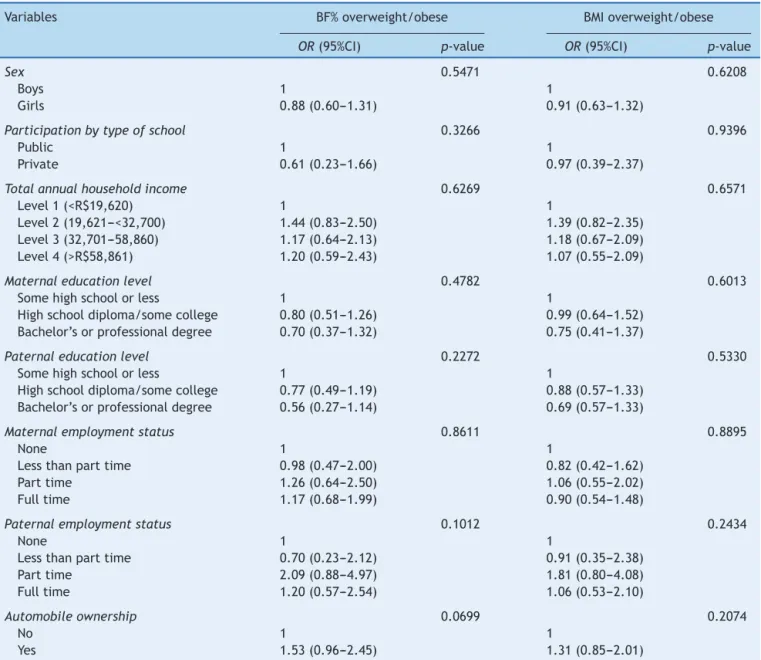
Table4presentsthemulti-levellogisticregression anal-ysis for overweight/obesity, accounting for school-level clustering.Therewerenosignificantassociationsbetween anySESindicatorandoverweight/obesityasdefinedbyBF% orBMIinBrazilianchildren.
Discussion
The aim of this study was to examine the association between indicators of SES, physical activity and over-weight/obesity in a sample of Brazilian children. Female genderwasnegativelyassociatedwithmeetingMVPA guide-lines. Total annual household income, parental education level(bothmaternalandpaternal),andhousehold automo-bileownershipwereallnegativelyassociatedwithchildren meetingMVPAguidelineswhenadjustedforschoolandsex. Householdautomobileownershipwasalsonegatively asso-ciatedwithchildren meetingsteps/dayguidelines.On the other hand, we found no significant association between anySESindicatorandoverweight/obesityintheseBrazilian children.
Severalsurveys conductedin developed countriessuch as United States,7 France23 found no significant
associa-tion between accelerometry-determined achievement of MVPA and SES indicators (total annual household income andmaternaleducationlevel).Ontheotherhand,the find-ingsofthisstudyshowedthathighertotalannualhousehold income and parentaleducation level wasassociated with children spending less time in MVPA, pointing to a nega-tivehouseholdSESrelationshipwithchildren’sMVPA,which supportspreviousresearchthathasshownanegative rela-tionshipbetween indicators of SESand children’sMVPA in developingcountries.12Forexample,Muthurietal.12found
highertotalannualhouseholdincomewasassociatedwith lower MVPA in Kenyan children 9---11 year of age. How-ever,theirdefinitionofMVPA(definedas≥3000counts/min) andtotalannualhouseholdincome(low,mediumandhigh) differed fromour own.Also differentfrom the results of our study (OR=1.22; 95%CI=0.45---3.29), the authors found children attending private schools had a 96% lower odds of beingactive when comparedtothose attendingpublic school.
Due to the logistical and financial challenges associ-ated with accelerometry research, Brazilian researchers havepreviouslyreliedonquestionnairestoquantifyphysical activitybehaviors.2,24Rezendeetal.2analyzedself-reported
Table3 Multi-levellogisticregressionforindicatorsofSESwithMVPAandsteps/dayguidelinesinBrazilianchildren. Variables MeetingMVPAguidelines Meetingsteps/dayguidelines
OR(95%CI) p-value OR(95%CI) p-value
Sex <0.0001 <0.0001
Boys 1 1
Girls 0.16(0.11---0.25) 0.28(0.16---0.47)
Participationbytypeofschool 0.6890 0.3002
Public 1 1
Private 1.22(0.45---3.29) 1.61(0.64---4.06)
Totalannualhouseholdincome 0.0045 0.1283
Level1(<R$19,620) 1 1
Level2(19,621---<32,700) 0.78(0.46---1.32) 0.93(0.50---1.73) Level3(32,701---58,860) 0.45(0.25---0.81) 0.46(0.21---1.02) Level4(>R$58,861) 0.31(0.15---0.65) 0.45(0.17---1.18)
Maternaleducationlevel 0.0092 0.4743
Somehighschoolorless 1 1
Highschooldiploma/somecollege 0.66(0.43---1.02) 0.71(0.41---1.22) Bachelor’sorprofessionaldegree 0.38(0.20---0.72) 0.84(0.40---1.80)
Paternaleducationlevel 0.0232 0.2429
Somehighschoolorless 1 1
Highschooldiploma/somecollege 0.88(0.58---1.34) 0.99(0.58---1.66) Bachelor’sorprofessionaldegree 0.36(0.17---0.75) 0.43(0.15---1.19)
Maternalemploymentstatus 0.1623 0.5965
None 1 1
Lessthanparttime 1.24(0.62---2.49) 0.57(0.22---1.48) Parttime 1.47(0.75---2.86) 0.83(0.36---1.92) Fulltime 1.79(1.06---3.02) 1.02(0.55---1.90)
Paternalemploymentstatus 0.0623 0.4524
None 1 1
Lessthanparttime 0.44(0.17---1.18) 0.89(0.21---3.69) Parttime 0.36(0.15---0.84) 2.00(0.65---6.11) Fulltime 0.38(0.19---0.78) 1.58(0.58---4.3)
Automobileownership 0.0011 0.0021
No 1 1
Yes 0.48(0.31---0.75) 0.44(0.26---0.74)
adolescentsattendingprivateschools.The authorsdidnot findasignificantassociationbetweenhouseholdautomobile ownershipandadolescent’sphysicalactivity.Hallaletal.24
found that Brazilian children (10---12 years age) attending privateschoolshada16%higherriskratioofreportingbeing physicallyinactive(definedas<300min/week)comparedto childreninpublicschools.Hallaletal.24showedanegative
associationbetweenfamilySESandchildren’sphysical inac-tivity.ChildrenatthehighestlevelofSEShada27%higher riskratioofbeingphysicallyinactivewhencomparedwith thelowestSESlevel.24
The proportionof children meeting the physical activ-ity guidelines in Brazil (44.1%) is higher than some WesterncountriessuchastheUnitedStates,where objec-tive measures revealed that only 29% of children and youthaccumulatedtherecommended≥60min/dayMVPA.25 In developing countries, only 12.6% (Kenya)12 and <1%
(SouthAfrica)26ofchildrenmetMVPAguidelines,however,
the criteria for meeting MVPA guidelines differs across studies.
In this sample of children from São Caetano do Sul, São Paulo, Southeast Brazil, mean daily time spent in SB was 499.7min/day, LPA was 337.3min/day, and MVPA was 59.5min/day. Contrasting these results with data from children and adolescents with mean age of 13.3 yearsfromanotherregion(Pelotas, SouthernBrazil), Hal-lal et al.27 reported higher accelerometer-determined SB
(660min/day)and lower valuesfor LPA (189min/day)and MVPA(35min/day).TheirdefinitionofSB(definedas≤100 counts/min),LPA (defined as >100---2295 counts/min) and MVPA(definedas≥2296activitycounts/min)differedfrom ourown(SBdefinedas≤25activitycounts/15s;LPAdefined as>25activitycounts/15sandMVPAdefinedas≥574activity counts/min).
Alsoincontrasttoourfindings,Drenowatzetal.7divided
Table4 Multi-levellogisticregressionforindicatorsofSESwithBF%andBMIoverweight/obesityinBrazilianchildren. Variables BF%overweight/obese BMIoverweight/obese
OR(95%CI) p-value OR(95%CI) p-value
Sex 0.5471 0.6208
Boys 1 1
Girls 0.88(0.60---1.31) 0.91(0.63---1.32)
Participationbytypeofschool 0.3266 0.9396
Public 1 1
Private 0.61(0.23---1.66) 0.97(0.39---2.37)
Totalannualhouseholdincome 0.6269 0.6571
Level1(<R$19,620) 1 1
Level2(19,621---<32,700) 1.44(0.83---2.50) 1.39(0.82---2.35) Level3(32,701---58,860) 1.17(0.64---2.13) 1.18(0.67---2.09) Level4(>R$58,861) 1.20(0.59---2.43) 1.07(0.55---2.09)
Maternaleducationlevel 0.4782 0.6013
Somehighschoolorless 1 1
Highschooldiploma/somecollege 0.80(0.51---1.26) 0.99(0.64---1.52) Bachelor’sorprofessionaldegree 0.70(0.37---1.32) 0.75(0.41---1.37)
Paternaleducationlevel 0.2272 0.5330
Somehighschoolorless 1 1
Highschooldiploma/somecollege 0.77(0.49---1.19) 0.88(0.57---1.33) Bachelor’sorprofessionaldegree 0.56(0.27---1.14) 0.69(0.57---1.33)
Maternalemploymentstatus 0.8611 0.8895
None 1 1
Lessthanparttime 0.98(0.47---2.00) 0.82(0.42---1.62) Parttime 1.26(0.64---2.50) 1.06(0.55---2.02) Fulltime 1.17(0.68---1.99) 0.90(0.54---1.48)
Paternalemploymentstatus 0.1012 0.2434
None 1 1
Lessthanparttime 0.70(0.23---2.12) 0.91(0.35---2.38) Parttime 2.09(0.88---4.97) 1.81(0.80---4.08) Fulltime 1.20(0.57---2.54) 1.06(0.53---2.10)
Automobileownership 0.0699 0.2074
No 1 1
Yes 1.53(0.96---2.45) 1.31(0.85---2.01)
fivegroups bytotal annualhouseholdincome(<R$24,999; R$25,000toR$35,999; R$36,000toR$54,999; R$55,000to R$100,000;>R$100,000)and usedpedometerstoevaluate steps/day.Theauthorsfoundapositiveassociationbetween steps/day and annual household income. The group with higher total annual household income (12,270 steps/day) walked1335steps/daymorethanthegroupwiththe low-esttotalannualhouseholdincome(10,935steps/day).We showed no association between total annual household incomeandmeetingsteps/dayguidelines.
The results revealed substantial proportions of child-hood overweight/obesity (45.4%) for this age group. These figures are higher than values in developed countries such as in the United States and Canada, which have childhood overweight/obesity (BMI defined as ≥85th percentile) prevalence of 33% and 29%, respectively.28,29Thesefindingsareindicativeofanexisting
threat of childhood overweight/obesity amongBrazilian’s
school-aged children from in the city of São Caetano do Sul.
InBrazil,recentdatahavealsorevealedhighprevalence ofoverweight/obesityinchildren.Theresultsindicatethat 37.2% Brazilianchildren of10---11 yearsof agewere over-weight/obese (defined as >+1 SD).3 In the present study,
we found asimilarly high(45.8% BMI)prevalence of over-weight/obesityinoneregion.
ContrastingourresultsregardingtheSESindicators,the
NationalHealthandNutritionExaminationSurvey(NHANES) datafromtheUnitedStatesfoundasignificantinverse asso-ciationbetweenparentaleducationlevelandtotalannual householdincomewithoverweight/obesity(BMIdefinedas ≥85th percentile) in children.30 We did not find that any SESindicatordefinedhereinwasassociatedwithchildren’s’ overweight/obesity.
causality.Further,eventhough the studyinvolved schools fromSãoCaetano doSul,it does notprovidea nationally representative sample. Nevertheless, this study provides robust objective measures of several behavioral risk fac-tors andrelatedcorrelatesamongalarge groupof school children.Itprovidesevidenceforahighprevalenceof phys-icalinactivityandoverweight/obesityinchildrenfromthe city of São Caetano do Sul,Brazil. In contrastto findings fromdevelopedcountries,wefoundthathighertotalannual householdincomeandparentaleducationlevelwere asso-ciated with a lower likelihood of children meeting MVPA guidelines.Householdautomobileownershipwasnegatively associatedwithmeetingboththeMVPAandsteps/day guide-lines. We did not find any association between any SES indicators and overweight/obesity in this age restricted sample.
Longitudinal studies are needed to provide a better understandingofthecausalrelationshipbetweenSES indi-cators, MVPA, steps/day and overweight/obesity, during childhoodwhichcouldcontribute toahighersuccess-rate ofinterventions. Itisimportanttodevelopbroadnational policies and programs tofight the physical inactivity and obesityepidemic.
Funding
TheInternationalStudyofChildhoodObesity,Lifestyleand Environment (ISCOLE) wasfunded byCoca-Cola Company. The funder had no role in study design, data collection and analysis, decision to publish or preparation of the manuscript.
Conflicts
of
interest
Theauthorsdeclarenoconflictsofinterest.
References
1.JanssenI,LeblancAG.Systematicreviewofthehealth bene-fitsofphysicalactivityandfitnessinschool-agedchildrenand youth.IntBehavNutrPhysAct.2010;7:40.
2.DeRezendeLF,AzeredoCM,CanellaDS,ClaroRM,deCastroIR, LevyRB,etal.Sociodemographicandbehavioralfactors associ-atedwithphysicalactivityinBrazilianadolescents.BMCPublic Health.2014;14:485.
3.Brasil---InstitutoBrasileirodeGeografiaeEstatística.Pesquisa deOrc¸amentosFamiliares (POF)2008---2009:antropometriae estadonutricionaldecrianc¸as,adolescenteseadultosnoBrasil. RiodeJaneiro:IBGE;2010.
4.BaumanAE,ReisRS,SallisJF,WellsJC,LoosRJ,MartinBW,etal. Correlatesofphysicalactivity:whyaresomepeoplephysically activeandothersnot?Lancet.2012;380:258---71.
5.Leung MM, Agaronov A, Grytsenko K, Yeh MC. Intervening toreduce sedentarybehaviors and childhood obesity among school-ageyouth:asystematicreviewofrandomizedTrials.J Obes.2012;2012:685430.
6.HuurreT,AroH,RahkonenO.Well-beingandhealthbehaviour byparentalsocioeconomic status: a follow-upstudyof ado-lescentsaged16untilage32years.SocPsychiatryPsychiatr Epidemiol.2003;38:249---55.
7.DrenowatzC,Eisenmann JC,Pfeiffer KA,WelkG, Heelan K, GentileD,etal.Influenceofsocio-economicstatusonhabitual physicalactivity andsedentarybehavior in8-to11-year old children.BMCPublicHealth.2010;10:214.
8.ChenE,LeeWK,CaveyL,HoA.Rolemodelsandthe psycholog-icalcharacteristicsthatbufferlow-socioeconomic-statusyouth fromcardiovascularrisk.ChildDev.2013;84:1241---52.
9.Jones-SmithJC,DieckmannMG,GottliebL,ChowJ,FernaldLC. Socioeconomicstatusandtrajectoryofoverweightfrombirth tomid-childhood:theearlychildhoodlongitudinalstudy-birth cohort.PLoSOne.2014;20:e100181.
10.OnyweraVO.Childhoodobesityandphysicalinactivitythreatin Africa:strategiesforahealthyfuture.GlobalHealthPromot. 2010;17:45---6.
11.HallalPC,AndersenLB,BullFC,GutholdR,HaskellW,Ekelund U,etal.Globalphysicalactivitylevels:surveillanceprogress, pitfalls,andprospects.Lancet.2012;380:247---57.
12.MuthuriSK,WachiraLJ,OnyweraVO,TremblayMS.Correlates ofobjectivelymeasuredoverweight/obesityandphysical activ-ityinKenyanschoolchildren:resultsfromISCOLE-Kenya.BMC PublicHealth.2014;14:436.
13.KatzmarzykPT,BarreiraTV,BroylesST,ChampagneCM,Chaput JP, FogelholmM,etal. TheInternationalStudyofChildhood Obesity Lifestyle and the Environment (ISCOLE): design and methods.BMCPublicHealth.2013;13:900.
14.Trost SG, Loprinzi PD, Moore R, Pfeiffer KA. Comparison of accelerometer cut points for predicting activity intensityin youth.MedSciSportsExerc.2011;43:1360---8.
15.ColleyR,ConnorGorberS,TremblayMS.Quality controland datareductionproceduresforaccelerometry-derivedmeasures ofphysicalactivity.HealthRep.2010;21:63---9.
16.Evenson KR, Catellier DJ, Gill K, Ondrak KS, McMurray RG. Calibrationoftwoobjectivemeasuresofphysicalactivityfor children.JSportsSci.2008;26:1557---65.
17.WorldHealthOrganization.Globalrecommendationson physi-calactivityforhealth.Geneva:WHO;2010.
18.ColleyRC,JanssenI,TremblayMS.Dailysteptargettomeasure adherencetophysicalactivityguidelinesinchildren.MedSci SportsExerc.2012;44:977---82.
19.BarreiraTV,StaianoAE,KatzmarzykPT.Validityassessmentofa portablebioimpedancescaletoestimatebodyfatpercentagein whiteandAfrican-Americanchildrenandadolescents.Pediatr Obes.2013;8:e29---32.
20.DeOnisM,OnyangoAW,BorghiE,SiyamA,NishidaC,Siekmann J. Developmentofa WHO growth reference for school-aged childrenand adolescents. BullWorld HealthOrgan. 2007;85: 660---7.
21.McCarthy HD, Cole TJ, Fry T, Jebb SA, Prentice AM. Body fat reference curves for children. Int J Obes (Lond). 2006;30:598---602.
22.StatisticsforWindows.Release6.12.Cary:SASInstituteInc.; 1996.
23.Baquet G,RidgersND, BlaesA,AucouturierJ,VanPraaghE, BerthoinS.Objectivelyassessedrecessphysicalactivityingirls andboysfromhighandlowsocioeconomicbackgrounds.BMC PublicHealth.2014;14:192.
24.HallalPC,BertoldiAD,Gonc¸alvesH,VictoraCG.Prevalenceof sedentarylifestyleandassociatedfactorsinadolescents10to 12yearsofage.CadSaudePublica.2006;22:1277---87.
25.Camhi SM, Waring ME, SissonSB, Hayman LL, MustA. Phys-ical activity and screentime inmetabolically healthyobese phenotypes in adolescents and adults. J Obes. 2013;2013: 984613.
27.Hallal PC, ReichertFF, Clark VL, Cordeira KL, Menezes AM, EatonS,etal.Energyexpenditurecomparedtophysical activ-itymeasuredbyaccelerometryandself-reportinadolescents: avalidationstudy.PLoSOne.2013;8:e77036.
28.OgdenCL,CarrollMD,KitBK,FlegalKM.Prevalenceofobesity andtrendsinbodymassindexamongUSchildrenand adoles-cents,1999---2010.JAMA.2012;307:483---90.
29.TremblayMS, KatzmarzykPT, Willms JD. Temporal trends in overweightandobesityinCanada,1981---1996.IntJObesRelat MetabDisord.2002;26:538---43.
![Table 1 Descriptive analysis (mean [SD] or n [%]) of indica- indica-tors of accelerometer-derived data and overweight/obesity of Brazilian children](https://thumb-eu.123doks.com/thumbv2/123dok_br/19059002.485653/4.918.467.837.138.735/descriptive-analysis-accelerometer-derived-overweight-obesity-brazilian-children.webp)