Sweet SorghuM PerforManCe affeCted by Soil
CoMPaCtion and Sowing tiMe aS a SeCond CroP in the
brazilian Cerrado
wellingthon da Silva guimarães Júnnyor(1), eduardo da Costa Severiano(2)*, alessandro
guerra da Silva(3), wainer gomes gonçalves(2), renata andrade(4), brendow roberto
rodrigues Martins(4) and guilherme dias Custódio(4)
(1) Instituto Federal de Educação, Ciência e Tecnologia Goiano, Programa de Pós-graduação em Ciências Agrárias - Agronomia, Campus Rio Verde, Rio Verde, Goiás, Brasil.
(2) Instituto Federal de Educação, Ciência e Tecnologia Goiano, Campus Rio Verde, Rio Verde, Goiás, Brasil. (3) Universidade de Rio Verde, Rio Verde, Goiás, Brasil.
(4) Instituto Federal de Educação, Ciência e Tecnologia Goiano, Graduação em Agronomia, Campus Rio Verde, Rio Verde, Goiás, Brasil. * Corresponding author.
E-mail: [email protected]
abStraCt
increasing attention has recently been given to sweet sorghum as a renewable raw material for ethanol production, mainly because its cultivation can be fully mechanized. however, the intensive use of agricultural machinery causes soil structural degradation, especially when performed under inadequate conditions of soil moisture. the aims of this study were to evaluate the physical quality of a Latossolo Vermelho Distroférrico (oxisol) under compaction and its components on sweet sorghum yield forsecond cropsowing in the brazilian Cerrado (brazilian tropical savanna). the experiment was conducted in a randomized block design, in a split plot arrangement, with four replications. five levels of soil compaction were tested from the passing of a tractor at the following traffic intensities: 0 (absence of additional compaction), 1, 2, 7, and 15 passes over the same spot. the subplots consisted of three different sowing times of sweet sorghum during the off-season of 2013 (20/01, 17/02, and 16/03). Soil physical quality was measured through the least limiting water range (llwr) and soil water limitation; crop yield and technological parameters were also measured. Monitoring of soil water contents indicated a reduction in the frequency of water content in the soil within the limits of the LLWR (Fwithin) as agricultural traffic increased (t0 = t1 = t2>t7>t15), and crop yield is directly associated with soil water content. the crop
introduCtion
Diversification of raw materials for biofuel production is the main measure for sustainable development of the Brazilian agroenergy sector (Stambouli et al., 2012). Special attention has recently been given to sweet sorghum (Sorghum bicolor l. moench) as a renewable raw material for ethanol production. Currently, approximately 723 thousand hectares are cultivated with sorghum in Brazil, and the State of Goiás is the largest producer (Conab, 2015).
like sugarcane, sweet sorghum has fermentable sugars and can be processed using the same sugar-alcohol industrial complexes. Sweet sorghum has a short life cycle, its cultivation is easy to mechanize using the same machinery used for sugarcane, and it can be cultivated in the sugarcane intercrop period, which decreases the seasonality of ethanol production. All these factors make sweet sorghum a promising crop for production of energy biomass (Souza, 2011).
Because it is highly adaptable to different soil and climatic conditions (mariguele and Silva, 2002), sweet sorghum is suitable for cultivation in regions or seasons of the year with irregular rainfall, which is the case of the interim sugarcane-harvest period in the Cerrado (Brazilian tropical savanna) region. Due to the length of the sowing season in the southwest
of Goiás, which provides greater flexibility in the
establishment of crops in succession to summer crops (Pale et al., 2003), sorghum is cultivated when the maize sowing season, which is the main second crop, is considered inadequate to obtain high yields (Coelho et al., 2002).
The development of technologies for sugar biomass production under conditions of water
deficit is necessary to support decision making in
terms of the sowing deadline that allows adequate exploitation of crop yield potential (magalhães et al., 2000). The use of sweet sorghum in the off-season
period can contribute to crop diversification within
traditional systems of grain production, avoiding
sown in January had higher industrial quality; however, there was stalk yield reduction when bulk density was greater than 1.26 Mg m-3, with a maximum yield of 50 Mg ha-1 in this
sowing time. Cultivation of sweet sorghum as a second crop is a promising alternative, but care should be taken in cultivation under conditions of pronounced climatic risks, due to low stalk yield.
Keywords: Sorghum bicolor (l.), sowing time, soil structure, water limitation, least limiting water range, agroenergy.
RESUMO: DeSempenho Do Sorgo SaCarino em Função Da CompaCtação Do
Solo e ÉpoCa De SemeaDura em SaFrinha no CerraDo BraSileiro
entre as matérias-primas renováveis destinadas à produção de etanol, distinção vem sendo dada ao sorgo sacarino, destacando-se o fato de ser uma cultura totalmente mecanizável. entretanto, o uso intensivo de máquinas agrícolas provoca degradação estrutural do solo, principalmente quando realizada em condições inadequadas de umidade. objetivou-se avaliar a qualidade física de um latossolo Vermelho Distroférrico sob compactação e componentes do rendimento de sorgo sacarino para épocas de semeadura em safrinha no Cerrado brasileiro. o experimento foi instalado no delineamento de blocos ao acaso, em esquema de parcelas subdivididas, com quatro repetições. nas parcelas, foram avaliados cinco níveis de compactação obtidos pelo tráfego de um trator agrícola nas seguintes intensidades de tráfego: 0 (ausência de compactação adicional), 1, 2, 7 e 15 passadas no mesmo lugar. as subparcelas foram constituídas por três épocas de semeadura do sorgo sacarino na safrinha de 2013 (20/01, 17/02 e 16/03). Foi avaliada a qualidade física do solo, por meio do intervalo hídrico ótimo (iho), a limitação hídrica, além das variáveis produtivas e tecnológicas da cultura. o monitoramento do conteúdo de água no solo indicou redução da frequência de conteúdos de água no solo dentro dos limites do iho (Fdentro) com o aumento da intensidade de tráfego agrícola (t0 = t1 = t2>t7>t15), tendo a produtividade associação direta com a disponibilidade hídrica do solo. por sua vez, a semeadura feita em janeiro apresentou maior qualidade
industrial, porém com redução da produtividade de colmos a partir da densidade do solo de 1,26 mg m-3,
com produtividade máxima de 50 mg ha-1 nessa época de cultivo. o cultivo do sorgo sacarino na safrinha
é uma alternativa promissora; no entanto, necessita de cautela quanto ao cultivo em condições de riscos climáticos acentuados por causa da baixa produtividade de colmos.
full conversion of food-production systems into agroenergy for biofuel production.
Intense traffic of agricultural machinery has
been increasing soil compaction within these production systems, resulting in an unfavorable environment for crop development (Secco et al., 2009; Kunz et al., 2013) and a decline in yield capacity (Reichert et al., 2009). For this reason, there has been increasing concern regarding agricultural areas with degradation problems. Comprehensive planning to find management strategies that minimize negative effects on soil structure is therefore necessary (Severiano et al., 2013).
Inadequate soil management changes soil physical characteristics, which interact with each other. Quality indicators that integrate more than one soil property in evaluation of soil structural
changes therefore better reflect the effects of soil
compaction on plant development. The least limiting water range (llwR) is a multifactorial soil quality indicator that establishes the soil water content at which no water limitations to plant growth occur due to water availability, aeration or root penetration resistance in the soil. The llwR integrates the effects of soil structure in a single measure (Silva et al., 2006; lima et al., 2009).
Although broadly used in soil compaction studies, the prediction of biological responses through relationships between llwR and growth of plants need to be validated (De Jong van lier and Gubiani, 2015). In this sense, no information is available this indicator use for sweet sorghum cultivation at different levels of soil compaction associated with conditions of water limitation to plant growth, as is the case for the off-season in the Brazilian Cerrado region.
In Brazil, sorghum is normally cultivated after a summer crop (Tardin et al., 2013) in the off-season period (January to April), taking advantage of the end of the rainy season. Thus, it is essential to evaluate the potential of sweet sorghum in compacted soil conditions. within this context, the aims of this study were to evaluate the physical quality of a latossolo Vermelho Distroférrico (Oxisol) under compaction and its components on sweet sorghum yield for second crop sowing in the Brazilian Cerrado.
Material and MethodS
The experiment was carried out in a field in the
municipality of Rio Verde, State of Goiás (GO), Brazil (17°48’34.25”S; 50°54’05.36”w; 731 m altitude), in an area covered by a latossolo Vermelho Distroférrico
(Santos et al., 2013), an Oxisol (Soil Survey Staff, 2014). Chemical and physical soil characterization is shown in table 1.
Climate in the region was classified as megathermal or tropical wet (Aw) according to
the Köppen climate classification and is a Tropical
Savanna subtype, with dry winters and rainy summers. Average temperature in the region is 25 ºC, and the average (yearly) rainfall is approximately 1,600 mm, with the highest rainfall occurring in January and the lowest in June, July, and August (<50 mm per month).
The soil in the experimental area was tilled by performing two crossed subsoiling operations at 0.40 m depth, one plowing, and two harrowings at 0.20 m depth to eliminate the history of soil tension.
table 1. Physical and chemical characterization of the Latossolo Vermelho Distroférrico cultivated with sweet sorghum
attribute Value
ph(CaCl2) 5.2
Om organic matter (g kg-1) 41.33
P (mg dm-3) 12.33
K (mg dm-3) 210.33
Ca2+ (cmol
c dm-3) 4.73
mg2+ (cmol
c dm-3) 2.21
Al3+ (cmol
c dm-3) 0.00
h+Al (cmolc dm-3) 4.37
Base saturation - V (%) 62.85 Aluminum saturation - m (%) 0.0
SiO2 (g kg-1) 39
Al2O3 (g kg-1) 201
Fe2O3 (g kg-1) 215
Ki 0.33
Kr 0.30
Particle density - Pd (mg m-3) 2.80 Very coarse sand (g kg-1) 1
Coarse sand (g kg-1) 15
medium sand (g kg-1) 154
Fine sand (g kg-1) 141
Very fine sand (g kg-1) 53
Silt (g kg-1) 195
Clay (g kg-1) 441
The experiment was conducted in a randomized block design, in a split plot arrangement, with four replications. The plots were 15.0 m long and 6.3 m wide. Five levels of compaction were attained from
the traffic of an agricultural tractor with a 4.5 Mg
load. The wheel set used consisted of two back and two front tires. All tires were diagonal with the
following specifications: front axle, 14.9-24, with
14.9’’ of section width and 24’’ of diameter, and
inflation pressure of 95 kPa; rear axle, 18.4-34, with inflation pressure of 165 kPa.
The following traffic intensities (passes of the
tractor over the same spot) were used to cause soil compaction: T0 - absence of compaction; T1- one pass;
T2 - two passes; T7 - seven passes; and T15 - fifteen passes. The tractor passes covered the whole soil surface of the different experimental plots.
The traffic treatments were applied according to
Beutler et al. (2007), when the soil water content was very close to field capacity (approximately 0.30 mg mg-1) due to rainfall that occurred during
January, before setting up the experiment.
Subplots were composed of 10 rows with 0.70 m between them and 5.0 m length, for a total of 31.5 m2, and consisted of three different sowing
times of sweet sorghum during the off-season of 2013. The three sowing times were separated by 25 day intervals and were performed on January 20, February 17, and march 16. The sorghum cultivar used was BRS 506.
Fertilizer applied at sowing was 20 kg ha-1 n,
50 kg ha-1 P
2O5, 40 kg ha-1 K2O, 1 kg ha-1 B, and
0.15 kg ha-1 mo in the form of ammonium sulfate,
simple superphosphate, potassium chloride, boric acid, and sodium molybdate, respectively. Based on analysis of soil fertility (Table 1), 100 kg ha-1 n
were applied to top dressing using urea, split into two applications performed 15 and 45 days after emergence (DAE).
A seeder was used to open the furrows and apply fertilizer. Sowing was performed at a 0.02 m depth, with 16 plants per linear meter. Plants were thinned 15 DAE, leaving the equivalent of 128,500 plants per hectare, according to may et al. (2012). During the whole crop cycle, all the crop handling
was performed manually to avoid machinery traffic
on the plots.
Undisturbed soil samples were collected from all the subplots using an Uhland sampler in aluminum rings of 0.064 m diameter and 0.05 m height, with the samples subdivided into depths of 0.00-0.05, 0.05-0.10, and 0.10-0.20 m, for a total of 360 samples. They were collected 100 DAE at the center of the inter-row along a diagonal line, with 5.0 m distance between sampling points and with the points at the extremity 1.5 m from the plot border. One disturbed soil sample at a depth of 0.00-0.20 m was also collected from each plot (20
in total) and used for soil physical characterization (Table 1) and determination of the permanent wilting point (matric potential -1.5 mPa) using a Richards chamber (Embrapa, 2011).
The samples with undisturbed soil structure were prepared in the laboratory by removing excess soil from the edges of the aluminum cylinders. These samples were saturated by water through gradual addition of distilled water in trays, and subjected to 0.006 mPa matric potential on glass plates in Büchner funnels. The volumetric water content obtained was considered to the soil microporosity
and field capacity (Severiano et al., 2011).
Soil water contents were adjusted by natural drying (Kondo and Dias Júnior, 1999), ranging from 0.03 to 0.36 m3 m-3, and soil penetration resistance
was measured by a penetrometer test. A bench penetrometer was used, equipped with an electronic speed variator and data-recording system with a constant velocity of 0.1667 mm s-1 and a rod (3 mm
base cone and semi-angle of 30º) equipped with a load of 50 kgf connected to a receiver coupled to a computer to record the readings via the proprietary software of the equipment (Severiano et al., 2008).
After penetrometer readings, soil samples were dried in an oven at 105 ºC for 48 h to determine bulk density (Bd) (Blake and hartge, 1986). Total porosity (TP) was determined using the equation TP = 1 - (Bd/Pd), where Pd is the particle density (2.80 mg m-3, according to table 1).
The penetration resistance curve (PRC) was
obtained by fitting penetration resistance (PR) to volumetric water content (θ) and Bd, using the
non-linear model proposed by Busscher (1990):
pr = 0.32θ-0.56Bd5.07, R2 = 0.77** Eq. 1 The llwR was determined according to Silva et al. (1994), considering the soil water content retained at the matric potential of -0.006 mPa,
considered to be the field capacity (θFC) or the soil
water content at which aeration porosity (θAP) is 10 %, as the upper limit (Ul) (Grable and Siemer,
1968). The θAP was calculated for each sample using
the equation θAFP = TP - 0.1.
The water content retained at -1.5 mPa,
considered the permanent wilting point (θPwP), and, or, the water content corresponding to 2.5 mPa
penetration resistance (θPR), determined using equation 1, were considered as lower limits (ll).
The LLWR was obtained by fitting the limits of
soil water content to Bd, with the upper limit being
the lowest value between the θFC and θAP and the
lower limit, the highest value between the θPwP and
θPR, considering the mean values of the soil layer between 0 and 0.20 m.
Following the sowing of sweet sorghum, soil water
content (θ) at 0.00-0.20 m depth was monitored daily
reached, for each sowing time, i.e., from days 20/01 to 20/05, 17/02 to 17/06, and 16/03 to 15/07 for the sowings performed in January, February, and march, respectively. Sampling was performed using a semi-automatic electrical soil sampler at 8:00 a.m. The samples were placed in plastic bags and taken to the laboratory for moisture determination through gravimetry (Embrapa, 2011).
monitoring of soil moisture was divided according to the plant phenology (vegetative phase [VP] and maturity phase [mP]) of sweet sorghum. The mean duration of VP was from 0 to 74 days after sowing, and that of mP was from 74 to 120 days after sowing. The llwR limits were considered as a reference for determination of the frequency of occurrence of the
θ within the range of acceptable soil physico-hydric
limits during the crop cycle (Fwithin) (Silva and Kay, 1997).
Stalk yield was evaluated at 120 DAE when the sweet sorghum was at maximum maturity (may 20, June 17, and July 15 for the sowings of January, February, and march, respectively). Cutting was performed in the two central rows using a backpack brushcutter at 0.05 m from ground level, separating leaves and panicles. The stalks were then weighed using a digital dynamometer, with 0.02 kg precision and 50 kg capacity.
Ten stalks per subplot were collected to determine some technological parameters of sweet sorghum. Considering the sugar-alcohol end use of sweet sorghum, the following parameters of industrial quality were determined: brix (B), juice pol (S), sorghum pol (PC), juice purity (Q), total recoverable sugars (TRS), sorghum fiber (F), and reducing sugars in the juice (RS). Juice was extracted using the hydraulic press method (Tanimoto, 1964) and analyzed according to Consecana (2006).
Temperature and rainfall were monitored over the durationof the experiment (Figure 1).
Soil physical properties and production and technological parameters of sweet sorghum data were subjected to analysis of variance, followed by the Tukey test at p<0.05. Regression models were
fitted between the yield of sweet sorghum and Bd.
reSultS and diSCuSSion
The θFC and θPwP were positively correlated with Bd (Figure 2), although the water limitation varied little because the limits remained almost equidistant. This pattern can be attributed to the higher quantity of particles available for water retention per unit of soil volume. This hypothesis is in accordance with magalhães et al. (2009) and Betioli Júnior et al. (2012).
Bulk density variation had a strong impact on
the θPR and θAP. with the increase in Bd, there was an increase in the water content needed to maintain penetration resistance at non-limiting values for
plant development (2.5 MPa θPR) and a decrease in the water content needed to maintain adequate
aeration porosity (10 % θAP) (Figure 2).
The llwR was similar to the available water
content (AWC = θFC - θPwP) up to 1.27 mg m-3 Bd. At higher Bd, the θPR became the limiting factor,
replacing the θPwP, which had lower values than
the θPR. This pattern resulted in llwR values lower than the available water content and negatively correlated with Bd. This result characterized the soil as physically limiting for plant growth due to compaction. Similar results were reported by lima et al. (2012) and Gonçalves et al. (2014), indicating that in tropical soils (namely, Oxisols) penetration resistence is the main variable associated with the decrease in the llwR (soil physical quality).
The LLWR upper limit θAP was higher than the
θFC for Bd up to 1.40 mg m-3 (Figure 2). This result
indicates that anoxia will occur only when the soil structure is extremely degraded (such as the effects of a high level of compaction) or for relatively short
figure 1. Monthly (a) and daily rainfall (b) and temperature during the sweet sorghum crop cycle.
Jan/13Feb/13Mar/13Apr/13May/13Jun/13Jul/13Aug/13 0
100 200 300 400 500 600
0 5 10 15 20 25 30 35
1/1 1/2 1/3 1/4 1/5 1/6 1/7 1/8
Rainfall (mm)
0 20 40 60 80 100 120 (a)
(b)
Temperature (
o C)
5 10 15 20 25 30 Jan Feb Mar
Rainfall
Temp minimum Temp mean
time periods when the soil water content is above
field capacity, due to the dynamic behavior of water
in the soil (Severiano et al., 2011).
The llwR became null at 1.36 mg m-3 Bd
(critical bulk density - Bdc) (Figure 2). Under these conditions, physical limitations of plant development are expected at any soil water content, due to structural conditions highly restrictive to root growth. A Bdc variation from 1.30 to 1.40 mg m-3
in soils with conditions similar to the present study was reported by Reichert et al. (2009).
The position of each traffic level within the llwR was observed for the mean soil depth studied (0.00-0.20 m) (Figure 3). For all the treatments except T15, mean Bd was lower than Bdc (T15 = Bdc).
For traffic intensities T0, T1, and T2 (Bd≤1.27 Mg m-3), the upper and lower limits were the θFC and θPwP, respectively, corresponding to the available water content (AwC), and therefore they did not show signs of soil structural degradation due to compaction. Additionally, the increase in Bd promoted a decrease in the llwR, which was more pronounced following
the replacement of the θPwP by θPR as the lower limit (Figure 3). The llwR decreased by almost 100 % in the treatment with the highest level of compaction (T15), whereas for T7 (Bd = 1.32 mg m-3), there was
a 52 % decrease.
monitoring of the soil water content according to the llwR critical limits and at different development phases of sorghum (vegetative
[VP] and maturity [mP] phases) is shown in
figure 4. The soil water content variation over time indicated that there was a decrease in the θ
within the limits of the llwR resulting from soil compaction for all the sowing times tested. This effect was more pronounced for later sowing times (January<February<march).
The upper limit (Ul) of the llwR had little
influence on determining limiting water effects,
regardless of the degree of compaction. Anoxia problems were sporadic, happening after high rainfall, so, in general, water content is lower than the Ul over the following evaluations. These results confirm the small limitation of oxygen diffusion in soil and root respiration (Blainski et al., 2009) (Figure 4).
The LLWR lower limits (θPwP for T0, T1, and T2;
θPR for T7 and T15) frequently resulted in higher
water limitations in all the treatments. As previously noted, the llwR became null at T15 (Ul = ll) and,
for this compaction level, the occurrence of θ<θPR
characterized all the soil moisture points outside the limits of the llwR for all the sowing times tested. Under these conditions, plants are subjected to severe soil physical restrictions, caused by high soil penetration resistance.
Occurrence of water limitations during the sweet
sorghum crop cycle can be quantified through the
percentage frequency of soil water content within the llwR limits (Fwithin) for the period under
evaluation (Table 2). For the same traffic intensity, the highest frequencies of the θ within the LLWR
limits for the sorghum vegetative phase were
Figure 2. Variation of soil water content (θ) with increasing bulk density (bd) at the critical limits of field capacity (θfC: -0.006 MPa),
permanent wilting point (θPwP: -1.5 MPa),
aeration porosity at 10 % (θaP), and soil
penetration resistance of 2.5 MPa (θPr) of a Latossolo Vermelho Distroférrico (oxisol), cultivated with sweet sorghum. the shaded area represents the LLWR; Bdc: critical bulk density for plant development.
Bulk density (Mg m-3)
1.15 1.20 1.25 1.30 1.35 1.40
Soil water content (m
3 m -3 )
0.00 0.10 0.20 0.30 0.40 0.50 0.60
LLWR
θAP θFC θ θ
PWP PR
Bdc
1.15 1.20 1.25 1.30 1.35 1.40
Least limiting water range (m
3 m -3 )
0.00 0.02 0.04 0.06 0.08 0.10 0.12 0.14 0.16 0.18
Bulk density (Mg (m-3) T
15 T
7 T
2 T
1 T
0
figure 3. the least limiting water range of a Latossolo Vermelho Distroférrico (oxisol), at different traffic levels of an agricultural tractor with 4.5 Mg load. the bulk densities shown by the vertical dashed lines are associated with t0 = 0,
t1 = 1, t2 = 2, t7 = 7, and t15 = 15 passes over the
observed for the January and February sowings. During the maturation phase, there was an increase in water limitation for plant development with the delay in sowing time, except for T15, for which water stress resulting from soil-structure degradation was observed for the whole crop cycle.
At later sowing times, soil water conditions became more limiting for sweet sorghum development, regardless of soil compaction, especially for the march sowing. Under the conditions of march sowing, starting at 45 days of crop establishment, there was a high occurrence of moisture points outside the llwR limits. This pattern was mostly due to the lower rainfall during the crop cycle (Figure 1) in this period, regardless of the level of soil compaction.
For soil bulk densities lower than 1.27 mg m-3,
the occurrence of limitations to plant development did not depend on soil compaction for T0, T1, and T2
levels (Figure 3, Table 2). Fwithin values between 85 and 90 % were observed for the vegetative phase of January and February sowings, and this factor was approximately 60 % for the march sowing.
For the January and February sowings, PR was the main physical factor limiting the llwR in treatments involving 7 and 15 tractor passes. For the march sowing, the water limitation was greater, regardless of the level of soil compaction and phenological phase, in accordance with Bengough et al. (2011) and Betioli Júnior et al. (2012). It was observed that the soil compaction brought about by T7 promoted water conditions
(Fwithin) for vegetative growth of sorghum sown in January and February similar to that sown in march when the soil was in ideal structural conditions
(Table 2). This behavior reflects the effect of soil
compaction on water limitation to crops.
The deleterious effects of water stress were promoted by soil structural degradation. It is also observed that due to the end of the rainy season, the value of Fwithin during the sorghum maturation phase also decreased for the later sowing times (January>February>march) (Table 2).
An interaction between sowing time and soil compaction was observed for stalk yield. Both increased soil compaction, resulting from tractor
traffic, and later sowing times decreased the stalk
yield of sweet sorghum (Figure 5). The January and February sowings resulted in higher stalk yield in the municipality of Rio Verde, GO.
The maximum yields observed for the first two
sowing times were higher than those reported for previous studies using BRS 506 sown in December (Emygdio et al., 2011; Albuquerque et al., 2012).
These results confirm the high yield potential of
sweet sorghum as a second cropin the Cerrado region, due to the photoperiod insensitivity of BRS 506 (Silva et al., 2005), and sweet sorghum potential
figure 4. time variation of soil water content over a sweet sorghum crop cycle relative to the llwr critical limits in a Latossolo Vermelho Distroférrico (Oxisol). UL: upper limit (θfC -0.006 MPa), and
LL: lower limit (θPwP -1.5 MPa or θPr 2.5 MPa) of
the llwr for the monitoring period.
0 30 60
Monitoring period (day)
90 120
0.09 0.18 0.27 0.36 0.45
0.09 0.18 0.27 0.36 0.45
VP MP
0.09 0.18 0.27 0.36 0.45
UL
UL = LL LL UL LL UL
LL
UL
0.09 0.18 0.27 0.36 0.45
0.09 0.18 0.27 0.36 0.45
VP MP
LL Sowing
January February March
Flowering
T0
T1
T2
T7
T15
Harvest
VP MP
VP MP
VP MP
Soil water content (m
for crop diversification in grain production systems
and its effective inclusion in renewable energy production systems.
highest stalk yields were observed at 1.26 and 1.22 mg m-3 Bd for the January and February
sowings, respectively (Figure 5). This result indicates that a slight compaction of oxidic latosols can increase sorghum yield, probably by improving
water redistribution in the soil profile compared to soils without machinery traffic (Severiano et al.,
2011). This slight compaction can increase contact between soil and roots and increase nutrient-uptake efficiency, compared to excessively loose soils (håkansson and Voorhees, 1998).
It was not possible to fit a regression model
to the stalk-yield data relative to soil Bd for the march sowing. Soil compaction did not affect plant development, because of the lower stalk yield in this sowing season, mainly associated with the climate, which imposed severe water restriction on sweet sorghum. A water limitation level between 55 and 65 % was determinant for stalk yield, due to a poor crop establishment time (march sowing) or to soil structural degradation (Bd>1.27 mg m-3),
responsible for decreases in the llwR and stalk yield (Table 2, Figures 4 and 5).
water stress causes a series of physiological changes, such as stomatal closure, which decreases CO2 entry in the mesophyll, thus compromising sweet sorghum development (Tardin et al., 2013). however,
although the water limitation in T7 for the January and
February sowings was similar to that of T0, T1, and T2
for the march sowing, a 63 and 59 % decrease in yield was observed for the earlier sowing times,respectively, compared to the march sowing (Figure 5).
Observation of figure 4 and the previous discussion suggested that this difference results from the fact water stress observed for the January and February sowings took place during the vegetative
Table 2. The LLWR and frequency of θ within the LLWR limits (Fwithin) during the sweet sorghum crop cycle under different traffic intensities in a Latossolo Vermelho Distroférrico (oxisol)
Traffic intensity llwr(1) fwithin
January(2) february(3) March(4)
m3 m-3 %
Vegetative phase
0 0.157 a 86.00 Aa 89.67 Aa 63.66 Ba
1 0.155 a 89.00 Aa 88.67 Aa 59.00 Ba
2 0.153 a 90.67 Aa 88.67 Aa 60.66 Ba
7 0.075 b 57.66 Ab 55.66 Ab 42.00 Bb
15 0.000 c 0.00 Ac 0.00 Ac 0.00 Ac
CV (%) 20.14 6.97
maturity phase
0 0.157 a 64.20 Aa 31.11 Ba 20.62 Ca
1 0.155 a 58.52 Aa 27.22 Ba 19.02 Ca
2 0.153 a 61.36 Aa 28.33 Ba 18.48 Ca
7 0.075 b 30.11 Ab 3.88 Bb 1.09 Cb
15 0.000 c 0.00 Ac 0.00 Bb 0.00 Cb
CV (%) 20.14 20.85
(1) least limiting water Range; (2) Sowings in January, (3) February, and (4) march. mean values followed by the same uppercase letter within the same line and lowercase letter within the same column are not significantly different according to the Tukey test
(p≤0.05); CV: coefficient of variation.
figure 5. Stalk yield of sweet sorghum at different levels of soil compaction and following different sowing times. ns: non-significant regression.
Stalk yield (Mg ha
-1 )
Bulk density (Mg m-3)
January: ŷ = -1169 + 1930Bd - 764Bd2; R2 = 0.73**
February: ŷ = -558 + 986Bd - 404Bd2; R2 = 0.88**
March: ns 52
42
32
22
12
phase, resulting in a decrease in yield due to soil compaction. In contrast, the concentration of rainfall on the days soon after the march sowing promoted
higher water deficit at the end of the vegetative
phase, regardless of the level of soil compaction, during which time there is greater accumulation of crop biomass.
Recently, De Jong van lier and Gubiani (2015) suggested rethinking its use in Brazil in soil physics research due, mainly, to the very few research that relates to crop production, although there are studies that show (Kaiser et al., 2009; magalhães et al, 2009) and others question (Gubiani et al., 2013) its effectiveness.
In this context, the data submitted above show through llwR that sowing in January resulted in conditions that were more favorable for plant growth and development because water restriction was pronounced only at the end of maturation (Table 2). The lower productivity and lower Bd in maximum point observed for the February, in comparison the sowing of January, sowing may therefore be associated with Fwithin, which decreased at the end of the crop cycle, resulting in lower accumulation of photoassimilates at the stems (Figure 5).
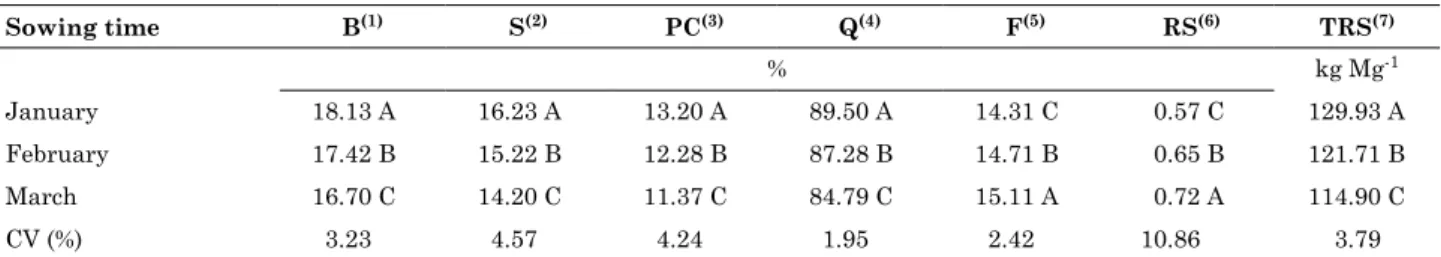
Although soil compaction had effects on stalk yield of BRS 506 sorghum, the technological parameters measured were only affected by sowing time (Table 3). The industrial quality of raw material decreased with decreasing Fwithin during crop maturation (Table 2).
Although no influence of soil compaction on the
industrial quality of sweet sorghum was observed, the percentage of dissolved solids and apparent sucrose in juice decreased with later sowing times (January>February>march) (Table 3). This change shows the sensitivity of these industrial quality
parameters to water deficit, in contrast to sugarcane, for which water stress is beneficial to maturation.
This pattern occurs because maturation of sweet
sorghum occurs at the same time as grain filling,
with allocation of photoassimilates from the stalks to the grain.
Brix values were satisfactory for the conditions studied and similar to the results of Emygdio et al. (2011), who reported 17 % for the same cultivar. Sweet sorghum harvest is recommended when the juice Brix is higher than 15.5 %. This factor is important for the quality of juice fermentation and consequently for the level of ethanol production per hectare (Prasad et al., 2007). The results therefore show that sweet sorghum cultivation in the off-season, i.e., following summer crops, is a promising option for the Brazilian Cerrado region.
Apparent sucrose (S) in the juice for all the sowing times was higher than the 8 % minimum proposed by Durães et al. (2012) (Table 3). The lowest value was found for the march sowing, which displayed decreased sucrose in the stalk and consequently in the juice. The juice purity (Q) for all the sowing times was higher than 80 % (Table 3), the minimum value according to Durães et al. (2012), and higher than the values reported by may et al. (2012) (55 %).
Fiber (F) level varied from 14 to 15 % (Table 3), which was in agreement with previous studies using the cultivar BRS 506 (Santos, 2007; Borges et al., 2010; Durães et al., 2012; may et al., 2012). The highest mean value was observed for the march sowing because it had the lowest PC, S, and Q. In
addition to the fiber, the concentration of reducing
sugars in the juice (RS) was highest for the march sowing. however, this concentration was lower than the levels proposed by several authors (Borges et al., 2010; Durães et al., 2012; may et al., 2012). It should be highlighted that the higher values for these two parameters observed for the march sowing resulted in a loss of industrial quality because high values of F decrease juice yield, and RS directly affects purity. Both of the parameters therefore result in lower
efficiency in industrial recovery of sucrose (Ripoli
and Ripoli, 2004).
The total recoverable sugars (TRS) concentrations for all the sowing times were 60 % higher than the values reported by may et al. (2012). The lowest mean values were observed for the march sowing, for which the observed concentration was 12 %
table 3. Production and technological parameters of sweet sorghum cultivated in a Latossolo Vermelho Distroférrico (oxisol)
Sowing time b(1) S(2) PC(3) Q(4) f(5) rS(6) trS(7)
% kg mg-1
January 18.13 A 16.23 A 13.20 A 89.50 A 14.31 C 0.57 C 129.93 A
February 17.42 B 15.22 B 12.28 B 87.28 B 14.71 B 0.65 B 121.71 B
march 16.70 C 14.20 C 11.37 C 84.79 C 15.11 A 0.72 A 114.90 C
CV (%) 3.23 4.57 4.24 1.95 2.42 10.86 3.79
(1) B: ºBrix or percentage of dissolved solids in juice; (2) S: juice pol or apparent sucrose; (3) PC: stalk pol; (4) Q: juice purity; (5) F: stalk
fiber; (6) RS: reducing sugars in the juice; (7) TRS: Total recoverable sugars. For each production and technological parameter, mean
lower than the one found for the first sowing time
(129.93 kg mg-1) (Table 3).
Evaluation of the industrial quality of sweet sorghum indicates that soil and climatic factors influenced crop maturation and that those plants sown in January and February exhibited characteristics desirable for use as energy biomass. Sweet sorghum cultivation following the summer crop harvest is therefore a viable option for production of grain and bioenergy in the same agricultural area. however, cultivation of sweet sorghum requires caution regarding sowing times
because the water deficit at the end of the vegetative
phase and during maturation observed for the later sowings resulted in decreased yield and industrial quality of stalks.
ConCluSionS
The llwR was sensitive to soil structural
changes resulting from agricultural tractor traffic, becoming null with higher traffic intensity (T15).
The frequency of the θ within the LLWR
limits indicated water-stress conditions for sweet
sorghum were intensified by soil compaction, and
sorghum yield was directly associated with soil water limitation.
Cultivation of sweet sorghum in the sugarcane between-harvest period is a promising alternative for bioenergy production when sowing is performed in January and February.
The limitations of march off-season cultivation are not due to the industrial quality of the raw material but to low stalk production, which is directly associated with the lack of a favorable soil water regime.
referenCeS
Albuquerque C, Tardin F, Parrella RDC, Guimarães ADS, Oliveira Rm, Silva KDJ. Sorgo sacarino em diferentes arranjos de plantas e localidades de minas Gerais, Brasil. R Bras milho Sorgo. 2012;11:69-85.
Bengough AG, mcckenzie Bm, hallett PD, Valent Ine TA. Root elongation, water stress, and mechanical impedance: A review of limiting stress and beneficial root tip traits. J Exp Bot. 2011;62:59-68.
Betioli Júnior E, moreira wh, Tormena CA, Ferreira CJ, Silva AP, Giarola nFB. Intervalo hídrico ótimo e grau de compactação de um latossolo Vermelho após 30 anos sob plantio direto. R Bras Ci Solo. 2012;36:971-82.
Beutler An, Centurion JF, Centurion mAPC, leonel Cl, João ACGS, Freddi OS. Intervalo hídrico ótimo no monitoramento
da compactação e da qualidade física de um latossolo Vermelho cultivado com soja. R Bras Ci Solo. 2007;31:1223-32.
Blainski E, Gonçalves ACA, Tormena CA, Folegatti mV, Guimarães Rml. Intervalo hídrico ótimo num nitossolo Vermelho distroférrico irrigado. R Bras Ci Solo. 2009;33:273-81. Blake GR, hartge Kh. Bulk density. In: Klute A, editor. methods of soil analysis: physical and mineralogical methods. 2nd ed. madison: American Society of Agronomy; 1986. p.363-75. Borges ID, mendes AA, Viana EJ, Gusmão CAG, Rodrigues hFF, Carlos lA. Caracterização do caldo extraído dos colmos da cultivar de sorgo sacarino BRS 506 (Sorghum bicolor l.). In: Anais do 28º Congresso nacional de milho e Sorgo;2010; Goiânia. Goiânia: Associação Brasileira de milho e Sorgo; 2010. p.1010-7.
Busscher WJ. Adjustment of flat-tipped penetrometer resistance
data to common water content. Am Soc Agric Eng.1990;33:519-24. Coelho Am, waquil Jm, Karam D, Casela CR, Ribas Pm. Seja o doutor do seu sorgo. Piracicaba: Potafos; 2002.
Companhia nacional de Abastecimento - Conab. [Accessed on: nov 23 2015]. Available at: http://www.conab.gov.br/ OlalaCmS/uploads/arquivos/15_11_10_09_11_06_boletim_graos_ novembro_2015.pdf.
Conselho dos Produtores de Cana-de-Açúcar, Açúcar, Álcool do Estado de São Paulo - Consecana. manual de instruções. 5ª.ed. Piracicaba: 2006.
De Jong van lier Q, Gubiani PI. Beyond the “least limiting water Range”: Rethinking soil physics research in Brazil. R Bras Ci Solo. 2015;39:925-39.
Durães FOm, may A, Parrella RAC. Sistema agroindustrial do sorgo sacarino no Brasil e a participação público-privada:
oportunidades, perspectivas e desafios. Sete Lagoas: Embrapa
milho e Sorgo; 2012. (Documentos, 138).
Empresa Brasileira de Pesquisa Agropecuária - Embrapa. Centro nacional de Pesquisas de Solos. manual de métodos de análises de solo. 2ª.ed. Rio de Janeiro: 2011.
Emygdio Bm, Afonso APS, Oliveira ACB, Parrella R, Schaffert RE, may A. Desempenho de cultivares de sorgo sacarino para a produção de etanol sob diferentes densidades de plantas. Pelotas: Embrapa Clima Temperado; 2011. (Boletim de Pesquisa e Desenvolvimento, 156).
Gonçalves wG, Severiano EC, Silva FG, Costa KAP, Guimarães Junnyor wS, melo GB. least limiting water range on the assessment of compaction in a Brazilian Cerrado latosol cultivated with sugarcane. R Bras Ci Solo. 2014;38:432-43. Grable AR, Siemer EG. Effects of bulk density, aggregate size, and soil water suction on oxygen diffusion, redox potential and elongation of corn roots. Soil Sci Soc Am J. 1968;32:180-6. Gubiani PI, Goulart RZ, Reichert Jm, Reinert DJ. Crescimento e produção de milho associados com o intervalo hídrico ótimo. R Bras Ci Solo. 2013;37:1502-11.
håkansson I, Voorhees wB. Soil compaction. In: lal R, Blum wh, Valentine C, Steward BA, editors. methods for assessment of soil degradation. Boca Raton: CRS Press; 1998. p.167-79. Kaiser DR, Reinert DJ, Reichert Jm, Collares Gl, Kunz m.
Intervalo hídrico ótimo no perfil explorado pelas raízes de feijoeiro
Kondo mK, Dias Júnior mS. Compressibilidade de três latossolos em função da umidade e uso. R Bras Ci Solo. 1999;23:211-8. Kunz m, Gonçalves ADmA, Reichert Jm, Guimarães Rml, Reinert DJ, Rodrigues mF. Compactação do solo na integração soja-pecuária de leite em latossolo argiloso com semeadura direta
e escarificação. R Bras Ci Solo. 2013;37:1699-708.
lima VmP, Oliveira GC, Severiano EC, Oliveira lFC. Intervalo hídrico ótimo e porosidade de solos cultivados em área de proteção ambiental do Sul de minas Gerais. R Bras Ci Solo. 2009;33:1087-95.
lima ClR, miola ECC, Timm lC, Pauletto EA, Silva AP. Soil compressibility and least limiting water range of a constructed soil under cover crops after coal mining in Southern Brazil. Soil Till Res. 2012;124:190-5.
magalhães PC, Durães FOm, Schaffert RE. Fisiologia da planta de sorgo. Sete lagoas: Embrapa; 2000. (Circular técnica, 3). magalhães En, Oliveira GC, Severiano EC, Costa KAP, Castro mB. Recuperação estrutural e produção do capim-Tifton 85 em um Argissolo Vermelho-Amarelo compactado. Ci Anim Bras. 2009;10:68-76.
mariguele Kh, Silva PSl. Avaliação dos rendimentos de grãos e forragem de cultivares de sorgo granífero. Caatinga. 2002;15:13-8. may A, Campanha m, Silva AFD, Coelho m, Parrella RADC, Schaffert RE, Pereira Filho IA. Variedades de sorgo sacarino em diferentes espaçamentos e população de plantas. R Bras milho Sorgo. 2012;11:278-90.
Pale S, mason SC, Galusha TD. Planting time for early-season pearl millet and grain sorghum in nebraska. Agron J. 2003;95:1047-53.
Prasad S, Singh A, Jain n, Joshi hC. Ethanol production from sweet sorghum syrup for utilization as automotive fuel in India. Energy Fuels. 2007;21:2415-20.
Reichert Jm, Suzuki lEAS, Reinert DJ, horn R, håkansson I. Reference bulk density and critical degree-of-compactness for no-till crop production in subtropical highly weathered soils. Soil Till Res. 2009;102:242-54.
Ripoli TCC, Ripoli mlC. Biomassa de cana-de-açúcar: colheita, energia e ambiente. Piracicaba: Barros & marques Ed. Eletrônica; 2004.
Santos FG. Culturas com potencial para produção de álcool no Rio Grande do Sul: sorgo sacarino. In: Simpósio Estadual de Agroenergia; 2007; Pelotas. Pelotas: 2007.
Santos hG, Jacomine PKT, Anjos lhC, Oliveira VA, lumbreras JF, Coelho mR, Almeida JA, Cunha TJF, Oliveira JB. Sistema
brasileiro de classificação de solos. 3ª.ed. rev. Brasília, DF:
Embrapa; 2013.
Secco D, Reinert DJ, Reichert Jm, Silva VR. Atributos físicos e rendimento de grãos de trigo, soja e milho em dois latossolos
compactados e escarificados. Ci Rural. 2009;39:58-64.
Severiano EC, Oliveira GC, Dias Júnior mS, Costa KAP, Silva FG, Ferreira Filho Sm. Structural changes in latosols of the cerrado region: I - Relationships between soil physical properties and least limiting water range. R Bras Ci Solo. 2011;35:773-82. Severiano EC, Oliveira GC, Dias Júnior mS, Oliveira lFC, Castro mB. Pressão de preconsolidação e intervalo hídrico ótimo como indicadores de alterações estruturais do solo em decorrência das operações de colheita da cana-de-açúcar. R Bras Ci Solo. 2008;32:1419-27.
Severiano EC, Oliveira GC, Dias Junior mS, Curi n, Costa KAP, Carducci CE. Preconsolidation pressure, soil water retention characteristics, and texture of latosols in the Brazilian Cerrado. Soil Res. 2013;51:193-202.
Silva AP, Kay BD, Tormena CA, Imhoff SC. least limiting water range of soils. In: lal R, organizer. Encyclopedia of soil science. new york: 2006. v.1.
Silva AG, Rocha VS, martinez y, huaman CA, Cecon PR, Portugal AF, Teixeira IR. Estádios de crescimento do sorgo forrageiro sob diferentes condições termofotoperiódicas. R Ceres. 2005;52:903-20.
Silva AP, Kay BD. Effect of soil water content variation on the least limiting water range. Soil Sci Soc Am J. 1997;61:884-8. Silva AP, Kay BD, Perfect E. Characterization of the least limiting water range. Soil Sci Soc Am J. 1994;58:1775-81. Soil Survey Staff. Keys to soil taxonomy. 12th.ed. washington, DC: United States Department of Agriculture, natural Resources Conservation Service; 2014.
Souza VF. Adaptabilidade e estabilidade de cultivares de sorgo sacarino [dissertação]. Janaúba: Universidade Estadual de montes Claros; 2011.
Stambouli AB, Khiat Z, Flazi S, Kitamura y. A review on the renewable energy development in Algeria: Current perspective, energy scenario and sustainability issues. Renew Sust Energ Rev. 2012;16:4445-60.
Tanimoto T. The press method of cane analysis. hawaiian Planter´s Rec. 1964;57:133-50.