www.jped.com.br
ORIGINAL
ARTICLE
Fat
mass
index
performs
best
in
monitoring
management
of
obesity
in
prepubertal
children
夽
,
夽夽
Luís
Pereira-da-Silva
a,∗,
Mónica
Pitta-Grós
Dias
a,
Elisabete
Dionísio
a,
Daniel
Virella
b,
Marta
Alves
b,
Catarina
Diamantino
c,
Anabela
Alonso
c,
Gonc
¸alo
Cordeiro-Ferreira
a,caNutritionLab,HospitaldeDonaEstefânia,CentroHospitalardeLisboaCentral,Lisbon,Portugal bResearchUnit,CentroHospitalardeLisboaCentral,Lisbon,Portugal
cOutpatientClinicforPrepubertalObeseChildren,HospitaldeDonaEstefânia,CentroHospitalardeLisboaCentral,
Lisbon,Portugal
Received22July2015;accepted9November2015 Availableonline15February2016
KEYWORDS
Bodymassindex; Fatmassindex; Monitoring; Percentageoffat mass;
Prepubertalchildren; Obesity
Abstract
Objective: Anearlyandaccuraterecognitionofsuccessintreatingobesitymayincreasethe complianceofobesechildrenandtheirfamiliestointerventionprograms.Thisobservational, prospectivestudyaimedtoevaluatetheabilityandthetimetodetectasignificantreduction ofadiposityestimatedbybodymassindex(BMI),percentageoffatmass(%FM),andfatmass index(FMI)duringweightmanagementinprepubertalobesechildren.
Methods: Inacohortof60prepubertalobesechildrenaged3---9yearsincludedinan outpa-tientweightmanagementprogram,BMI,%FM,andFMIweremonitoredmonthly;thelasttwo measurementswereassessedusingairdisplacementplethysmography.Theoutcomemeasures werethereductionof>5%ofeachindicatorandthetimetoachieveit.
Results: Therateofdetectionoftheoutcomewas33.3%(95%CI:25.9---41.6)usingBMI, sig-nificantlylower(p<0.001)thaneither63.3%using%FM(95%CI:50.6---74.8)or70.0%(95%CI: 57.5---80.1)usingFMI.Themediantimetodetecttheoutcomewas71daysusingFMI,shorter than88daysusing%FM,andsimilarto70daysusingBMI.Theagreementbetweentheoutcome detectedbyFMIandby%FMwashigh(kappa0.701),butverylowbetweenthesuccessdetected byBMIandeitherFMI(kappa0.231)or%FM(kappa0.125).
Conclusions: FMIachievedthebestcombinationofabilityandswiftnesstoidentifyreduction ofadiposityduringmonitoringofweightmanagementinprepubertalobesechildren.
©2016SociedadeBrasileiradePediatria.PublishedbyElsevierEditoraLtda.Thisisanopen accessarticleundertheCCBY-NC-NDlicense(http://creativecommons.org/licenses/by-nc-nd/ 4.0/).
夽 Pleasecitethisarticleas:Pereira-da-SilvaL,Pitta-GrósDiasM,DionísioE,VirellaD,AlvesM,DiamantinoC,etal.Fatmassindex performsbestinmonitoringmanagementofobesityinprepubertalchildren.JPediatr(RioJ).2016;92:421---6.
夽夽StudylinkedtotheNutritionLab,HospitaldeDonaEstefânia,CentroHospitalardeLisboaCentral,Lisbon,Portugal.
∗Correspondingauthor.
E-mail:[email protected](L.Pereira-da-Silva).
http://dx.doi.org/10.1016/j.jped.2015.11.003
PALAVRAS-CHAVE
Índicedemassa corporal; Índicedemassa gorda;
Monitoramento; Percentualdemassa gorda;
Crianc¸aspré-púberes; Obesidade
Índicedemassagordaapresentamelhordesempenhonomonitoramentodo tratamentodaobesidadeemcrianc¸aspré-púberes
Resumo
Objetivo: Oreconhecimentoprecoceeprecisodosucessonotratamentodaobesidadepode aumentaraadesãodecrianc¸asobesasesuasfamíliasaprogramasdeintervenc¸ão.Esteestudo observacionalprospectivovisaavaliaracapacidadeeotempodedetecc¸ãodeumareduc¸ão significativanaadiposidadeestimadapeloíndicedemassa corporal(IMC),nopercentualde massagorda(%MG)enoíndicedemassagorda(IMG)duranteocontroledepesoemcrianc¸as obesaspré-púberes.
Métodos: Emumacoortede60crianc¸asobesaspré-púberescomidadesentre3e9anos, incluí-dasemumprogramaambulatorialdecontroledepeso,oIMC,o%MGeoIMGforammonitorados mensalmente,easduasúltimasmedic¸õesavaliadasforamfeitasutilizandopletismografiapor deslocamentodear.Asmedic¸õesresultantesforamreduc¸ãode>5%decadaindicadoreatingir otempoparatanto.
Resultados: Ataxadedetecc¸ãodoresultadofoide33,3%(ICde95%25,9-41,6)utilizandoIMC, significativamentemenor(p<0,001)que63,3%utilizando%MG(ICde95%50,6-74,8)ou70,0% (ICde95%57,5-80,1)utilizandoIMG.Otempomédioparadetectaroresultadofoide71dias utilizandooIMG,menosque88diasutilizando%MGesemelhantea70diasutilizandooIMC. AconcordânciaentreoresultadodetectadopeloIMGepelo%MGfoielevada(kappa0,701), porémmuitobaixaentreosucessodetectadopeloIMCepeloIMG(kappa0,231)ou%MG(kappa 0,125).
Conclusões: OIMGatingiuamelhorcombinac¸ãodecapacidadeeprecocidadeparaidentificar reduc¸ãona adiposidadeduranteo monitoramentodo controlede peso em crianc¸as obesas pré-púberes.
©2016SociedadeBrasileiradePediatria.PublicadoporElsevierEditoraLtda.Este ´eumartigo OpenAccesssobumalicenc¸aCCBY-NC-ND(http://creativecommons.org/licenses/by-nc-nd/4. 0/).
Introduction
Whiledefinitionofobesityisbasedonexcessiveadiposity,1 thebestmeasurement fordegree ofbodyfatnessremains controversial.2 The heterogeneity of outcome measures usedtoassesstheeffectivenessofinterventionsinchildhood obesityhasmadeitdifficulttocompareresults.3
In large-scalepopulation surveysand clinical or public healthscreening,bodymassindex(BMI)iscommonly used asasurrogate measurefor body fat content1,4;it is typi-cally adjusted for age andsex, andexpressed ascentiles orZ-scores.5WhileBMIisagoodindexofcardio-metabolic risk,itmaybe notagoodindexofadiposity.6In arecent meta-analysis,BMIwasfoundtohavehighspecificitybutlow sensitivityfordetectionofexcessadiposityinchildren.7BMI maybeparticularlybiasedasa proxyforlongitudinal adi-posityassessmentinchildrensincestrongcorrelationsexist betweenBMIandcomponentsofweightotherthanbodyfat mass(FM),suchasleanmassandbonemass.6,8Inaddition, itisnotcertainthatachildtrackingalongagivenBMI cen-tilewillalsomaintainthispositioninthedistributionofbody fat.9Consequently,BMImaynotberecommendedtomonitor adipositychangesinchildren.9---11
The percentage of fat mass (%FM), defined as fat mass/body weight×100, has been commonly used as a
morereliableindexofbody-size-adjustedadiposity.1Beinga proportion,withFMincludedbothinnumeratorand denom-inator(ascomponentofbodymass),%FMmaybedifficultto interpreteitherasameasureofadiposity2orasan indica-torofitschanges.9Adjusting FMtoan unrelatedmeasure of bodysize, such asa linear measure (i.e., height),has
been suggested asa strategy toimproveinterpretation.12 The FM index(FMI), defined asFM (kg) divided by height squared(m2),hasbeenproposedtobetterdiscriminate adi-posity than %FM,2 and referencevalues for children have beenpublished.8,13
Air displacement plethysmography (ADP) is a reliable two-compartmentmodeltoevaluatechangesinadiposityin childrenbymeasuringFMand%FM.14 Ithasbeenvalidated inchildrenaged7---10years.15
Performanceof BMI,%FM,andFMIin detecting adipos-ity changes has been assessed and compared in growing children,9---11,16 butdataarescarce ontheperformance of these indicators in obese children participating in weight managementprograms.17 Itispostulatedthatearlier posi-tivereinforcementwillcontributetothesuccessofweight managementprograms.
ThisstudyevaluatedtheperformanceofBMI,%FM,and FMIinmonitoringadipositychangesduringweight manage-mentinterventioninprepubertalobesechildren,inorderto identifywhichindicatorhasthehighestearlydetectionrate ofadiposityreduction.TheauthorshypothesizethatFMIis abetterearlyindicatorofadiposityreductionthan%FMand BMI.
Methods
centileforageandsex.18,19Pubertywasexcludedbasedon Tanner stages.20 The median age at recruitment was 7.6 years (3---9 years), with nostatistical differencebetween sexes. The study wasapprovedby the institutional ethics committee.
Acustomizedweightmanagementprogramwasapplied to all patients, in compliance with the outpatient clinic protocol,includingoralandwrittenprescriptionsfor:(1)a planneddietordailyeatingplanwithbalanced macronutri-ents,inproportionsconsistentwithDietaryReferenceIntake recommendations for age, especially foods low in energy density,suchasthosewithhighfiberorwatercontent21,22 and(2)exercisingmorethanonehourperdayatleastthree timesperweek.23 Prescriptionsandscheduledassessments wereprovidedbythesamepediatrician(CD)andthesame dietician(AA).
These children were assessed in the Nutrition Lab for anthropometry and body composition measurement at admission,andscheduledformonthlyfollow-up.Individuals not complying with this scheduled were not included in the analysis. No additional assessment was undertaken for the purposes of this study. Body mass, measured by the Bod Pod device (Life Measurements --- Concorde, CA, USA), was considered as body weight. Height was measured using the Seca 240 Wall-Mounted Stadiometer (3M, A&DMedical, S, USA) by the same trained observer (ED) according tothe recommendedtechnique,24 and the averageofthreemeasurementswasrecordedforanalysis. The World Health Organization’s AnthroPlus software (http://who-anthroplus.software.informer.com/)wasused forcalculationofBMIandBMIZ-scores.
Body composition wasmeasured by the same observer (MPGD)usingtheADPmethod(BodPod;LifeMeasurements ---Concorde,CA,UnitedStates).Accordingtothe manufac-turer’sinstructions,measurementswereobtainedwiththe subjectswearingtight-fittingswimsuit andswim caponly. This method measures body mass, FM, and fat-free mass (FFM) expressed in kg, withprecision of 0.1kg. The %FM wascalculatedbytheequipment,assumingthedensityof fattobe0.9007kg/L,andpre-determinedage-and gender-specificdensitiesofFFM.14TheFMIwascomputedasFM(kg) dividedbyheightsquared(m2).
Theprimaryoutcomewasthedetectionrateof5% reduc-tionin adiposityby eachindicator (BMI,%FM,andFMI), a conveniencethreshold.Time(days)toachievedetectionof 5%reductioninadipositywasasecondaryoutcome. Preci-sion ofthe detection rateis given by the 95%confidence interval(CI),calculatedusingOpenEpi(CentersforDisease ControlandPrevention---Atlanta,GA,USA),andproportions
werecomparedusingchi-squaredorFisher’sexacttest,as indicated. Time toachieve detection for the whole sam-pleandforeachindicatorwasdescribedwithKaplan---Meyer survivalcurves.Timetoachievedetectionof5%reduction inadiposity, in cases in which it occurred, wasdescribed withmedianandextremesfor eachindicatorof adiposity, andcomparedusingtheKruskal---Wallistest.Cohen’skappa statistic(k)wasusedtomeasurethe agreementbetween casesdetectedbyeach adiposityindicator.Statisticswere calculated using SPSS 22.0 (IBM Corp. --- Armonk, NY, USA).
Results
Themedian(extremes)timeoffollow-upofrecruited chil-drenwas105(35---561)days.
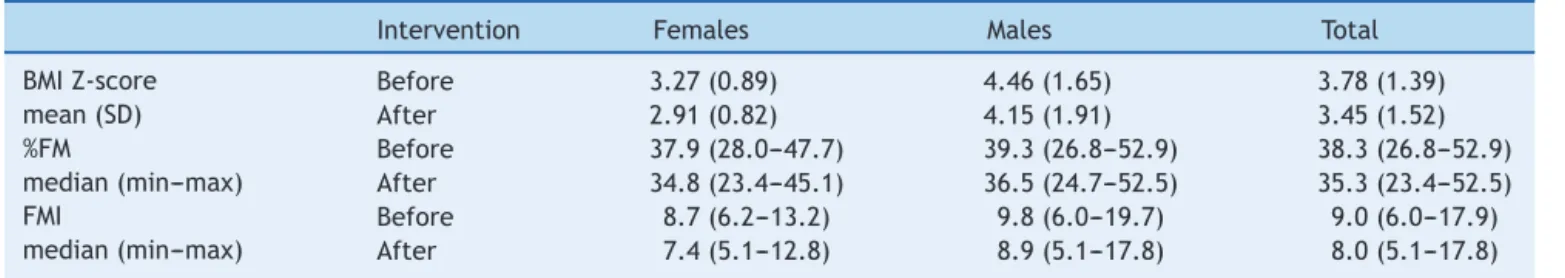
Bodycompositionassessed beforetheinterventionand attheendofthefollow-upispresentedinTable1.
Detectionratesfor5%reductioninadipositywere33.3% (95% CI: 25.9---41.6) using BMI, 63.3% (95% CI: 50.6---74.8) using%FM,and70.0%(95%CI:57.5---80.1)usingFMI. Detec-tionratewassignificantlylowerusingBMI (p<0.001),but didnotdifferbetweenuseof%FMorFMI(p=0.657).
The detectionrate usinganyof theindicators wasnot significantlydifferentbetweensexes.
Time to achieve detection using each indicator for the whole sample, expressed with Kaplan---Meyer survival curves,is presented inFig.1.The detectionof 5% reduc-tionin adiposity in 50%of the cohort wasachievedat 98 days(95%CI:70.0---126.0) usingFMI, andat127days(95% CI: 102.9---151.1) using %FM; less than 50% of the cohort achievedthe threshold for detectionof reduction in adi-posityusingBMI(Fig.1).
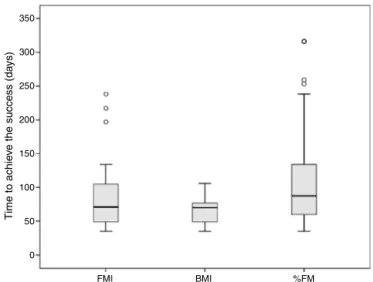
Themediantimetodetect5%reductioninadipositywas 71(35---238)daysusingFMI,similarto70(35---316)daysusing BMI(p=0.223),andwithweakevidence(p=0.067)ofbeing shorterthan88(35---316)daysusing%FM(Fig.2).Themedian timetodetect5%reductioninadiposityusingBMIwas sig-nificantlyshorter thanusing%FM(p=0.009).Inthecohort ofmales,nosignificantdifferencesinthetimetodetect5% reductioninadiposity werefound betweentheindicators. Inthecohortoffemales, thetimetodetect 5%reduction in adiposity was significantly shorter using BMI than %FM (p=0.018). At recruitment, themedian age of females in whom5%reductioninadipositywasdetectedusingBMIwas 7.8yearsvs.6.0yearsforthoseinwhomsuccess wasnot detected(Mann---Whitneytest, p=0.083);nodifferencein agewasfoundinmales.
Table1 Bodycompositionassessmentsbeforeandaftertheweightmanagementintervention.
Intervention Females Males Total
BMIZ-score mean(SD)
Before 3.27(0.89) 4.46(1.65) 3.78(1.39)
After 2.91(0.82) 4.15(1.91) 3.45(1.52)
%FM
median(min---max)
Before 37.9(28.0---47.7) 39.3(26.8---52.9) 38.3(26.8---52.9) After 34.8(23.4---45.1) 36.5(24.7---52.5) 35.3(23.4---52.5) FMI
median(min---max)
Before 8.7(6.2---13.2) 9.8(6.0---19.7) 9.0(6.0---17.9) After 7.4(5.1---12.8) 8.9(5.1---17.8) 8.0(5.1---17.8)
At least 5% redution of BMI
At least 5% redution of %FM
At least 5% redution of % FMI Time (days)
Time (days)
Time (days)
1.0
0.8
0.6
0.4
0.2
0.0
1.0
0.8
0.6
0.4
0.2
0.0
1.0
0.8
0.6
0.4
0.2
0.0
0 100 200 300 400 500 600
0 100 200 300 400 500 600
0 100 200 300 400 500 600
Cum
ulativ
e success r
ate
Cum
ulativ
e
success r
ate
Cum
ulativ
e success r
ate
A
B
C
Figure1 Timetoachievethesuccess(reduction≥5%ineach
indicator)forthewholesampleandforeachindicator(A:BMI, B:%FM,C:FMI);Kaplan---Meyersurvivalcurves.
BMI,bodymassindex;%FM,percentoffatmass;FMI,fatmass index.
350
300
250
200
Time to achie
ve the success (da
ys)
150
100
50
0
FMI BMI %FM
Figure2 Themedian(extremes)timetoachievethesuccess (reduction≥5%ineachindicator)was 71(35---238)daysusing
FMI,70 (35---316) daysusing BMI, and88 (35---316)days using %FM.ThemediantimetodetectsuccessusingBMIwas signifi-cantlyshorterthanusing%FM(Kruskal---Wallistest;p=0.009). FMI,fatmassindex;BMI,bodymassindex;%FM,percentoffat mass.
Theagreementbetweenthedetectionof5%reductionin adipositybyFMI andby%FMwashigh(k=0.701),butvery lowbetweenthesuccessdetectedbyeitherFMIor%FMand BMI(k=0.231andk=0.125,respectively).
Discussion
In this observational, prospective cohort of prepubertal obesechildrenincludedinaweightmanagementprogram, thedetectionrateofearlydecreaseinadiposityusingthe BMIestimationwaslow(33.3%).However,bothFMIand%FM werefoundtohavegreaterabilitytodetectearlyadiposity changes(70%and63.3%,respectively).
TimetodetectreductioninadipositywasshorterforFMI andBMIthanfor%FM.Thebestcombinationofabilityand swiftnesstodetectasignificant reductionin theadiposity estimatewasachievedbyFMI.The%FMhadagoodability todetectadiposity change,but ittooklongerthanFMIor BMI.AlthoughBMIdetectedadipositychangeearlier,ithad alowerdetectionratethantheotherindicators.
Thisstudyaimedtocomparetheperformanceofthree indicatorsofadipositydetectingdifferencesovertime,and nottoassesstheeffectivenessofthemanagementof obe-sity. Additionally, the accuracy of the studied adiposity indicatorsinobesechildrenhasalreadybeenverifiedusing diversegold-standardmethods7,9 andisbeyondtheaimof thisstudy.
indicators(BMI,%FM,andFMI)wasconsideredaconvenient cut-offforshort-termindicatorsofsuccess.
In childhood, the BMI has different performances depending onwhether the purposeis todetect excessof adiposity,changeofadiposityinthegeneralpopulation,or changeofadiposityinobesechildrenparticipatinginweight management programs.In asystematic review and meta-analysis,BMIwasfoundtohavelowsensitivityandfailedto identifyoverone-quarterofchildren withexcess%FM.7 In somecohortstudies,BMIwasreportedtohavelow perfor-mancefordetectingchangesofadiposityinchildhood.9---11,16 Nonetheless,BMIchartswerefoundtoprovideareasonably accurateindicationofbodyfatchangesmeasuredby dual-energy X-ray absorptiometry in obese children aged8---15 yearsparticipatinginaweightmanagementprogram.17
Parallel variations of FMand body weight may reduce theperformanceof%FMtodetectchangesinadiposity9and impactitsabilitytomonitorresponsetoobesitytreatment. FMI,associatinganaccurateestimateofFMwithmeasured height,overcomesthisinterference,potentiallyimproving itsperformancetodetect short-termchangesinadiposity in prepubertal children aged 3---9 years, in whom height velocityisrelativelyconstantandlowerthaninotherage groups.20 Limitations of %FMand advantages of FMI have alreadybeenaddressedinboththediagnosisofobesity2,8,13 andtheidentificationofadipositychangesinchildren.9
Interventions for treating obesity in children have included dietary intervention and promotion of physical activity.25Lowlevelsofpatientandfamilycompliancehave influenced the success of some of these interventions.26 Earlypositive reinforcementmayincrease thecompliance ofobesechildrenandtheirfamilies.UsingeitherFMIorBMI to monitor treatment detects adiposity reduction around twoweeksearlier than using%FM;however,BMI failedto detectreductionofadiposityinmorethanhalfthechildren detectedbyFMI.AlthoughFMIand%FMdetectreductionof adiposity at similarrate, the increasedtime of detection using%FMdelaystheopportunityforpositivereinforcement byapproximatelytwoweeksand,thus,mayinterferewith interventioncomplianceandeffectiveness.26
Limitationsofthisstudyshouldbeacknowledged.Firstly, recruitmentwasbasedontheclinicaldiagnosis ofobesity andnotonaccurateindicatorsofexcessiveadiposity,such as indices based on FM measured by dual-energy X-ray absorptiometry.7 The ADP method has been validated in childrenaged7---10years,15butnotyetinyoungerchildren, makingit unreliablefor ascertainment oftherecruitment ofobesechildren.Instead,BMI18 wasusedforrecruitment, as it is the most widely used clinical criterion to screen obesity in outpatient children.7 Conceptually, this might have introduced a selection bias for including children withlessadiposity,butthehighBMIZ-scoresfoundin the assessment before the intervention (Table 1) makes this bias unlikely. Secondly, the difference between genders found in thetimetaken todetect success maybedue to the different size of the two small subsamples, as only prepubertalchildrenwereincludedandthedetectionrates for the outcome measures were similar. Nevertheless, a potentialinterferenceoftheadiposityreboundinfemales cannot be excluded, considering the weak evidence that femalesinwhomsuccesswasdetectedusingBMIareolder thanthosewhodidnotachievesuccess.
Toconclude,the bestcombination ofability and swift-nesstodetect a 5% reductionin adiposity for monitoring weight management in prepubertal obese children was achievedusingFMI. The present data suggest that outpa-tientclinicsspecialized intreatment of childhoodobesity equipped with methods able to accurately detect early changesinFMareabletoprovideearlierpositive reinforce-ment.
Conflicts
of
interest
Theauthorsdeclarenoconflictsofinterest.
Acknowledgment
The authors are grateful to Kayla M. Bridges, MS, RD, CSP,CNSC,St.JohnProvidenceChildren’sHospital,Detroit, Michigan, United States, for the critical review of the manuscript.
References
1.Lahti-KoskiM,GillT.Defining childhoodobesity. In:Kiess W, MarcusC,WabitschM,editors.Obesityinchildhoodand ado-lescence,vol.9.Basel,Karger:PediatrAdolescMed;2004.p. 1---19.
2.ColeTJ,FewtrellMS,PrenticeA.Thefallacyofusingpercentage bodyfatasameasureofadiposity.AmJClinNutr.2008;87:1959. 3.CollinsCE,WarrenJ,NeveM,McCoyP,StokesBJ.Measuring effectivenessofdieteticinterventionsinchildobesity:a sys-tematicreviewofrandomizedtrials.ArchPediatrAdolescMed. 2006;160:906---22.
4.Gray DS, Fujioka K. Use of relative weight and body mass index for the determination of adiposity. J Clin Epidemiol. 1991;44:545---50.
5.ColeTJ,LobsteinT.Extendedinternational(IOTF)bodymass indexcut-offsforthinness,overweightandobesity.Pediatric Obes.2012;7:284---94.
6.WellsJC.Commentary:theparadoxofbodymassindexin obe-sityassessment:notagoodindexofadiposity,butnotabad indexofcardio-metabolicrisk.IntJEpidemiol.2014;43:672---4. 7.JavedA,JumeanM,MuradMH,OkoroduduD,KumarS,Somers VK,etal.Diagnosticperformanceofbodymassindextoidentify obesity as definedbybodyadiposity inchildren and adoles-cents: asystematic reviewand meta-analysis. Pediatr Obes. 2015;10:234---44.
8.WeberDR,MooreRH,LeonardMB,ZemelBS.FatandleanBMI referencecurvesinchildrenandadolescentsandtheirutilityin identifyingexcessadipositycomparedwithBMIandpercentage bodyfat.AmJClinNutr.2013;98:49---56.
9.KakinamiL,HendersonM,ChioleroA,ColeTJ,ParadisG. Identi-fyingthebestbodymassindexmetrictoassessadipositychange inchildren.ArchDisChild.2014;99:1020---4.
10.ColeTJ,FaithMS,PietrobelliA,HeoM.Whatisthebestmeasure ofadipositychangeingrowingchildren:BMI,BMI%,BMIz-score orBMIcentile?EurJClinNutr.2005;59:419---25.
11.DemerathEW,SchubertCM,MaynardLM,SunSS,ChumleaWC, PickoffA,etal.Dochangesinbodymassindexpercentilereflect changesinbodycompositioninchildren?Datafrom theFels LongitudinalStudy.Pediatrics.2006;117:e487---95.
13.KellyTL,WilsonKE,HeymsfieldSB.DualenergyX-ray absorp-tiometrybodycompositionreferencevaluesfromNHANES.PLoS ONE.2009;4:e7038.
14.ElbergJ,McDuffieJR,SebringNG,SalaitaC,KeilM,Robotham D,etal.Comparisonofmethodstoassesschangeinchildren’s bodycomposition.AmJClinNutr.2004;80:64---9.
15.Ittenbach RF, Buison AM, Stallings VA, Zemel BS. Sta-tistical validation of air-displacement plethysmography for body composition assessment in children. Ann Hum Biol. 2006;33:187---201.
16.InokuchiM,MatsuoN,TakayamaJI,HasegawaT.BMIz-scoreis theoptimalmeasureofannualadipositychangeinelementary schoolchildren.AnnHumBiol.2011;38:747---51.
17.RudolfMC,KromAJ,ColeTJ.HowgoodareBMIchartsfor mon-itoringchildren’sattemptsatobesityreduction?ArchDisChild. 2012;97:418---22.
18.WhoMulticentreGrowthReferenceStudyGroup.Enrolmentand baselinecharacteristicsintheWHOMulticentreGrowth Refer-enceStudy.ActaPaediatrSuppl.2006;450:7---15.
19.deOnisM,OnyangoAW,BorghiE,SiyamA,NishidaC,Siekmann J.DevelopmentofaWHOgrowthreferenceforschool-aged chil-drenandadolescents.BullWorldHealthOrgan.2007;85:660---7.
20.TannerJM,WhitehouseRH.Clinicallongitudinalstandardsfor height,weight,heightvelocity,weightvelocity,andstagesof puberty.ArchDisChild.1976;51:170---9.
21.KrebsNF,JacobsonMS.Preventionofpediatricoverweightand obesity.Pediatrics.2003;112:424---30.
22.USDepartmentofHealthandHumanServices,USDepartment ofAgriculture.DietaryguidelinesforAmericans.6thed. Wash-ington,DC:GovernmentPrintingOffice;2005.
23.Strong WB, Malina RM, BlimkieCJ, Daniels SR, Dishman RK, GutinB,etal.Evidencebasedphysicalactivityforschool-age youth.JPediatr.2005;146:732---7.
24.The National Health and Nutrition Examination Survey (NHANES). Anthropometry procedures manual. CDC; 2011. http://www.cdc.gov/nchs/data/nhanes/nhanes1112/ AnthropometryProceduresManual.pdf
25.OudeLuttikhuisH,BaurL,JansenH,ShrewsburyVA,O’Malley C,StolkRP,etal.Interventionsfortreatingobesityinchildren. CochraneDatabaseSystRev.2009;(1).CD001872.