Rev Saúde Pública 2011;45(2)
Aparecida de Cássia Rabetti Sérgio Fernando Torres de Freitas
Núcleo de Extensão e Pesquisa em Avaliação em Saúde. Departamento de Saúde Pública. Universidade Federal de Santa Catarina. Florianópolis, SC, Brasil
Correspondence: Aparecida de Cássia Rabetti
Núcleo de Extensão e Pesquisa em Avaliação em Saúde – Nepas
Campus Universitário Trindade 88040-970
Florianópolis, SC, Brasil
E-mail: [email protected] Received: 3/24/2010
Approved: 8/28/2010
Article available from: www.scielo.br/rsp
Evaluation of actions
concerning systemic arterial
hypertension in primary
healthcare
ABSTRACT
OBJECTIVE: To evaluate the effi ciency of the Family Health Strategy in actions related to hypertension.
METHODS: Evaluative, cross-sectional quantitative research based on secondary data of 66 small municipalities located in the state of Santa Catarina, Southern Brazil, with maximum potential coverage of 100% by the Family Health Strategy in 2007. Input indicators, products and results were evaluated. The municipalities’ effi ciency of services production and results production was compared through data envelopment analysis.
RESULTS: The municipalities were more effi cient in services production (37.8%) than in results production (16.6%). Forty-one municipalities (62.2%) were ineffi cient in the services: enrolment in the Hypertension and Diabetes Information System, individual assistance and home visit for hypertensive users, and 55 (83.3%) were ineffi cient in the production of impact against hypertension.
CONCLUSIONS: The evaluation model used in this study proved to be capable of measuring effi ciency in primary healthcare by evaluating the productivity of services and results.
DESCRIPTORS: Hypertension, prevention & control. Family Health Program. Health Services Evaluation. Primary Health Care. Cross-Sectional Studies.
INTRODUCTION
Public expenditure on health is increasing and is related to factors such as population aging, new health technologies, improvement in income levels, consolidation of the wellbeing state and universalization of sanitary coverage.a
In these circumstances, the use of economic methodological instruments in the fi eld of health is justifi ed by the criterion of scarcity and by the diffi culty in resources allocation.16
Data envelopment analysis (DEA), created in the 1980s, measures productive effi ciency in the social area. It was developed to evaluate public programs in such a way that the organizations’ fi nancial aspect is not the only one that is considered. This tool is applied to studies on the productivity and technical
effi ciency of productive units that employ multiple inputs to generate multiple products, and it enables to identify the best practices by means of empirical frontiers of linear programming.6
Since its implementation, Sistema Único de Saúde (SUS – National Health System) has dealt with lack of resources, given the adverse scenario from the economic point of view at the time it was created. Programa Saúde da Família (PSF – Family Health Program) emerged in light of the initial criticism of being a care program that had restrictive characteristics. However, its rapid expansion in the last years and its importance have trans-formed it in a conversion strategy of the primary health-care model. The control and diagnosis of hypertension have been an attribution of the Family Health Program, have a character of priority action in the adult’s health in its initial phase and have become a strategic action after the Pacto em Defesa da Vida (Pact for Life Defense), of 2005.1 Systemic Arterial Hypertension (SAH) is a
highly prevalent chronic non-communicable disease whose diagnosis and control are fundamental in the handling of serious diseases like congestive heart failure, cerebrovascular diseases, acute myocardial infarction, hypertensive nephropathy, peripheral vascular disease and hypertensive retinopathy.
Evaluation of the effi ciency of SAH-related services, with the identifi cation of strong points of action of reference municipalities, could represent an impor-tant management and planning tool. It would enable the improvement in the provided care by identifying municipalities and actions with effi cient impact, thus subsidizing information on how to produce services and results with more effi ciency. The present study aimed to evaluate the effi ciency of EstratégiaSaúde da Família (ESF – Family Health Strategy) in the actions related to hypertension.
METHODS
In the study, 66 small municipalities located in the state of Santa Catarina, Southern Brazil, were selected, whose model of Atenção Primária à Saúde (APS – Primary Healthcare) was ESF for the entire population.
Information on the above-mentioned municipalities referring to 2007 was collected in the databases of Sistema de Informação da Atenção Básica (SIAB – Primary Healthcare Information System), Sistema de Informação de Internação Hospitalar (Hospital Admission Information System), Cadastro Nacional de Estabelecimentos de Saúde (National Record of Healthcare Establishments), the population basis
b Rabetti AC. A efi ciência das ações relacionadas à Hipertensão Arterial Sistêmica: uma avaliação na atenção básica em saúde nos municípios catarinenses [Master’s dissertation]. Florianópolis: Universidade federal de Santa Catarina; 2009.
c Calvo MCM. Análise da efi ciência produtiva de hospitais públicos e privados no Sistema Único de Saúde (SUS). In: Piola SF, Jorge EA. Prêmio em economia da saúde: 1º prêmio nacional, 2004: coletânea premiada. Brasília (DF): Instituto de Pesquisa Econômica Aplicada; 2005.
of Instituto Brasileiro de Geografia e Estatística (Brazilian Institute of Geography and Statistics), Sistema de Informação Orçamentária Pública em Saúde (Health Public Budget Information System), and Sistema de Informação sobre Hipertensão e Diabete (SISHIPERDIA – Hypertension and Diabetes Information System).
An evaluative model was constructed as recommended by Rabetti (2009).b The data were organized into
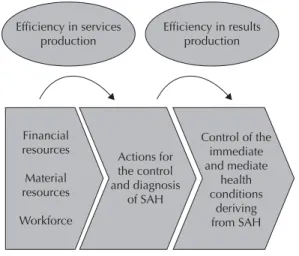
SAH-related inputs and products in primary healthcare. Financial resources, material resources and workforce were considered inputs for services production, and actions for SAH control and diagnosis, as products. The generated services were transformed into inputs, and their product was the control of the immediate and mediate health conditions deriving from SAH (Figure 1).
The inputs were: fi nancial resource (the total amount employed by the municipality to defray the cost of primary healthcare); material resource (weekly hours of occupation of offi ces destined to primary healthcare), and workforce (average weekly working hours of the Family Health teams per month).
Enrolment (number of enrolled individuals with SAH); individual assistance (number of SAH assistances performed by the ESF), and home visit (number of visits of community health agents to users with SAH) were the considered services.
The SAH-related services performed by ESF were clas-sifi ed as inputs in the stage of results production. The number of observed services was corrected to number of services projected for effi ciency by the DEA tool, in order to maintain the relationship with the initial inputs.
A result indicator or rate was created that represented protection to cardiovascular (CV) outcomes. This rate was called rate of SAH-related hospitalizations poten-tially avoided by primary healthcare, calculated by the formula: rate = [(population between 20 and 65 years – number of hospitalizations due to SAH, Congestive Heart Failure and Cerebrovascular Diseases in indi-viduals between 20 and 65 years): population between 20 and 65 years] * 10,000.
3
Rev Saúde Pública 2011;45(2)
In the DEA methods, the units of analysis are evaluated according to the utilization of inputs for the production of a certain amount of products. Weights are attributed to each input and to each product aiming at a more effi cient relationship.
DEA was chosen due to the possibility of complex analyses for multiple inputs and multiple products; because it does not require predetermined existence of a mathematical model that relates inputs and products (the only maintained hypothesis is that the weighted sum of inputs and products of any municipality results in a “virtual municipality” of viable technology); because it compares units directly with their pair or with a combination of pairs; and because inputs and products can be expressed in different units (for example: number of employed teams and invested values in reais).8
DEA’s main limitations are the measurement errors and the presence of outliers, which interfere in the formation of the frontier. Due to this, checking for the presence of infl uent observations and outliers is recommended.8
Restrictions were established to control for the munici-palities’ heterogeneity and to ensure they would be structurally comparable: same size (≤ 10 thousand inhabitants) and same ESF coverage (100% of maximum potential coverage). To control for outliers, 37 municipalities (35.9%) were excluded due to lack of data or to measurement errors that could not be corrected. DEA was applied to the two productive stages by means of the program IDEAS®.c The variable
scale model was used, in light of the hypothesis that variation in the municipality’s size might interfere in the production scale of services and results. DEA was oriented to products, with the arrangement of invested inputs, which searched for the best productivity and increased the number of products.
The maximum productivities that were observed formed an empirical frontier of effi ciency among Santa Catarina’s small municipalities. Maximum productivity assumed a score equal to 1 and was classifi ed as effi -cient; scores above 1 were categorized as ineffi cient.
By means of DEA, effi cient productivity goals were calculated to the ineffi cient units and ineffi ciency for each product was evaluated.
RESULTS
Of the 66 municipalities, 25 (37.8%) were effi cient in the production of services related to SAH and 41 were ineffi cient (62.2%).
The scores of the ineffi cient municipalities ranged from 1.06 to 2.09 (productivities 0.6 to 1.9 lower than the maximum productivity that was observed). The effi cient municipalities with similar input arrangements were able to produce more services and became reference to the others.
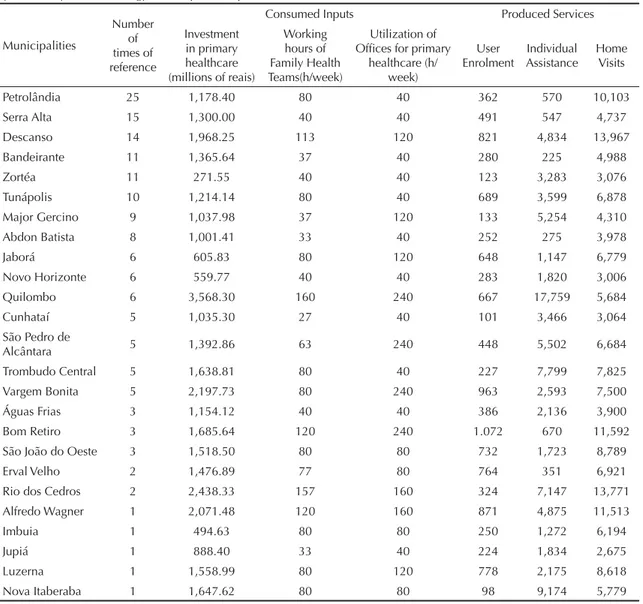
Municipalities that were considered ineffi cient had more than one municipality as reference. Table 1 shows the benchmarks in services and the characteristics of their practices. The total of references was higher than the total of observations, because there were munici-palities with more than one reference.
Five municipalities were reference only to themselves, i.e., the others did not obtain projections for their prac-tices from their arrangements.
Of the municipalities, 41 were ineffi cient concerning the production of the three types of services: user enrol-ment, individual assistance and home visit (Table 2).
The greatest inefficiency was in user enrolment, measured by the record of users with SAH in SISHIPERDIA, with an average of 47.3% in the state. The number of enrolled users was incompatible with the other activities observed in some municipalities (Table 2). The municipality of Irani, the most ineffi -cient one, had three enrolled users when it should have 312; however, it offered 7,623 individual consultations regarding this activity, and a little more than 10 thou-sand home visits, which suggests a specifi c defi ciency in user enrolment.
The municipalities needed to expand production by 43.16% on average for individual assistance. The municipality of Paial had the highest ineffi ciency in individual assistance, having offered 48 consultations for users with SAH in one year. In order to become effi cient, its productive goal was of 896 consultations/ year, which would mean a 94.7% increase in this product. Ineffi ciency was lower in the other services (approximately 40%) for this municipality.
Financial resources
Material resources
Workforce Efficiency in services
production Efficiency in resultsproduction
Actions for the control and diagnosis
of SAH
Control of the immediate and mediate
health conditions
deriving from SAH
The lowest degree of ineffi ciency was observed for home visits. Santiago do Sul was the most ineffi cient munici-pality in home visits, with 998 visits and a goal to achieve effi ciency of 3,414. The ineffi ciency of this municipality was equally distributed among the three services.
Considering results production, 11 municipalities (16.7%) were effi cient concerning SAH care in primary healthcare; the other 55 (83.3%) were ineffi cient.
The effi ciency frontier in results production was consti-tuted of fewer municipalities than the services frontier. The scores of the ineffi cient municipalities were close to 1, which suggests that their maximum productivity was almost reached. The variation of the ineffi cient scores was of 1.000014 to 1.006635.
Of the 11 effi cient municipalities in results production, nine (81.9%) became reference for other ineffi cient
ones. Two (18.1%), despite being effi cient, had no municipalities that could be projected for their prac-tices (Table 3). The municipality of Jaborá was the one that most served as reference (36 municipalities can achieve its results without modifying their inputs). This benchmark presented two hospitalizations for the selected causes. Thus, 9,991 every 10 thousand people of the susceptible population were protected from CV outcomes, which indicates that the services developed by the ESF protected this part of the population. This rate applied to the susceptible population showed that there was the maximum protection that the service could obtain.
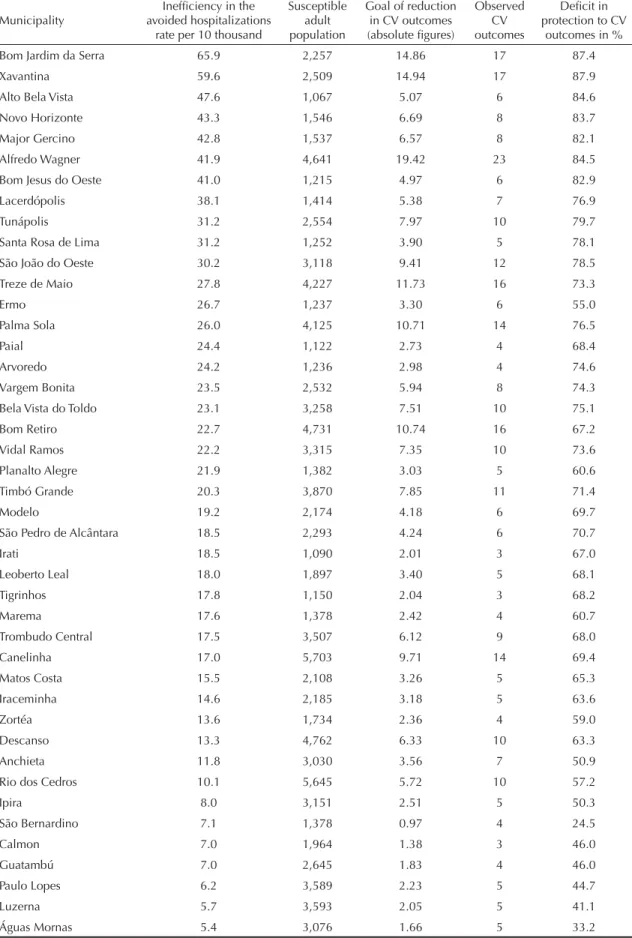
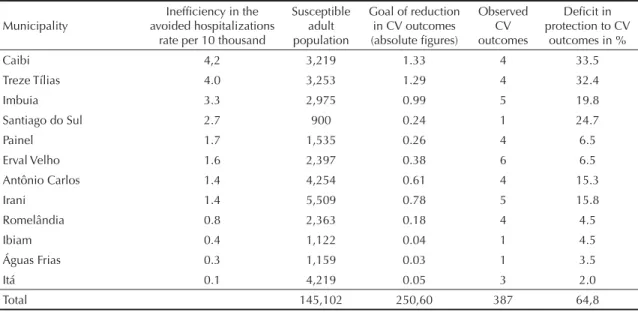
In the ineffi cient municipalities, on average, 18:10,000 adults were not protected from CV outcomes and were hospitalized due to avoidable causes that were sensitive to SAH-related primary healthcare (Table 4).
Table 1. Benchmark reference municipalities in the production of assistance services to systemic arterial hypertension performed by the Family Health Strategy, their inputs and products. Santa Catarina, Southern Brazil, 2007.
Municipalities
Number of times of reference
Consumed Inputs Produced Services
Investment in primary healthcare (millions of reais)
Working hours of Family Health Teams(h/week)
Utilization of Offi ces for primary
healthcare (h/ week)
User Enrolment
Individual Assistance
Home Visits
Petrolândia 25 1,178.40 80 40 362 570 10,103
Serra Alta 15 1,300.00 40 40 491 547 4,737
Descanso 14 1,968.25 113 120 821 4,834 13,967
Bandeirante 11 1,365.64 37 40 280 225 4,988
Zortéa 11 271.55 40 40 123 3,283 3,076
Tunápolis 10 1,214.14 80 40 689 3,599 6,878
Major Gercino 9 1,037.98 37 120 133 5,254 4,310
Abdon Batista 8 1,001.41 33 40 252 275 3,978
Jaborá 6 605.83 80 120 648 1,147 6,779
Novo Horizonte 6 559.77 40 40 283 1,820 3,006
Quilombo 6 3,568.30 160 240 667 17,759 5,684
Cunhataí 5 1,035.30 27 40 101 3,466 3,064
São Pedro de
Alcântara 5 1,392.86 63 240 448 5,502 6,684
Trombudo Central 5 1,638.81 80 40 227 7,799 7,825
Vargem Bonita 5 2,197.73 80 240 963 2,593 7,500
Águas Frias 3 1,154.12 40 40 386 2,136 3,900
Bom Retiro 3 1,685.64 120 240 1.072 670 11,592
São João do Oeste 3 1,518.50 80 80 732 1,723 8,789
Erval Velho 2 1,476.89 77 80 764 351 6,921
Rio dos Cedros 2 2,438.33 157 160 324 7,147 13,771
Alfredo Wagner 1 2,071.48 120 160 871 4,875 11,513
Imbuia 1 494.63 80 80 250 1,272 6,194
Jupiá 1 888.40 33 40 224 1,834 2,675
Luzerna 1 1,558.99 80 120 778 2,175 8,618
5
Rev Saúde Pública 2011;45(2)
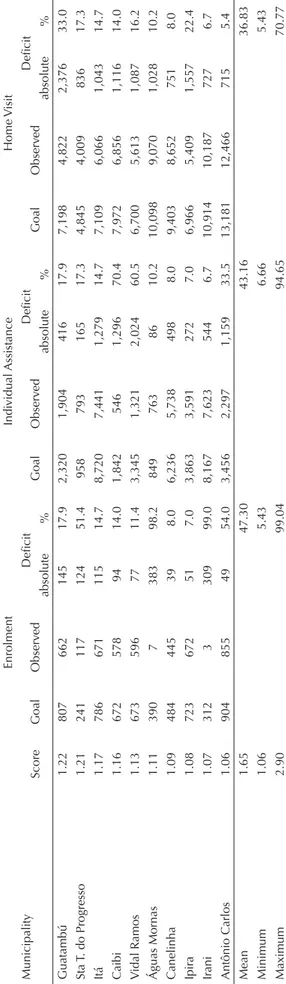
Table 2. Effi ciency score, observed services, defi cit and effi cient production goals of services in systemic arterial hypertension for each ineffi cient municipality. Santa Catarina, Southern Brazil, 2007.
Municipality
Enrolment Individual Assistance Home Visit
Score Goal Observed Defi cit Goal Observed Defi cit Goal Observed Defi cit
absolute % absolute % absolute %
Calmon 2.90 598 206 392 65.5 2,050 682 1,368 66.7 9,022 3,109 5,913 65.5
Santiago do Sul 2.90 328 113 215 65.5 1,982 683 1,299 65.5 3,414 998 2,416 70.8
Palma Sola 2.49 668 92 576 86.2 3,408 1,274 2,134 62.6 12,675 5,092 7,583 59.8
Irati 2.29 151 25 126 83.4 4,109 1,794 2,315 56.3 4,565 1,993 2,572 56.3
Ibiam 2.12 212 100 112 52.9 2,307 1,086 1,221 52.9 4,838 2,277 2,561 52.9
Matos Costa 2.12 349 165 184 52.8 2,690 479 2,211 82.2 5,968 2,818 3,150 52.8
Santa Rosa de Lima 2.12 190 90 100 52.7 2,431 161 2,270 93.4 3,589 1,696 1,893 52.7
Timbó Grande 2.10 592 29 563 95.1 2,702 1,168 1,534 56.8 12,035 5,725 6,310 52.4
Modelo 1.95 484 248 236 48.8 1,603 291 1,312 81.8 8,554 4,379 4,175 48.8
Leoberto Leal 1.91 503 264 239 47.6 1,404 736 668 47.6 8,587 4,503 4,084 47.6
Paulo Lopes 1.86 821 357 464 56.5 4,834 1,481 3,353 69.4 13,967 7,519 6,448 46.2
Arvoredo 1.81 243 134 109 44.8 3,544 1,955 1,589 44.8 4,804 2,650 2,154 44.8
Paial 1.80 403 224 179 44.3 896 48 848 94.6 4,521 2,516 2,005 44.3
Treze Tílias 1.80 491 233 258 52.6 1,876 1,045 831 44.3 10,080 5,615 4,465 44.3
Bom Jesus do Oeste 1.78 243 136 107 43.9 1,858 1,042 816 43.9 4,719 2,646 2,073 43.9
Planalto Alegre 1.77 299 169 130 43.6 994 561 433 43.6 5,069 2,861 2,208 43.6
Marema 1.75 468 268 200 42.8 686 366 320 46.6 4,548 2,398 2,150 47.3
Lacerdópolis 1.70 470 277 193 41.0 678 334 344 50.7 4,559 2,132 2,427 53.2
Ermo 1.69 272 76 196 72.1 549 326 223 40.7 5,168 3,067 2,101 40.7
Xavantina 1.65 535 46 489 91.4 2,501 1,520 981 39.2 10,052 6,110 3,942 39.2
São Bernardino 1.64 250 135 115 46.0 684 136 548 80.1 4,633 2,826 1,807 39.0
Romelândia 1.57 343 215 128 37.3 490 286 204 41.7 8,923 5,678 3,245 36.4
Bom Jardim da Serra 1.50 536 357 179 33.4 1,017 677 340 33.4 7,420 4,940 2,480 33.4
Anchieta 1.47 377 122 255 67.7 726 494 232 32.0 10,100 6,873 3,227 32.0
Iraceminha 1.47 674 459 215 31.9 1,518 773 745 49.1 8,715 5,938 2,777 31.9
Painel 1.47 268 28 240 89.6 401 273 128 31.9 4,977 3,389 1,588 31.9
Alto Bela Vista 1.44 186 129 57 30.7 4,909 3,402 1,507 30.7 4,433 2,594 1,839 41.5
Bela Vista do Toldo 1.39 525 378 147 28.1 5,477 3,940 1,537 28.1 8,335 5,996 2,339 28.1
Tigrinhos 1.29 233 180 53 22.7 3,192 2,466 726 22.7 3,621 2,460 1,161 32.1
Treze de Maio 1.28 1.061 831 230 21.7 846 290 556 65.7 11,692 9,154 2,538 21.7
Belmonte 1.24 211 171 40 19.1 3,833 3,102 731 19.1 4,093 2,982 1,111 27.1
In Bom Jardim da Serra, the municipality that had the highest ineffi ciency in results production, the number of avoided hospitalizations might be increased by approxi-mately 66 adults every 10,000. Considering its adult population, 15 people might have been protected and would not have been hospitalized due to SAH, conges-tive heart failure or cerebrovascular diseases. The value observed in this city was of 17 hospitalizations, when it could have reduced the number of hospitalizations to two to be effi cient.
Of the 11 effi cient municipalities in results production, nine (81.9%) were effi cient also in the production of SAH care services with impact (p = 0.001) (Table 5).
DISCUSSION
The evaluation model developed in the present study proved to be capable of measuring effi ciency in primary healthcare by evaluating the productivity of services and results.
The employed methodology can be a useful tool for municipal managers concerning the reorientation of primary healthcare in the search for effi ciency. It enables to identify types of underused resources, the increase in services that might occur with the utilized resources and the potential of avoidable hospitalizations as a consequence of SAH.
The selection of SAH-related hospitalizations due to causes that are sensitive to primary healthcare and their transformation into potentially avoidable hospi-talizations in the susceptible population resulted in the creation of the rate of potentially avoided hospitaliza-tions, a marker of the impact of primary healthcare. Its employment proved to be useful to evaluate the effi ciency of results.
The present study evaluates a level of care that has an extensive action spectrum, but it focuses on the set of services related to SAH control, which can be consid-ered a limitation. Camargo Jr et al4 state that evaluation
can be restricted to certain conditions or pathologies considered “representative” of the responsibilities of the assistance system. Therefore, many studies on health systems, programs or services use these “tracers” as a way of evaluating the whole of a program.
Assistance to SAH is not exclusive of primary health-care, but the best opportunities of action happen in this level of care. The hypertensive disease can be considered a “tracer” of Family Health, as it is a health condition that is prioritized in the adult health care and, although it is a specifi c disease, it is also characterized by the need of longitudinal care, which is characteristic of primary healthcare.17
When the productivity of this action was evaluated, no exclusive inputs for this health condition were found. Table 2 continuation Municipality
Enrolment Indi vidual Assistance Home V isit Score Goal Observ ed Defi cit Goal Observ ed Defi cit Goal Observ ed Defi cit absolute % absolute % absolute % Guatambú 1.22 807 662 145 17.9 2,320 1,904 416 17.9 7,198 4,822 2,376 33.0 Sta
T. do Progresso
7
Rev Saúde Pública 2011;45(2)
The municipality is considered ineffi cient concerning a specifi c action and not the action of the ESF as a whole, as the inputs are shared for all actions executed in this level of care.
Another restriction of the study regards the utiliza-tion of secondary data. The utilizautiliza-tion of data from the Sistemas de Informações em Saúde (SIS – Health Information Systems) should be made with caution and critical analysis, as the risk of under-recording and the low quality of the data are well known.
Authors of baseline studies on primary healthcare disagree on the theme. Camargo Jr et al4 analyzed three
information systems and concluded that SIAB has adequate coverage and reliability and that these data should be used in order to value the information systems and to stimulate their use as monitoring and evaluation instruments. Fachini,9 on the other hand, argues that the
information provided by the SIS is fragmented, is not updated and its quality is low. According to Cordeiro et al,7 data from SIAB are not valued by the team’s nurse,
a fact that may infl uence the quality of their collection, since these professionals are the supervisors of the Community Health Agents.7 Although Brazil has not
achieved total excellence in the quality of offi cial data, the qualifi cation of these data has advanced and their utilization contributes to this advance.
It was not possible to evaluate the effi ciency of 37 municipalities due to undernotifi cation or to measure-ment errors registered in the secondary databases. The qualifi cation of the records, mainly concerning the enrolment of patients in SISHIPERDIA, may improve the evaluations of SAH care in primary healthcare.
The publications on health effi ciency measurement concentrate on analyses of national health systems and
hospital services. There are few studies on primary healthcare.
A review study carried out in 2000 on effi ciency frontier studies in primary healthcare identifi ed that such studies emerged after the decade of 1990 and concentrated on a few countries: England, Spain and the United States. There were few studies on primary healthcare when compared to effi ciency studies in the health sector. Twenty-fi ve publications on the theme were found, of which 21 used DEA as the effi ciency measurement method. Among 12 Spanish studies, the majority used secondary data in the investigation.14
Puig-Junoy14 (2000) criticizes the effi ciency studies
in primary healthcare that use only services indicators and do not evaluate their quality, which is shown by the results indicators. According to the author, only two works employed this type of indicator in Spain.14
In the present study, a result indicator was used, as the rate of prevention of hospitalizations due to causes that are sensitive to primary healthcare indicates the obten-tion of results, the quality of the assistance provided in individualized consultations and home visits, and the user’s connection with the healthcare team.
In Brazil, there are few publications on effi ciency in primary healthcare. In a study with inputs, products and results indicators in municipalities located in the state of Ceará, Northeastern Brazil, higher effi ciency was observed in services than in results. In this study, all the executed primary healthcare activities were considered as services indicators and only child mortality and child hospitalization due to diarrhea were considered as results indicators.d This might cause the decrease in the
number of effi cient municipalities in results production. This same result was perceived in the present study, Table 3. Reference Municipalities for production of primary healthcare results related to systemic arterial hypertension and their inputs and products. Santa Catarina, Southern Brazil, 2007.
Municipality referenceTimes of
Consumed Inputs Product
Rate of avoided hospitalizations (per 10 thousand) User
enrolment Individual Assistance Home visit
Jaborá 37 648 1,147 6,779 9,991.61
Jupiá 32 224 1,834 2,675 9,991.57
Quilombo 32 667 17,759 5,684 9,994.72
Belmonte 12 211 3,833 4,093 9,991.68
Petrolândia 11 362 570 10,103 9,988.04
Serra Alta 10 491 547 4,737 9,988.21
Abdon Batista 8 252 275 3,978 9,972.09
Cunhataí 7 101 3,466 3,064 9,990.30
Santa Terezinha do Progresso 5 241 958 4,845 9,981.38
Bandeirante 1 280 225 4,988 9,961.09
Table 4. Ineffi ciency in the avoided hospitalizations rate, goal of reduction in cardiovascular outcomes, observed outcomes and defi cit in protection to outcomes related to the control of systemic arterial hypertension in primary healthcare. Santa Catarina, Southern Brazil, 2007.
Municipality
Ineffi ciency in the avoided hospitalizations
rate per 10 thousand
Susceptible adult population
Goal of reduction in CV outcomes (absolute fi gures)
Observed CV outcomes
Defi cit in protection to CV
outcomes in %
Bom Jardim da Serra 65.9 2,257 14.86 17 87.4
Xavantina 59.6 2,509 14.94 17 87.9
Alto Bela Vista 47.6 1,067 5.07 6 84.6
Novo Horizonte 43.3 1,546 6.69 8 83.7
Major Gercino 42.8 1,537 6.57 8 82.1
Alfredo Wagner 41.9 4,641 19.42 23 84.5
Bom Jesus do Oeste 41.0 1,215 4.97 6 82.9
Lacerdópolis 38.1 1,414 5.38 7 76.9
Tunápolis 31.2 2,554 7.97 10 79.7
Santa Rosa de Lima 31.2 1,252 3.90 5 78.1
São João do Oeste 30.2 3,118 9.41 12 78.5
Treze de Maio 27.8 4,227 11.73 16 73.3
Ermo 26.7 1,237 3.30 6 55.0
Palma Sola 26.0 4,125 10.71 14 76.5
Paial 24.4 1,122 2.73 4 68.4
Arvoredo 24.2 1,236 2.98 4 74.6
Vargem Bonita 23.5 2,532 5.94 8 74.3
Bela Vista do Toldo 23.1 3,258 7.51 10 75.1
Bom Retiro 22.7 4,731 10.74 16 67.2
Vidal Ramos 22.2 3,315 7.35 10 73.6
Planalto Alegre 21.9 1,382 3.03 5 60.6
Timbó Grande 20.3 3,870 7.85 11 71.4
Modelo 19.2 2,174 4.18 6 69.7
São Pedro de Alcântara 18.5 2,293 4.24 6 70.7
Irati 18.5 1,090 2.01 3 67.0
Leoberto Leal 18.0 1,897 3.40 5 68.1
Tigrinhos 17.8 1,150 2.04 3 68.2
Marema 17.6 1,378 2.42 4 60.7
Trombudo Central 17.5 3,507 6.12 9 68.0
Canelinha 17.0 5,703 9.71 14 69.4
Matos Costa 15.5 2,108 3.26 5 65.3
Iraceminha 14.6 2,185 3.18 5 63.6
Zortéa 13.6 1,734 2.36 4 59.0
Descanso 13.3 4,762 6.33 10 63.3
Anchieta 11.8 3,030 3.56 7 50.9
Rio dos Cedros 10.1 5,645 5.72 10 57.2
Ipira 8.0 3,151 2.51 5 50.3
São Bernardino 7.1 1,378 0.97 4 24.5
Calmon 7.0 1,964 1.38 3 46.0
Guatambú 7.0 2,645 1.83 4 46.0
Paulo Lopes 6.2 3,589 2.23 5 44.7
Luzerna 5.7 3,593 2.05 5 41.1
Águas Mornas 5.4 3,076 1.66 5 33.2
9
Rev Saúde Pública 2011;45(2)
Table 4 continuation
Municipality
Ineffi ciency in the avoided hospitalizations
rate per 10 thousand
Susceptible adult population
Goal of reduction in CV outcomes (absolute fi gures)
Observed CV outcomes
Defi cit in protection to CV
outcomes in %
Caibi 4,2 3,219 1.33 4 33.5
Treze Tílias 4.0 3,253 1.29 4 32.4
Imbuia 3.3 2,975 0.99 5 19.8
Santiago do Sul 2.7 900 0.24 1 24.7
Painel 1.7 1,535 0.26 4 6.5
Erval Velho 1.6 2,397 0.38 6 6.5
Antônio Carlos 1.4 4,254 0.61 4 15.3
Irani 1.4 5,509 0.78 5 15.8
Romelândia 0.8 2,363 0.18 4 4.5
Ibiam 0.4 1,122 0.04 1 4.5
Águas Frias 0.3 1,159 0.03 1 3.5
Itá 0.1 4,219 0.05 3 2.0
Total 145,102 250,60 387 64,8
CV: Cardiovacular
although we considered here only the actions related to the specifi c health condition as services indicators.
The most effi cient services production, without the consequent effi cient results production, may be related to lack of quality in the services, which was also hypoth-esized by Trompieri Neto et al (2008).d
Varela et ale measured the efficiency of primary
healthcare services of 599 municipalities of São Paulo, Southeastern Brazil. The authors used secondary data and verifi ed a change in the score of services effi ciency when they analyzed other non-controllable variables related to the population’s characteristics, the scale of the healthcare establishments and the percentage of the municipalities’ own resources invested in health. These factors were not analyzed in the present study, but a large part was controlled by size restrictions and integral coverage by the ESF. It is known that there are factors which are external to the selected indicators that infl uence services productivity and results productivity,e
but they are unknown in the present study.
Evaluations of effectiveness predominate over effi -ciency in national and international evaluative research related to programs for control of cardiovascular diseases. These programs were evaluated in primary healthcare in the United States, Norway, Pakistan and Sweden. Although they are applied in different forms, all of them have the objective of reducing cardiovas-cular risk factors, including SAH. 10,11,13,18
In Brazil, studies on the theme also concentrate on the analysis of effectiveness. In one of them, 98% of adhe-rence and impact of PSF of 57% regarding blood pres-sure control were observed, with a mean of 10.1, ± 3.9 consultations per year in the state of Bahia, Northeastern Brazil.2 In São Paulo, effectiveness in one primary care
unit (not related to the PSF) was of 44%, with two to four annual consultations.15 One of the benchmarks in
services production presented 1.6 individual consulta-tions per year for its patients enrolled in SISHIPERDIA in Santa Catarina. Besides the individual consultations, approximately 27 home visits were performed per year. Petrolândia (Santa Catarina) obtained effi ciency in the results based on these services.
Hospitalization rates due to Conditions that are Sensitive to Primary Healthcare (CSPH) are used as indicator of quality and resolution capacity of primary Table 5. Association between effi ciency in service production and in impact production related to systemic arterial hypertension and performed by the Family Health Strategy in municipalities located in Santa Catarina. Santa Catarina, Southern Brazil, 2007.
Effi ciency in service production
Effi ciency in impact production
Yes No Total
n % n % n %
Yes 9 36.0 16 64.0 25 37.9
No 2 4.9 39 95.1 41 62.1
Total 11 16.7 55 83.3 66 100.0
z = 3.28 (p=0.001)
d Trompieri Neto N, Lopes DAF, Barbosa MP, Holanda MC. Determinantes da Efi ciência dos Gastos Públicos Municipais em Educação e Saúde: O Caso do Ceará. IV Encontro Economia do Ceará em Debate. Fortaleza; 2008.
healthcare in many studies.5,12 Among the ineffi cient
municipalities, 387 hospitalizations were observed. To achieve effi ciency in results, it would be necessary that 250.6 potentially avoidable hospitalizations had not occurred, that is, 64.8% could have been prevented in these municipalities, in case they had adopted the benchmarks’ practices.
Bermúdez-Tamayoa et al3 (2004) correlated the
hospitalizations due to CSPH in hospitals of Granada, Spain, with type of care, distance from hospital and sociodemographic factors and they found differences in the hospitalization rates due to CSPH associated with the organization characteristics of primary healthcare, size of municipality and distance from hospital.3 The
ineffi ciency found in the present study was not subject to size or type of care, as the municipalities formed a
homogeneous group that had the same size and type of primary healthcare (ESF). Distance from hospital was not analyzed. In the Spanish study,4 this variable was
related to the municipality’s size and was an infl uent factor in the large municipalities, which were excluded from the present study. The hospitalization patterns can be infl uenced by other factors, such as the culture of use of services by the population, the admission policies in hospitals and the very quality of the provided services, which were also not evaluated.
11
Rev Saúde Pública 2011;45(2)
1. Andrade LOM, Bueno ICHC, Bezerra RC. Atenção Primária à Saúde e Estratégia Saúde da Família. In: Campos GWS, Minayo MCS, Akerman M, organizadores. Tratado de Saúde Coletiva. Rio de Janeiro: Editora FIOCRUZ; 2006. p.783-836. 2. Araujo JC, Guimaraes AC. Controle da hipertensão
arterial em uma unidade de saúde da família. Rev Saude Publica. 2007;41(3):368-74. DOI:10.1590/ S0034-89102007000300007
3. Bermúdez-Tamayo C, Márquez-Calderón S, Rodriguez del Aguila MM, Perea-Milla López E, Ortiz Espinosa J. Caracteristicas organizativas de la atencion primaria y hospitalizacion por los principales ambulatory care sensitive conditions. Aten Primaria. 2004;33(6):305-11. DOI:10.1157/13059762
4. Camargo KR, Mascarenhas MTM, Mauad NM, Franco TB, David HMSL, Alves MJM, et al. Vivências e refl exões de avaliação na AB, a experiência dos ELBs/ Proesf em MG e ES. In: Hartz ZMA, Felisberto E, Silva LMV, organizadores. Meta-avaliação da atenção básica à saúde-teoria e prática. Rio de Janeiro: Editora FIOCRUZ 2008. p.119-52.
5. Caminal Homar J, Starfi eld B, Sánchez Ruiz E, Hermosilla Pérez E, Martín Mateo M. La atención primaria de salud y las hospitalizaciones por Ambulatory Care Sensitive Conditions en Cataluña. Rev Clin Esp. 2001;201(9):501-7.
6. Charnes A, Cooper WW, Rhodes E. Measuring the effi ciency of decision making units. Eur J Opnl Res.1978;2(6):429-44. DOI:10.1016/0377-2217(78)90138-8
7. Cordeiro H, Pereira TR, Costa Jr H, Pereira ATS, Sulamis D. Acreditação como avaliação nos serviços de atenção primária em saúde. In: Hartz ZMA, Felisberto E, Silva LMV, organizadores. Meta-avaliação da atenção básica à saúde- teoria e prática. Rio de Janeiro: Editora FIOCRUZ; 2008. p.153-66. 8. Espigares JLN. Analisis de la efi ciência em las
organizaciones hospitalares públicas. Granada: Editora Universal de Granada; 1999. Análisis de la efi ciencia en el entorno hospitalario: el análisis envolvente de datos; p.247-57.
9. Facchini LA, Piccini RX, Tomasi E, Thumé E, Silveira DS, Siqueira FV, et al. Desempenho do PSF no Sul e no Nordeste do Brasil: avaliação institucional e epidemiológica da atenção básica à saúde. Cienc
Saude Coletiva. 2006;11(3):669-81. DOI:10.1590/ S1413-81232006000300015
10. Lupton BS, Fønnebø V, Søgaard AJ, Langfeldt E. The Finnmark Intervention Study. Better health for the fi shery population in an Arctic village in North Norway. Scand J Prim Health Care. 2002;20(4):213-8. DOI:10.1080/028134302321004863
11. Murray CJ, Lauer JA, Hutubessy RC, Niessen L, Tomijima N, Rodgers A, et al. Effectiveness and costs of interventions to lower systolic blood pressure and cholesterol: a global and regional analysis on reduction of cardiovascular-disease risk. Lancet. 2003;361(9359):717-25 DOI:10.1016/S0140-6736(03)12655-4
12. Nedel FB, Facchini LA, Martín-Mateo M, Vieira LAS, Thumé E. Programa Saúde da Família e condições sensíveis à atenção primária, Bagé (RS). Rev Saude Publica. 2008;42(6):1041-52. DOI:10.1590/S0034-89102008000600010
13. Nishtar S, Badar A, Kamal MU, Iqbal A, Bajwa R, Shah T, et al. The Heartfi le Lodhran CVD prevention project--end of project evaluation. Promot Educ. 2007;14(1):17-27.
14. Puig-Junoy J. Efi ciencia en la atención primaria de salud: una revisión crítica de las medidas de frontera. Rev Esp Salud Publica. 2000;74(5-6):483-95. DOI:10.1590/S1135-57272000000500005
15. Sala A, Nemes Filho A, Eluf-Neto J. Avaliação da efetividade do controle da hipertensão arterial em unidade básica de saúde. Rev Saude Publica. 1996;30(2):161-7 DOI:10.1590/S0034-89101996000200008
16. Sancho LG. Efi ciência. In: Sancho LG, editor. Avaliação econômica em saúde. São Paulo: Aderaldo & Rothschild; 2007. p.61-77.
17. Starfi eld B. Avaliação da APS: uma visão da população. In: Starfi eld B, organizador. Atenção Primária: equilíbrio entre necessidade de saúde, serviços e tecnologia. Brasília: UNESCO, Ministério da Saúde; 2004. p.481-532.
18. Weinehall L, Lewis C, Nafziger AN, Jenkins PL, Erb TA, Pearson TA, et al. Different outcomes for different interventions with different focus!--A cross-country comparison of community interventions in rural Swedish and US populations. Scand J Public Health Suppl. 2001;56:46-58.
REFERENCES
Study based on the Master’s dissertation authored by Rabetti AC, submitted to Universidade Federal de Santa Catarina in 2009.