Diversity and three-dimensional structures of the alpha Mcr
of the methanogenic Archaea from the anoxic region of Tucuruí Lake,
in Eastern Brazilian Amazonia
Priscila Bessa Santana
1, Rubens Ghilardi Junior
2, Claudio Nahum Alves
3, Jeronimo Lameira Silva
3,
John Anthony McCulloch
1, Maria Paula Cruz Schneider
1and Artur da Costa da Silva
11
Instituto de Ciências Biológicas, Universidade Federal do Pará, Belém, PA, Brazil.
2
Centrais Elétricas do Norte do Brazil S/A, Superintendência de Meio Ambiente, Brasília, DF, Brazil.
3
Instituto de Ciências Exatas e Naturais, Universidade Federal do Pará, Belém, PA, Brazil.
Abstract
Methanogenic archaeans are organisms of considerable ecological and biotechnological interest that produce meth-ane through a restricted metabolic pathway, which culminates in the reaction catalyzed by the Methyl-coenzyme M reductase (Mcr) enzyme, and results in the release of methane. Using a metagenomic approach, the gene of thea
subunit ofmcr (mcra) was isolated from sediment sample from an anoxic zone, rich in decomposing organic mate-rial, obtained from the Tucuruí hydroelectric dam reservoir in eastern Brazilian Amazonia. The partial nucleotide se-quences obtained were 83 to 95% similar to those available in databases, indicating a low diversity of archaeans in the reservoir. Two orders were identified - theMethanomicrobiales, and a unique Operational Taxonomic Unit (OTU) forming a clade with theMethanosarcinales according to low bootstrap values. Homology modeling was used to de-termine the three-dimensional (3D) structures, for this the partial nucleotide sequence of the mcrawere isolated and translated on their partial amino acid sequences. The 3D structures of the archaean Mcraobserved in the present study varied little, and presented approximately 70% identity in comparison with the McraofMethanopyrus klanderi. The results demonstrated that the community of methanogenic archaeans of the anoxic C1 region of the Tucurui res-ervoir is relatively homogeneous.
Key words:Amazonian, Archaea, diversity, methyl-coenzyme M reductase, mcra, homology modeling.
Received: March 10, 2011; Accepted: September 13, 2011.
Introduction
The organisms of the Domain Archaea (Woeseet al.,
1990) constitute a considerable proportion of the prokaryo-tes found in both aquatic and terrestrial ecosystems, where they are active in the carbon biogeochemical cycle. From a physiological viewpoint, the Domain is divided into three different groups: the haloarchaea, methanogenics, and ther-mophilics, the latter being dependent on sulfur (Valentine, 2007).
The methanogenic archaea are of special interest be-cause of their capacity to reduce CO2and other compounds
in the presence of H2(Conrad, 1999), under anoxic
condi-tions, to produce methane through a process known as methanogenesis (Zehnder and Brock, 1979). Methane is one of the greenhouse gases and, with an atmospheric half-life of only 8.9 years, it inflicts an effect on global warming 24 times greater than that contributed by CO2(Houghtonet al.,
2001). As a non-fossil hydrocarbon, it also generates interest as a potential biofuel (Hansen et al., 2006; Blottnitz and
Curran 2007; Tilche and Galatola, 2008).
Archaean communities are distributed worldwide, and are known for their considerable heterogeneity (Schleper et al., 2005). Studies of the diversity of archaean communities have been conducted in a variety of environments, from hot (Martinezet al., 2006) and hyper-saline (Oren, 2002) lakes, anoxic zones (Lehourset al., 2007) and marine sediments (Teske and Sørensen, 2008) to the digestive systems of ruminants and humans (Lange and Ahring, 2001).
The reservoirs of hydroelectric power stations are known to emit large quantities of methane from biological sources, due to their tendency to accumulate organic mate-rial and create an environment favorable for methanoge-nesis (St Louiset al., 2000; Kemeneset al., 2007). With the
World’s most extensive system of river basins at its dis-posal, the Brazilian electricity network is centered on hydropower, which was responsible for 77.4% (374.015 GWh) of the electrical energy produced in the
www.sbg.org.br
Send correspondence to Artur da Costa da Silva. Instituto de Ciências Biológicas, Universidade Federal do Pará, 66075-900 Belém, PA, Brazil. E-mail: [email protected].
country in 2007 (Brazilian Ministry for Mines and Energy, 2009).
The country’s main hydropower potential is in its northern region, along the tributaries of the Amazon basin. The construction of hydroelectric dams in the Brazilian Amazon over the past three decades has been the subject of considerable controversy between government agencies and many sectors of Society. By 2010, the Brazilian Minis-try for Mines and Energy plans the construction of further three major dams, which will feature increased productiv-ity, reduced flooding, and minimal impact on local fauna, flora, and indigenous societies, in comparison with previ-ous projects.
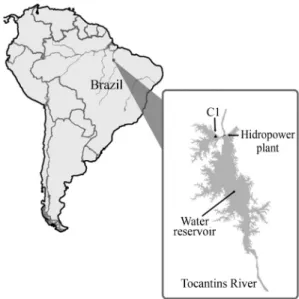
Currently, the Tucuruí dam (UHE Tucuruí), which is located on the Tocantins River in the southeast of the Bra-zilian state of Pará (03°455’8” S, 49°40’21” W), is the country’s largest and most productive hydropower plant. The Tucuruí Reservoir is 170 km long, with a perimeter of 7700 km, a depth of 60 m, and a total of 1500 islands (Tundisi, 2007).
Analyses conducted by Centrais Elétricas do Norte do Brazil, the state company responsible for Tucuruí hydro-electric power plant, as part of its quality control program, has indicated the existence of specific areas, such as Region C1 (Figure 1), which are favorable for methanogenesis. During most of the year, C1 has an anoxic environment, with still water and abundant organic material. Culture-independent analyses based on ssuRNA sequences have confirmed the presence of methanogenic archaea at various levels in the water column (Graçaset al., personal
commu-nication), and previous studies of methane emissions (Fearnside, 1997; Lima, 2005) have confirmed the elevated methanogenic capacity of the reservoir.
Studies of the characteristics and diversity of archaean communities have been based on the nucleotide diversity of 16S rRNA (Keoughet al., 2003; Lehourset al.,
2005; Schleperet al., 2005). Studies (Shapiroet al., 2007)
have also demonstrated the importance of the secondary structure of 16S for the analysis of the diversity and phylo-genetic relations of prokaryotes. Similarly, analysis of the nucleotide sequence of the Methyl-coenzyme M reductase (mcr) gene has proven to be an invaluable tool for the study
of diversity, given that this gene is present in all metha-nogenic archaea (Baptesteet al., 2005).
Homology modeling is a well-known analytical tool through which it is possible to modeled the three-dimen-sional (3D) structure of a given protein based on knowledge of its primary structure (Martí-Renomet al., 2000). This
approach is only possible because the 3D structure of ho-mologous proteins is conserved during the evolutionary process, especially in the case of the functional residuals, given that conservation of the structure is crucial to the maintenance and development of specific functions (Höltje
et al., 2003). Therefore, the strategy of this approach is
based on the fact that, during the evolutionary process, the structural configuration of a protein tends to be better pre-served than its aminoacid sequence, and that minor changes in the sequence generally result in only slight modifications of the 3D structure (Nayeemet al., 2003). The comparative
or homology modeling of the 3D structure of the target pro-tein is possible if at least one resolved 3D structure se-quence which is homologous to the amino acid sese-quence is available (Höltjeet al., 2003).
In the present study the diversity of archaean commu-nities derived from samples of sediment collected from C1 region of UHE Tucuruí was accessed. In order to achieve, partial nucleotide sequences ofmcra were analysed and homology modeling was carried out.
Materials and Methods
Study site and sampling
Individual samples of sediment were collected during the dry season (July-November) of 2006 at point C1 of the Tucuruí Reservoir, using a Van Veen grab.In loco
mea-surements of pH (6.25), temperature (30.2 °C) and conduc-tivity (2.04 mg/mL) and local depth (20 m) were taken. The samples were stored at room temperature in flasks shielded from sunlight. The DNA was obtained using an UltraClean (Mo Bio, USA) kit, according to the manufacturer’s in-structions.
Amplification via PCR and cloning
Specific DNA sequences were amplified using PCR, with the degenerate primers ME1, 5’-GCMATGCARA THGGWATGTC-3’, and ME2 5’-TCATKGCRTAGTT DGGRTAGT-3’, as described by Haleset al.(1996), and
MLf 5’- GGTGGTGTMGGATTCACACARTAYGCWA Figure 1- Map showing the reservoir of the Tucuruí Hydroelectric
CAGC -3’, and MLr 5’- TTCATTGCRTAGTTWGGRT AGTT -3’, as described by Lutonet al.(2002). Each
ampli-fication solution contained 200 mM of Tris-HCl (pH 8.4), 500 mM of KCl, 200mM of each dNTP, 3mM of MgCl2,
3.2 pmol of oligonucleotide, 100 ng of DNA and 1 U of Taq polymerase (Invitrogen, Brazil) in a final volume of 25mL. The following cycling conditions were applied in an Eppendorf Mastercycler thermocycler (Eppendorf, Ger-many): initial denaturation at 95 °C for 6 min, 35 cycles at 95 °C for 1 min, annealing at 51 °C for 1 min, 72 °C for 1 min, followed by final extension at 72 °C for 5 min.
The amplicons were purified in agarose gel using an Illustra GFX PCR DNA kit and a Gel Band Purification Kit (GE Healthcare Life, UK). The fragments separated by electrophoresis in the 750 bp and 490 bp size range, corre-sponding to the amplicons generated using the ME and ML primers, respectively, were cloned in a pGEM®-T Easy Vector System (Promega Corp, USA) and electrotrans-formed into competent Top10Escherichia colicells
(Invi-trogen, USA). One hundred clones were selected randomly by screening of white colonies. The recombinant clones were transferred to Luria-Bertani culture medium (DIFCO, USA), and the plasmidial DNA was isolated by mini-preparation and purified using MAGV N22 membranes (Millipore, USA).
Sequencing and the editing of the sequences
The purified DNA was sequenced in a MegaBACE 1000 automatic sequencer (GE HealthCare, USA). The se-quences were then edited in BioEdit, version 7.05 (Hall 1999), aligned with ClustalW, version 2.0 (Thompsonet al.
1994) and then checked using NCBI’s BLAST tool.
Analyses of diversity
For the analysis of diversity, rarefaction curves were generated using version 1.3 of the Dotur program (Schloss and Handelsman, 2005) for the identification of unique Op-erational Taxonomic Units (OTUs) defined by a sequence dissimilarity of 3%. Two rarefaction curves were gener-ated, one of which was used for homology modeling, the other including all the sequences obtained in this study. The first curve was produced using the amplicons obtained with the primers as described by Haleset al.(1996), whereas for
the second, the amplicons obtained using the primers as de-scribed by Lutonet al.(2002) were added.
The nucleotide sequences were converted into amino acid sequences using BioEdit software. Additionally, gene trees were produced in MEGA 4.1, using only the unique OTUs identified from either nucleotide or amino-acid se-quences. For this, the Kimura 2-parameter evolutionary model was used with bootstrap analysis for 1000 replicates.
Homology modeling
All procedures of homology modeling follow four main stages (Schwedeet al., 2003): (i) selection of the
pro-tein template; (ii) alignment of the target sequence and tem-plate protein; (iii) construction of the 3D model; (iv) and evaluation of the 3D model.
For the homology modeling, the partial nucleotide se-quences obtained with the ME primer were chosen as a tar-get sequence, because they produced a fragment of 750 bp, which stretches from the amino acid 227-alanine to 476-proline, forming a total of 249 fundamental residuals for the enzymatic function of the Mcraprotein. The partial nucle-otide sequences were converted into amino acid sequences and the multiple alignment was carried out using software ClustalW.
The 3D models were modeled by the rigid body grouping method, using the Swiss-Model Workspace (Schwedeet al., 2003; Arnoldet al., 2006). This server is used to align the target sequences and template structure available in the Protein Data Bank (PDB). Once the tem-plate has been selected the 3D structure of the target se-quences can be modeled.
The stereochemical quality of the structures was eval-uated using ProCheck, version 3.0 (Laskowskiet al., 2003),
and the distribution of residual energy in Prosa, version 3.0 (Wiederstein and Sippl, 2007). Following this evaluation, the target structures were superimposed in theUCSF
Chi-mera program, version 1.21 (Menget al., 2006), in order to
identify more accurately any differences in folding that may exist among the structures within the different clades represented in the gene trees. The Root Mean Square (RMS) was also calculated to compare the target and tem-plate structures.
GeneBank® access: All sequences are available in GenBank® database as accession number FJ715506 -FJ715617. The sequences used to build the 3D structures are available as FJ715545, FJ715553 - FJ715558, FJ715569, FJ715571, FJ715573 - FJ715577, FJ715579, FJ715581, FJ715582, FJ715584 - FJ715587, FJ715594, FJ715595, FJ715597 - FJ715599, FJ715605 - FJ715607.
Results
Analyses of nucleotide diversity
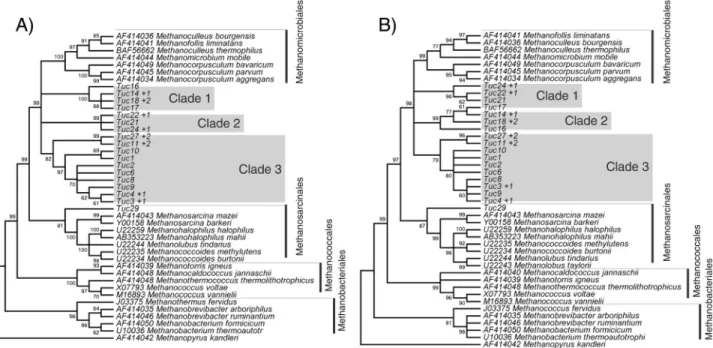
The first rarefaction curve (Figure 2A) produced 18 OTUs from 28 archaean nucleotide sequences obtained using the primers according to Haleset al.(1996)
follow-ing treatment with Dotur. For the second curve (Figure 2B), we added, to the original 28 sequences, the sequences obtained using the primers according to Luton
et al. (2002) resulting in a total of 113 nucleotide
Homology modeling
A total of 28 3D structures were generated, 6 of which were modeled by homology with the Mcra of
Methanosarcina barkeri (1E6Y), and the target-template alignment showed 70% identity. The other 22 sequences were modeled by homology with the Mcra of
Methanopyrus klanderi (1E6V), showing an identity of
68%-70%. The 1E6Y and 1E6V template models men-tioned above are available from the PDB. The 28 structures returned RMS values between 0.06 and 0.48 (see Supple-mentary Material, Table S1).
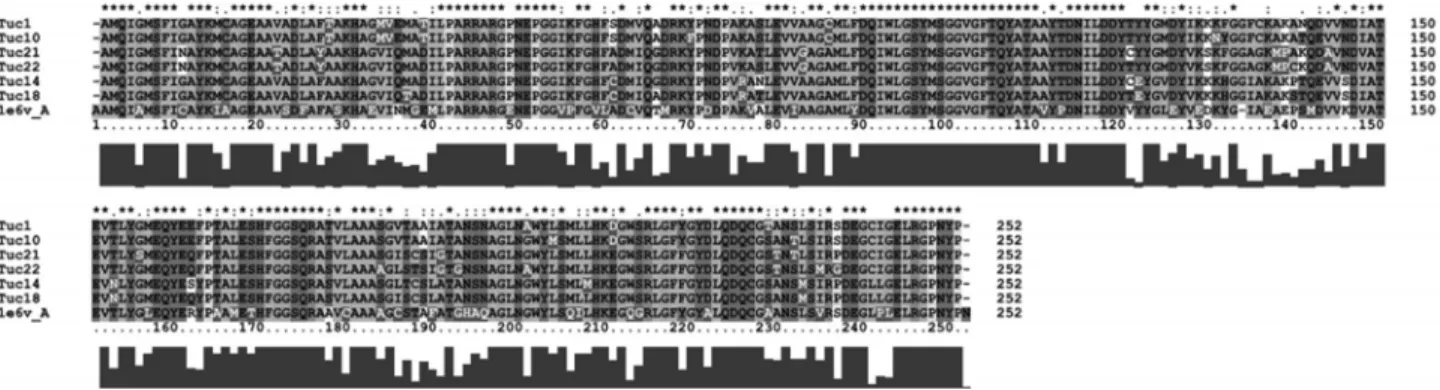
Clades 1 and 2 of the gene trees showed higher homo-logy level with the McraofM. klanderi. Figure 4 clearly
shows their close similarity by the multiple alignment of target sequences, clades 1 and 2, and the template sequence,
M. klanderi.Clade 3 and Tuc29 showed higher homology
level with the McraofM. barkery.
Ramachandran graphs were plotted for the evaluation of the stereochemical quality of the 3D structures (see Sup-plementary Material, Figure S1). These plots represent the distribution of theFandyangles in each residual of the aminoacid. Between 84.7 and 86.0% of the residuals of the 28 structures were located in favorable regions. The
z-scores for residual energy varied between -5.66 and -5.92 (see Supplementary Material, Figure S2).
The 3D structures of each clade were superimposed. No significant differences were observed in the folding of the 3D structures when they were superimposed within the same clade. Based on this procedure, representative struc-Figure 2- Rarefaction curve for themcragene (A) First rarefaction curve.
The dotted line represents the sample from the present study, and the con-tinuous line, the statistical estimate of the unique OTUs observed based on the differences in nucleotide sequences observed in the sample. (B) Sec-ond rarefaction curve plotted following the inclusion of the sequence data for themcragene obtained using the primers of Haleset al.(1996) and Lutonet al.(2002).
Figure 3- Comparison of the gene trees for nucleotides (A) and amino acids (B). The sequences of the organisms identified by their scientific names were
tures were randomly selected from each clade for the com-parison of the folding pattern among different clades. Once again, however, no significant difference was found be-tween structures.
Discussion
The Mcr protein is made up of three subunits (a,b, andg), which are each formed by two chains, where thea subunit, is the most popular for the inference of phylogen-etic relationships (Haleset al., 1996; Lutonet al., 2002; Hallan et al., 2003; Castro et al., 2004; Springer et al., 2005; Juottonenet al., 2006). Springer et al.(1995) and Lutonet al.(2002) recorded broad similarities among the topologies of the arrangements obtained for 16S rRNA and the partial sequences of themcragene.
Preliminary studies of the Tucuruí ecogenome (Gra-çaset al., personal communication) have shown, through
the analysis of the 16S rRNA gene, the predominance of the order Methanomicrobiales in region C1 of UHE Tucuruí. The present analysis ofmcracorroborated these findings in 16S, and indicated an abundance of organisms closely re-lated to the Methanomicrobiales. This order encompasses 24 recognized species in nine genera and three families, al-though the phylogeny of this group is extremely complex, and still not fully understood (Cavicchiolli, 2007).
The first rarefaction curve was based on the se-quences obtained using the primers of Haleset al.(1996).
The curve tended to plateau, suggesting that the number of unique OTUs is a good representation of the diversity of the archaean community of the C1 region of the Tucuruí reser-voir. However, the second rarefaction curve which was based on the addition of the OTUs obtained using the prim-ers of Lutonet al.(2002), revealed a much higher diversity
in comparison with the first curve. This indicates that, when only one pair of primers is used, the preferential amplifica-tion of some organisms may result in the underestimaamplifica-tion of the methanogenic biodiversity of an area such as C1. The addition of the OTUs derived from the primers according to
Lutonet al.widened the spectrum of organisms identified,
and revealed a much higher diversity.
The surveys of Earlet al. (2003) and Castroet al.
(2004) in the Priest Pot nature reserve in the UK and the WCA-2A conservation area in the northern Florida Ever-glades, (respectively) also found a predominance of metha-nogenic archaeans phylogenetically related to the Methanomicrobiales. These authors justified the pattern as the result of the higher temperatures and greater solar radia-tion during the summer months, which resulted in an in-crease in the microbian metabolism and anaerobic fermentation of organic material. In this case, the alter-ations in the biochemical composition of the water would have favored hydrogenotrophic methanogenesis, which is the preferential mode of biomethanogenesis in the Methanomicrobiales (Cavicchiolli, 2007). This same hy-pothesis may apply to region C1 of the Tucuruí reservoir, given that the area is characterized by relatively high tem-peratures and levels of solar radiation, as well as abundant organic material, throughout the year. An additional factor favoring the production of hydrocarbons is the fact that the region is anoxic.
Methanogenesis is carried out through the syntrophic association of micro-organisms capable of fermenting glu-cose into shorter-chain carbon compounds such as formate, acetate, methanol, methylamines, methylthios and CO2
(Thauer, 1998). This process can have three distinct routes: hydrogenotrophic (Horn et al., 2003), acetylclastic or
methylotrophic (Ferry, 1999). These pathways vary in the preferential use of different substrates for the acquisition of metabolic energy. In general, the three routes converge in a sequence of seven reactions, the last of which is induced by the enzyme Mcr, which catalyzes the synthesis of hetero-disulfide (CoM-S-S-CoB) from the substrates coenzyme M (CH3-S-CoM) and coenzyme B (H-S-CoB), liberating
methane (CH4) as a subproduct (Thauer, 1998):
CH3-S-CoM + H-S-CoB CoM-S-S-CoB + CH4
Little is known of the 3D structure of Mcra. Crystal-lographic Mcr could only be found in the PDB for three Figure 4- Multiple alignment of the amino acid sequences of the McraofMethanospyrus klandery, showing the template and the sequences obtained in
methanogenic archaeans - M. klanderi (Grabarse et al.,
2000), M. barkeri (Grabarse et al., 2000), and Methanobacterium thermoautotrophicum (Ermler et al.,
1997). In the present study, the Mcra of the first two of these organisms were selected as the template for homo-logy modeling. Despite the apparent phylogenetic distance betweenM. klanderiandM. barkeri, the template and tar-get were highly homologous.
For the analysis of 3D structure, the three subgroups of the gene tree were treated separately. The RMS values for the 28 structures obtained varied from 0.06 to 0.48, which indicates only a slight deviation between targets and the templates, supported by their identity values (68%-70%). No significant differences were observed in the fold-ing of the 3D structures when target and templates of the same clade were superimposed. Given this, representative structures of each clade were selected randomly for the comparisons among the different clades, which indicated that the 3D structures of the Mcraof archaeans of different orders tend to be well conserved (Fonget al., 2007), despite
their characteristic differences in the distribution of amino acid residues on the protein surface (Grabarseet al., 2000).
The Ramachandran graphs indicated that all 28 tar-gets structures analyzed were of good stereochemical qual-ity, given that 85 to 86% of the residuals of the amino acids modeled presented spatially viable angles, being located in favorable areas of the graph, where the angles and residual energy are compatible (Morriset al., 1992). The variety of
possible random protein configurations and the respective deviation of the total structures’s energy are shown by z-score graphs (Sippl, 1993). These scores varied between -5,66 and -5,92 for the 28 targets obtained from the homo-logy modeling, which indicates that the structures gener-ated are energetically stable. The scarcity of crystallo-graphic models of Mcr for the archaea of the order Methanomicrobiales did not limit the effectiveness of the homology modeling, given the high identity scores (68%-70%) recorded between the template and target structures, subsequently confirmed by the generation of structures with high indices of quality.
The nucleotide sequence of the alpha subunit of the
mcrgene and the reduced number of unique OTUs indi-cates the existence of a relatively low diversity of methano-genic archaea (83%-95% identity with the NCBI data bank) in region C1 of the ecogenome of the Tucuruí reservoir. Themcragene has proven to be a useful tool for the study of diversity in methanogenic archaeans, especially consid-ering its ample distribution among these organisms. In the archaeans of the C1 region of the Tucuruí reservoir low lev-els of polymorphism in nucleotides, predicted amino acids, and Mcra3D structures. The majority of the mutations ob-served in the nucleotide sequences did not cause any changes in the residuals, and where this did occur, the sub-stitutions modified the 3D structure of themcralpha
frag-ment only slightly.
The present study is the first of its kind, to our knowl-edge, to investigate the ecology of the methanogenic archaea of a tropical hydroelectric reservoir, and contribute to the understanding of the principal organisms responsible for biomethanogenesis in the aquatic environments of the Amazon basin. The study also demonstrated the usefulness of the comparative modeling of proteins as a tool for the elucidation of the 3D structure of the Mcr protein alpha subunit, and that this constitutes a promising approach for the understanding of the equilibrium between methano-genesis and methanotrophy in Amazonian hydroelectric reservoirs.
Acknowledgments
This study was supported by Programa de Pesquisa e Desenvolvimento Tecnológico do Setor de Energia Elétrica regulado pela ANEEL and Centrais Elétricas do Norte do Brazil S/A (Eletronorte), the Pará State Research Founda-tion (FAPESPA), and the Brazilian Ministry of Science and Technology - CNPq. The authors are grateful to Maria Silvanira Ribeiro Barbosa and Soraya Silva Andrade for their technical support. José Rogério de Araújo Silva pro-vided excellent assistance with the graphic material.
References
Arnold K, Bordoli L, Kopp J and Schwede T (2006) The SWISS-MODEL Workspace: A web-based environment for protein structure homology modelling. Bioinformatics 22:195-201. Bapteste É, Brochier C and Boucher Y (2005) Higher-level classi-fication of the Archaea: Evolution of methanogenesis and methanogens. Archaea 1:353-363.
Blottnitz HV and Curran MA (2007) A review of assessments conducted on bioethanol as a transportation fuel from a net energy, greenhouse gas, and environmental life cycle per-spective. Journal of Cleaner Production 15:607-619. Castro H, Ogram A and Reddy KR (2004) Phylogenetic
charac-terization of methanogenic assemblages in eutrophic and oligotrophic areas of the Florida Everglades. Appl Environ Microbiol 70:6559-6568.
Cavicchiolli R (2007) Methanogenesis. In: Ferry JG and Kastead KA (eds) Archaea: Molecular and Cellular Biology. ASM Press, Washington DC, pp 288-314.
Conrad R (1999) Contribution of hydrogen to methane production and control of hydrogen concentrations in methanogenic soils and sediments. FEMS Microbiol Ecol 28:193-202. Earl J, Hall G, Pickup RW, Ritchie DA and Edwards C (2003)
Analysis of Methanogen Diversity in a Hypereutrophic Lake Using PCR-RFLP Analysis of mcr Sequences. Microb Ecol 46:270-278.
Ermler U, Grabarse W, Shima S, Goubeaud M and Thauer RK (1997) Structure of Methyl-Coenzyme M Reductase: The Key Enzyme of Biological Methane Formation Crystal. Sci-ence 278:1457-1462.
Ferry JG (1999) Enzymology of one-carbon metabolism in me-thanogenic pathways. FEMS Microbiol Rev 23:13-38. Fong JH, Geer LY, Panchenko AR and Bryant SH (2007)
Modeling the evolution of protein domain architecture using maximum parsimony. J Mol Biol 366:307-315.
Grabarse W, Mahlert F, Shima S, Thauer RK and Ermler U (2000) Comparison of three methyl-coenzyme M reductases from phylogenetically distant organisms: Unusual amino acid modification, conservation and adaptation. J Mol Biol 303:329-344.
Hales BA, Edwards C, Ritchie DA, Hall G, Pickup RW and Saunders JR (1996) Isolation and identification of metha-nogen-specific DNA from Blanket Bog Peat by PCR ampli-fication and sequence analysis. Appl Environ Microbiol 62:668-675.
Hall TA (1999) BioEdit: A user-friendly biological sequence alignment editor and analysis program for Windows 95/98/NT. Nucl Acids Symposium 41:95-98.
Hallam SJ, Girguis PR, Preston CM, Richardson PM and DeLong EF (2003) Identification of methyl coenzyme M reductase A (mcra) genes associated with methane-oxidizing Archaea. Appl Environ Microbiol 69:5483-5491.
Hansen J, Sato M, Ruedy R, Lo K, Lea DW and Medina-Elizade M (2006) Global temperature change. PNAS 103:14288-14293.
Höltje HD, Sippl W, Rognan D and Folkers G (2003) Molecular Modeling: Basic Principles and Applications. Introduction to Comparative Protein Modeling. 3th edition. Wiley-VCH, Weinheim 310 pp.
Horn MA, Matthies C, Kusel K, Schramm A and Drake HL (2003) Hydrogenotrophic methanogenesis by moderately acid-tolerant methanogens of a methane-emitting acidic peat. Appl Environ Microbiol 69:74-83.
Houghton JT, Ding Y, Griggs DJ, Noguer M, Van der Linden PJ, Dai X, Maskell K and Johnson CA (2001) IPCC Climate Change 2001: The Scientific Basis. Contribution of Wor-king Group I to the Third Assessment Report of the Inter-governmental Panel on Climate Change. Cambridge Uni-versity Press, Cambridge, United Kingdom and New York, 944 pp.
Juottonen H, Galand PE and Yrjälä K (2006) Detection of metha-nogenic Archaea in peat: Comparison of PCR primers tar-geting themcrAgene. Res Microbiol 157:914-921. Kemenes A, Forsberg BR and Melack M (2007) Methane release
below a tropical hydroelectric dam. Geophys Res Lett 34:e12809.
Keough BP, Schmidt TM and Hicks RE (2003) Archaeal nucleic acids in picoplankton from great lakes on three continents. Microbiol Ecol 46:238-248.
Lange M and Ahring BK (2001) A comprehensive study into the molecular methodology and molecular biology of metha-nogenic Archaea. FEMS Microbiol Rev 25:553-571. Laskowski RA, MacArthur MW, Moss DS and Thornton JM
(2003) PROCHECK: A program to check the stereo chemi-cal quality of protein structures. J Appl Cryst 26:283-291. Lehours AC, Bardot C, Thenot A, Debroas D and Fonty G (2005)
Anaerobic microbial communities in Lake Pavin, a unique meromictic lake in France. Appl Environ Microbiol 71:7389-400.
Lehours AC, Evans P, Bardot C, Joblin K and Gérard F (2007) Phylogenetic Diversity of Archaea and Bacteria in the
Ano-xic Zone of a Meromictic Lake (Lake Pavin, France). Appl Environ Microbiol 73:2016-2019.
Lima IBT (2005) Biogeochemical distinction of methane releases from two Amazon hydroreservoirs. Chemosphere 59:1697-1702.
Luton PE, Wayne JM, Sharp RJ and Riley PW (2002) Themcra
gene as an alternative to 16S rRNA in the phylogenetic anal-ysis of methanogen populations in landfill. Microbiology 148:3521-3530.
Martinez RJ, Mills HJ, Story S and Sobeck PA (2006) Prokaryotic diversity and metabolically active microbial populations in sediments from an active mud volcano in the Gulf of Mex-ico. Environ Microbiol 8:1783-1796.
Martí-Renom MA, Stuart AC, Fiser A, Sánchez R, Melo F and Sali A (2000) Comparative protein structure modeling of genes and genomes. Ann Rev Biophys Biomol Struct 29:291-325.
Meng EC, Pettersen EF, Couch GS, Huang CC and Ferrin TE (2006) Tools for integrated sequence-structure analysis with UCSF Chimera. BMC Bioinformatics 7:1471-2105. Morris AL, MacArthur MW, Hutchinson EG and Thornton JM
(1992) Stereochemical quality of protein structure coordi-nates. Proteins: Struct Funct Bioinformat 72:345-364. Nayeem A, Sitkoff D and Junior SK (2006) A comparative study
of available software for high accuracy homology modeling: From sequence alignments to structural models. Protein Sci 15:808-824.
Oren A (2002) Molecular ecology of extremely halophilic Archaea and Bacteria. FEMS Microbiol Ecol 39:1-7. Schleper C, Jurgens G and Jonuscheit M (2005) Genomic studies
of uncultivated archaea. Nat Rev Microbiol 3:479-488. Schloss PD and Handelsman J (2005) Introducing DOTUR, a
computer program for defining operational taxonomic units and estimating species richness. Appl Environ Microbiol 71:1501-1506.
Schwede T, Kopp J, Guex N and Peitsch MC (2003) SWISS-MODEL: An automated protein homology-modeling server. Nucleic Acids Res 31:3381-3385.
Shapiro BA, Yingling YG, Kasprzak W and Bindewald E (2007) Bridging the gap in RNA structure prediction. Curr Opin Struct Biol 17:157-165.
Sippl MJ (1993) Recognition of errors in three-dimensional struc-tures of proteins. Proteins 17:355-362.
Springer E, Sachs MS, Woese CR and Boone DR (1995) Partial gene sequences for the a subunit of methyl-coenzyme M reductase (mcrI) as a phylogenetic tool for the family Methanosarcinaceae. Int J Syst Bacteriol 45:554-559. St Louis VL, Kelly CA, Duchemin É, Rudd JWM and Rossenberg
DM (2000) Reservoir surfaces as sources of greenhouse gases to the atmosphere: A global estimate. BioScience 50:766-775.
Tamura K, Dudley J, Nei M and Kumar S (2007) MEGA4: Molec-ular Evolutionary Genetics Analysis (MEGA) Software ver. 4.0. Mol Biol Evol 24:1596-1599.
Teske A and Sørensen KB (2008) Uncultured archaea in deep ma-rine subsurface sediments: Have we caught them all? The ISME J 2:3-18.
Thauer RK (1998) Biochemistry of methanogenesis: A tribute to Marjory Stephenson. Microbiology 144:2377-2406. Thompson JD, Higgins DG and Gibson TJ (1994) CLUSTAL W:
alignment through sequence weighting, positions-specific gap penalties and weight matrix choice. Nucleic Acids Res 22:4673-4680.
Tilche A and Galatola M (2008). The potential of bio-methane as bio-fuel/bio-energy for reducing greenhouse gas emissions: A qualitative assessment for Europe in a life cycle perspec-tive. Water Sci Technol 57:1683-1692.
Tundisi JG (2007) Exploração do potencial hidrelétrico da Ama-zônia. Estudos Avançados 59:109-117.
Valentine DL (2007) Adaptations to energy stress dictate the ecol-ogy and evolution of the Archaea. Nat Rev Microbiol 5:316-323.
Wiederstein M and Sippl MJ (2007) ProSA-web: Interactive web service for the recognition of errors in three-dimensional structures of proteins. Nucleic Acids Res 35:407-410. Woese CR, Klanderi O and Wheelis ML (1990) Towards a natural
system of organisms: Proposal for the domains Archaea, Bac-teria, and Eucarya. Proc Nati Acad Sci USA 87:4576-457. Zehnder JB and Brock TD (1979) Methane formation and
meth-ane oxidation by methanogenic bacteria. J Bacteriol 137:420-432.
Internet Resources
BioEdit software, http://www.mbio.ncsu.edu/BioEdit/bioedit. html (January 18, 2007).
Brazilian Ministry for Mines and Energy - MME (2009) Resenha Energética Brasileira, exercício de 2008. http://www. mme.gov.br/mme/galerias/arquivos/
publicacoes/BEN/3_-_Resenha_Energetica_2008/Resenha _energetica_-_2008-V4_-_25-05-09.pdf.
NCBI’s BLAST tool, http://blast.ncbi.nlm.nih.gov/Blast.cgi (Oc-tober 25, 2007).
Protein Data Bank (PDB), http://www.rcsb.org/pdb/home (No-vember 20, 2007).
Swiss-Model Workspace, http://swissmodel.expasy.org/ (No-vember 15, 2007).
Supplementary Material
The following online material is available for this ar-ticle:
Table S1 - RMS values and percentage of identity be-tween the model e target structures.
Figure S1 - Ramachandran plots of the 3D structures. Figure S2 - The z-scores plots for the 3D structures. This material is available as part of the online article from http://www.scielo.br/gmb.
Associate Editor: Célia Maria de Almeida Soares