Short Report
S
Printed in Brazil - ©2012 Sociedade Brasileira de Química 0103 - 5053 $6.00+0.00*e-mail: [email protected]
Strategies to Improve Accuracy and Sensitivity in Phosphorus Determinations by
Inductively Coupled Plasma Quadrupole Mass Spectrometry
George L. Donati,* Renata S. Amais and Joaquim A. Nóbrega
Departamento de Química, Universidade Federal de São Carlos, CP 676, 13560-970 São Carlos-SP, Brazil
A interface de colisão e reação com He introduzido pelo skimmer a 100 mL min-1 é empregada
para melhorar a exatidão na determinação de 31P+ por ICP-QMS. A determinação de 31P16O+ em
plasma frio resulta em limites de detecção 55 vezes menores. Essa é uma alternativa interessante para elementos com altos potenciais de ionização como o P.
The collision/reaction interface with He introduced through the skimmer at 100 mL min-1 is
employed to improve accuracy in 31P+ determinations by ICP-QMS. The 31P16O+ determination
in cool plasma conditions result in limits of detection 55-fold lower. This strategy may be an interesting alternative for high ionization potential elements such as P.
Keywords: collision/reaction interface, dissociation energy, H2 reactivity, 31P16O+,
thermodynamics
Introduction
Inductively coupled plasma mass spectrometry (ICP-MS) is one of the most powerful techniques in modern analytical chemistry. Due to its high sensitivity and multi-element capabilities, ICP-MS has been used in different fields to solve important analytical problems.1-3 The
reduction of costs to acquire and maintain quadrupole-based instruments (ICP-QMS) and the increasing demand for fast, sensitive and robust methods have contributed to expand ICP-MS applications in the last decades. One of the most important limitations of ICP-MS is related to its relatively low resolution.4 Spectral overlap from polyatomic
ions formed by interactions among matrix, solvent, plasma and atmospheric species may compromise sensitivity and accuracy, frequently hindering ICP-QMS application to complex samples. Different approaches have been proposed to minimize the problem: from mathematical and chemical strategies to more instrumental ones (or a combination of those), all present potentialities and limitations.5-8
An interesting alternative to prevent ICP-QMS spectral interferences is to determine an analyte based on measurements of its oxide. By manipulating the plasma or the reaction cell conditions, it is possible to maximize the
oxide formation and improve sensitivity. Since a different, probably less prone to interferences mass-to-charge ratio (m/z) is monitored, the determination of oxide ions may also minimize spectral interferences. This strategy is especially useful for elements with high ionization potentials, such as P, and some works have demonstrated its effectiveness in different applications.9,10
More recently, Kalinitchenko et al.11 proposed promoting
physical-chemical interactions directly in the sampler or the skimmer cones as a simpler alternative to pressurized collision/reaction cells.8 In the collision/reaction interface
technology (CRI), He or H2 are introduced into the system through modified sampler and skimmer cones to promote interactions capable of destroying interfering species and improving accuracy in ICP-QMS determinations. This strategy has been successfully used for different analytes12
and it has potential for applications in combination with other spectral interference-reducing methods.13
In this work, the CRI technology and the determination of oxide species are evaluated to improve sensitivity and accuracy in P determinations. This is a challenging element in ICP-QMS because of its relatively high ionization potential (i.e., 10.5 eV)14 and its severe spectral
interferences. The main polyatomic ions interfering on P determinations at m/z 31 are 14N16OH+ and 15N16O+.15
digestions require HNO3,16 the difficulty of determining P
by ICP-QMS becomes evident. Different He and H2 CRI
flow rates are evaluated for P determinations at m/z 31 (31P+)
and 47 (31P16O+). Some preliminary results are presented
and physical-chemical aspects affecting the CRI efficiency in each case are discussed.
Experimental
Instrumentation
An inductively coupled plasma mass spectrometer equipped with a quadrupole mass analyzer and the CRI technology (ICP-QMS, 820-MS, Varian, Mulgrave, Australia) was used in all experiments. This instrument presents modified skimmer and sampler cones which allow the introduction of H2 or He directly into the
plasma/mass spectrometer interface. The CRI technology is complemented by a 90° angle design in which plasma source and mass spectrometer are positioned off axis to each other to reduce instrumental noise. Details on the instrument design and the CRI configuration can be found in the literature.11,17
The sample introduction system is composed of an automatic sampler (SPS3, Varian), a double pass, Scott-type spray chamber, and a concentric nebulizer. The mass-to-charge ratios (m/z) monitored were 31 and 47 for
31P+ and 31P16O+, respectively. Table 1 presents the ICP-QMS
operating conditions used in this work.
A closed-vessel microwave oven (Ethos 1600, Milestone, Sorisole, Italy) equipped with 45 mL PFA vessels was used for sample preparation.
Reagents, reference solutions and samples
Ultrapure HNO3 was produced using a sub-boiling
distillation apparatus (Milestone). This reagent was used to prepare all aqueous solutions and to digest the sample aliquots. Hydrogen peroxide 30% (m/m) was also used in the microwave-assisted acid digestion of the sample aliquots. Distilled-deionized water (18.2 MΩ cm, Milli-Q, Millipore, Bedford, MA, USA) was used as solvent in all experiments. Standard reference solutions of P were prepared by appropriated dilution of a 1000 mg L-1 stock
solution(Tec-Lab, Hexis, São Paulo, SP, Brazil). Freshly collected tap water was spiked with 1.0 mg L-1 P and used
as test solution to optimize the CRI conditions. A standard reference material (SRM 1548a, “Typical Diet”) from the National Institute of Standards and Technology (NIST, Gaithersburg, MD, USA) was used to check the method accuracy.
All polypropylene material was kept in 10% (v/v) HNO3
overnight and rinsed with distilled-deionized water before use to prevent contaminations. Liquid Ar and the CRI gases (He and H2) used in this work were 99.999% pure (White
Martins, Sertãozinho, SP, Brazil).
Sample preparation
Freshly collected tap water aliquots of 5 mL were spiked with P and diluted to 10 mL with distilled-deionized water to a final concentration of 1.0 mg L-1.
Typical Diet (NIST 1548a) aliquots of approximately 250 mg were accurately weighted directly in microwave PFA vessels and submitted to a pre-digestion period of 60 min with 2.5 mL of concentrated HNO3 (14 mol L-1)
without any external heating. Then, 2.5 mL of distilled-deionized water were added to the mixture and an additional pre-digestion period of 30 min at room temperature was observed. Finally, a volume of 3.0 mL of H2O2 30% (m/m)
was added and the mixture was digested in a closed-vessel cavity microwave oven (Milestone) using the heating program presented in Table 2. The resulting solutions were then allowed to cool down, transferred to 15 mL
Table 1. ICP-QMS operating conditions
Instrumental parameter Operating condition
Plasma gas flow rate / (L min-1) 18.0
Auxiliary gas flow rate / (L min-1) 1.8
Nebulizer gas flow rate / (L min-1) 0.94a
Sheath gas flow rate / (L min-1) 0.17
Peristaltic pump rate / rpm 6
Sampling depth / mm 5.5
RF power / kW 1.4a
Points per peak 3
Scans per replicate 3
Replicate per sample 5
Dwell time / ms 1a
First extraction lens / V – 1
Second extraction lens / V – 173
Third extraction lens / V – 247
Corner lens / V – 318
Mirror lens right / V 43
Mirror lens left / V 39
Mirror lens bottom / V 29
Entrance lens / V 0
Fringe bias / V – 2.5
Entrance plate / V – 27
aFor measurements at m/z 47, nebulizer flow rate, rf applied power and
polypropylene flasks, and diluted to a final volume of 10 mL with distilled-deionized water. Additional dilution was performed just before analysis to adjust the P concentration to the analytical calibration curve linear dynamic range.
Optimization of the CRI conditions
Different CRI flow rates were evaluated for He or H2
introduced through the skimmer or the sampler cones. For 31P+ determinations, He flow rates of 40, 60, 80 and
100 mL min-1 introduced through the skimmer, and of
500, 1000 and 1500 mL min-1 introduced through the
sampler were evaluated. Hydrogen gas introduced through the skimmer at 20, 40 and 60 mL min-1, and through
the sampler at 200, 1000 and 1500 mL min-1 was also
evaluated. For 31P16O+, determinations without the CRI
and with H2 flowing at 40 mL min-1 through the skimmer
were compared.
Results and Discussion
Determinations at m/z 31
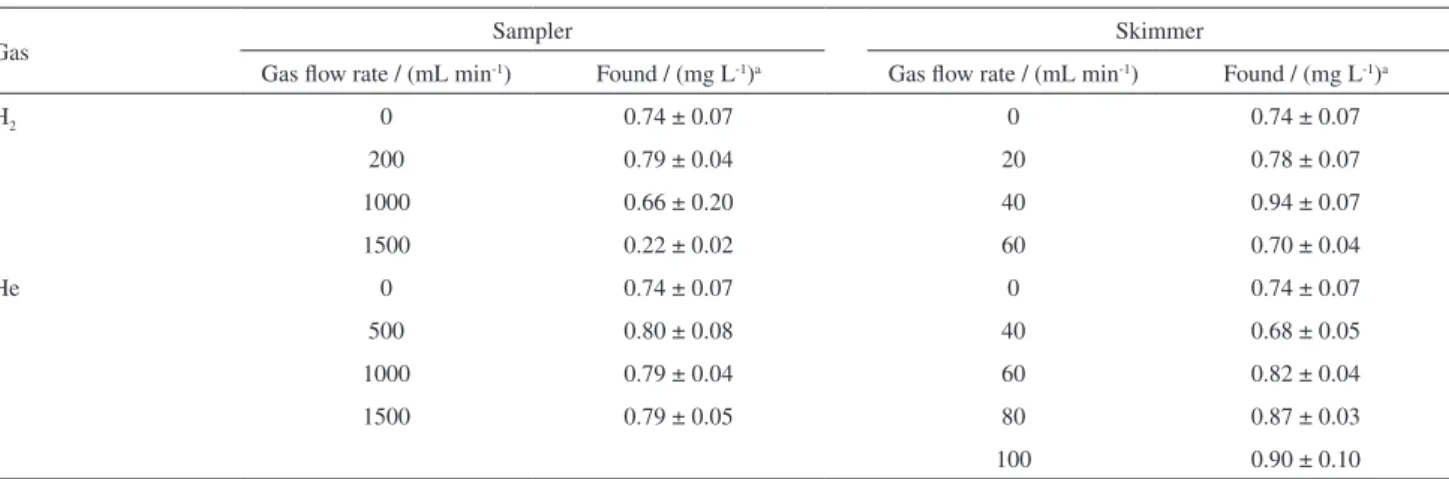
The CRI efficiency at reducing spectral interferences in 31P+ determinations was evaluated by comparing
recoveries obtained for a tap water sample spiked with 1.0 mg L-1 P in different He or H
2 flow rates. As observed
in previous works,11-13 the sampler cone interface was not
efficient and recoveries from 22 to 80% were obtained. For determinations using the skimmer cone interface, recoveries varied from 60 to 94%. Table 3 presents the results for He and H2 in different flow rates.
Based on these results, conditions presenting recoveries higher than 85%, i.e., He at 80 and 100 mL min-1, and H
2
at 40 mL min-1, were used to determine P in a standard
reference material (Typical Diet, NIST 1548a). The goal in this case was to check the method efficiency for a more complex matrix. No statistically significant difference at a 95% confidence level was observed between the certified value (3486 ± 245 mg kg-1) and the ones determined using
He at 80 or 100 mL min-1 in the skimmer cone (3960 ± 270
and 3350 ± 250 mg kg-1, respectively). On the other hand,
a lower accuracy was observed for determinations using H2 at 40 mL min-1 in the skimmer, i.e., 3010 ± 60 mg kg-1.
Kinetic and thermodynamic aspects must be considered while applying the CRI to minimize ICP-QMS spectral interferences. Helium is essentially used as a collision gas that may destroy interfering ions by collision induced dissociation (CID). However, it may only be efficient if the collision energy is higher than the interfering ion dissociation energy (Do).18 As previously demonstrated
by Kovacevic et al.,15 the main interfering ions affecting 31P+ determinations in HNO
3 medium are
14N16OH+ (65%
abundance) and 15N16O+ (32% abundance). By calculating
the collision energy in the center of mass between He and these ions (Ecm He/31 = 0.46 eV),19 and comparing it with
the dissociation energies (Do = 0.395 and 10.85 eV for
14N16OH+ and 15N16O+, respectively),14,19 one can assume
that the CRI on collision mode could only be effective at minimizing spectral overlap from 14N16OH+. Considering
Table 2. Heating program employed in the microwave-assisted sample digestion of Typical Diet
Step Applied power / W time / min Temperature / º C
1 250 2 80
2 0 3 80
3 550 4 120
4 650 5 180
5 750 5 200
Table 3. Effects of the CRI collision (He) and reaction (H2) modes on ICP-QMS accuracy for 31P+ determinations
Gas Sampler Skimmer
Gas flow rate / (mL min-1) Found / (mg L-1)a Gas flow rate / (mL min-1) Found / (mg L-1)a
H2 0 0.74 ± 0.07 0 0.74 ± 0.07
200 0.79 ± 0.04 20 0.78 ± 0.07
1000 0.66 ± 0.20 40 0.94 ± 0.07
1500 0.22 ± 0.02 60 0.70 ± 0.04
He 0 0.74 ± 0.07 0 0.74 ± 0.07
500 0.80 ± 0.08 40 0.68 ± 0.05
1000 0.79 ± 0.04 60 0.82 ± 0.04
1500 0.79 ± 0.05 80 0.87 ± 0.03
100 0.90 ± 0.10
the ICP-MS conditions and 15N low natural abundance (i.e.,
0.37%), it may be supposed that 14N16OH+ is the species
responsible for most significant spectral interferences, which could explain the adequate accuracies obtained for determinations using He in the skimmer cone.
It is important to note that the accuracy obtained in this work may also be related to more efficient sample matrix decompositions. It has been demonstrated that high residual carbon contents (RCC) can compromise accuracy in 31P+
determinations, probably due to a higher concentration of carbon-based interfering ions such as 12C18OH+.15 In a
previous work using the same standard reference material and the CRI on collision mode, poor accuracies were observed probably because no pre-digestion step was employed and digested sample solutions with higher RCCs were probably obtained.7 Considering 12C18OH+ as the main
carbon-based interfering ion in high RCC solutions,15 and
comparing Ecm He/31 and Do values (0.46 and 6.14 eV,
respectively),14,19 the reason for such poor accuracies7
becomes evident.
On the other hand, no kinetic data are available for reactions between H2 and either of these interfering ions.
20
In addition, reactions represented by equations 1-314,21
indicate that they are thermodynamically non-favorable since they are all endothermic. Therefore, as it would be expected and it is confirmed by the Typical Diet results, the CRI on reaction mode is not effective at improving accuracy in 31P+ determinations.
NO+ + H
2→ NOH
+ + H ∆H = 397.9 kJ mol-1 (1)
NOH+ + H
2→ NO + H3+ ∆H = 123.0 kJ mol-1 (2)
COH+ + H
2→ CO + H3
+ ∆H = 169.2 kJ mol-1 (3)
Determinations at m/z 47
As previously demonstrated in different works,9,10
the determination of P as PO+ at m/z 47 may be an
interesting alternative to improve sensitivity and minimize interferences in ICP-QMS analyses. The PO+ ion is readily
formed in the plasma as demonstrated in equation 4 (k = 8.70 × 10⁻¹⁰ cm3 s-1).22 Since this is an exothermic
reaction, its formation may be maximized by reducing the plasma temperature. This effect can be obtained by reducing the radio-frequency (rf) applied power and increasing the nebulizer gas flow rate (Table 1). It is interesting to note that a higher nebulizer gas flow rate can have a two-fold positive effect on maximizing the PO+ formation since
it may also increase the number of non-ionized water molecules available.
P+ + H
2O → PO+ + H2 ∆H = – 300.5 kJ mol-1 (4)
The efficiency of a method combining the CRI strategy and PO+ determination in cooler plasma conditions was
evaluated by analyzing recoveries in a tap water sample spiked with 1.0 mg L-1 P. Two aspects need to be considered
while using the CRI for oxide ion determinations: the analyte should present both high dissociation energy and limited reactivity with H2 so it is not destroyed in the
interface. Table 4 presents the dissociation energies for PO+ and its main interfering ions (i.e., 14N16O
2H+, 15N16O2+, 12C35Cl+, 13C18O16O+, and 12C18O16OH+),15 as calculated using
thermodynamic data from the literature.14 By comparing
these values with the collision energy in the center of mass between He and those species (Ecm He/47 = 0.31 eV),19 it can
be assumed that neither the analyte will be dissociated nor the CRI on collision mode will be effective at minimizing the main spectral interferences at m/z 47. The same reasoning may be applied for determinations using the CRI on reaction mode and by analyzing the energies involved in reactions represented by equations 5-10.14,21,23 Based
on these data and considering the sampler interface low efficiency,11-13 only two CRI conditions were evaluated for 31P16O+ determinations: H
2 at 0 or 40 mL min
-1 introduced
through the skimmer. The results for spiked tap water and Typical Diet are presented in Table 5. As expected, no accuracy improvements were observed by employing the CRI in each case.
PO+ + H
2→ POH
+ + H ∆H = 256.5 kJ mol-1 (5)
NO2H+ + H2→ NO2 + H3+ ∆H = 126.3 kJ mol-1 (6)
NO2 + + H
2→ NO2H
+ + H ∆H = 272.2 kJ mol-1 (7)
CCl+ + H
2→ HCl + HC+ ∆H = 167.6 kJ mol-1 (8)
CO2 + + H
2→ CO2H
+ + H ∆H = –148.8 kJ mol-1 (9)
CO2H+ + H2→ CO2 + H3+ ∆H = 144.21 kJ mol-1 (10)
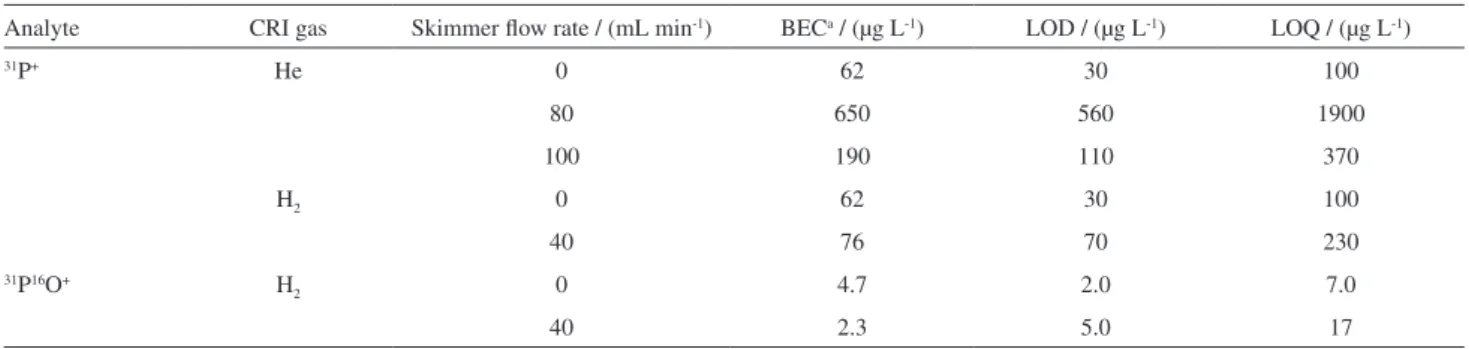
Limits of detection and quantification
The instrumental limits of detection (LOD) and quantification (LOQ) for different CRI conditions were calculated and compared with determinations without the CRI. The results are presented in Table 6. As it can be seen,
Table 4. Dissociation energies (Do) for PO+ and its main interfering ions
in ICP-QMS determinations at m/z 47
Ion Do / eV
PO+ 8.20
NO2H+ 1.70
NO2+ 1.91
CCl+ 6.84
CO2+ 5.36
significant improvements were obtained for determinations at m/z 47, probably due to lower background signals in a less energetic plasma. The LODs were calculated as 3 times the background equivalent concentration (BEC) multiplied by the relative standard deviation of twenty consecutive blank determinations (RSD, n = 20). The BEC was calculated by dividing the analyte concentration in one of the calibration curve points by its respective signal-to-background ratio (SBR). SBR is the net analytical signal divided by the blank signal.24 The LOQ as calculated as 10 times BEC
multiplied by RSD.
Conclusions
The collision/reaction interface can be effective at improving accuracy in ICP-QMS determinations. However, kinetic and thermodynamic aspects need to be considered while developing methods based on this technology. The CRI on collision mode may be effective for determinations involving interfering species with both low mass and low dissociation energies. Considering accuracy and limits of detection in 31P+ determinations, the introduction of
He at 100 mL min-1 through the skimmer is the most
recommended condition.
Monitoring PO+ in cool plasma conditions is an
interesting alternative to improve ICP-QMS sensitivity. Comparing this strategy with the optimized CRI method for 31P+, a 55-fold improvement in the LOD was obtained.
On the other hand, a larger number of interfering ions with
relatively high ionization energies and low reactivity with H2 can compromise both the CRI efficiency and the method
accuracy for determinations at the m/z 47.
Acknowledgments
The authors would like to thank the Fundação de Amparo à Pesquisa do Estado de São Paulo (FAPESP) for the grants and fellowships provided (2006/59083-9, 2010/50238-5, and 2010/17387-7). The support from the Instituto Nacional de Ciências e Tecnologias Analíticas Avançadas and Conselho Nacional de Desenvolvimento Científico e Tecnológico (INCTAA and CNPq) is also greatly appreciated.
References
1. Avula, B.; Wang, Y.; Duzgoren-Aydin, N. S.; Khan, I. K.; Food Chem.2011, 127, 54.
2. Sussulini, A.; Banzato, C. E. M.; Arruda, M. A. Z.; Int. J. Mass Spectrom.2011, 307, 182.
3. Oliveira, E. P.; Yang, L.; Sturgeon, R. E.; Santelli, R. E.; Bezerra, M. A.; Willie, S. N.; Capilla, R.; J. Anal. At. Spectrom.2011,
26, 578.
4. Becker, J. S.; Inorganic Mass Spectrometry: Principles and Applications; Wiley: Chichester, 2008.
5. Thomas, R.; Spectroscopy2002,17, 24.
6. Tanner, S. D.; J. Anal. At. Spectrom.1995, 10, 905.
7. Donati, G. L.; Amais, R. S.; Nóbrega, J. A.; J. Anal. At. Spectrom.2011, 26, 1827.
Table 5. Effects of using the CRI on reaction mode for 31P16O+ determinations
Sample Skimmer H2 flow rate / (mL min-1) Reference Founda
Spiked tap water / (mg L-1) 0 1.0 1.19 ± 0.02
40 1.16 ± 0.04
Typical Dietb / (mg kg-1) 0 3486 ± 245 4140 ± 150
40 4240 ± 150
aValues are the mean ± 1 standard deviation, n = 3. bNIST SRM 1548a.
Table 6. Limits of detection (LOD) and quantification (LOQ) for 31P+ and 31P16O+ determined with or without the CRI
Analyte CRI gas Skimmer flow rate / (mL min-1) BECa / (µg L-1) LOD / (µg L-1) LOQ / (µg L-1)
31P+ He 0 62 30 100
80 650 560 1900
100 190 110 370
H2 0 62 30 100
40 76 70 230
31P16O+ H
2 0 4.7 2.0 7.0
8. D’Ilio, S.; Violante, N.; Majorani, C.; Petrucci, F.; Anal. Chim. Acta2011, 698, 6.
9. Yang, C.; Jiang, S.; Spectrochim. Acta, Part B2004, 59, 1389. 10. Ciavardelli, D.; Sacchetta, P.; Federici, G.; Di Ilio, C.; Urbani, A.;
Talanta2010, 80, 1513.
11. Kalinitchenko, I.; Wang, X.; Sturman, B.; Spectroscopy2008,
23, 38.
12. Pereira, C. D.; Garcia, E. E.; Silva, F. V.; Nogueira, A. R. A.; Nóbrega, J. A.; J. Anal. At. Spectrom.2010, 25, 1763. 13. Fialho, L. L.; Pereira, C. D.; Nóbrega, J. A.; Spectrochim. Acta,
Part B2011, 66, 389.
14. National Institute of Standards and Technology, Chemistry WebBook, NIST Standard Reference Database. http://webbook. nist.gov/chemistry/form-ser.html accessed in October 2011. 15. Kovacevic, M.; Goessler, W.; Mikac, N.; Veber, M.; Anal.
Bioanal. Chem.2005, 383, 145.
16. Nóbrega, J. A.; Donati, G. L. In Encyclopedia of Analytical Chemistry; Meyers, R. A.; Bings, N. H., eds.; Wiley: Chichester,
2011.
17. Elliot, S.; Knowles, M.; Kalinitchenko, I.; Spectroscopy2004,
19, 30.
18. Bandura, D. R.; Baranov, V. I.; Tanner, S. D.; Fresenius J. Anal. Chem.2001, 370, 454.
19. Houk, R. S.; Praphairaksit, N.; Spectrochim. Acta, Part B2001,
56, 1069.
20. Anicich, V. G.; Astrophys. J. Suppl. S.1993, 84, 215. 21. Oka, T.; Proc. Natl. Acad. Sci. U.S.A. 2006, 103, 12235. 22. Thorne, L. R.; Anicich, V. G.; Huntress, Jr., W. T.; Chem. Phys.
Lett.1983, 98, 162.
23. Green, S.; Schor, H.; Siegbahn, P.; Thaddeus, P.; Chem. Phys. 1976, 17,479.
24. Thomsen, V.; Roberts, G.; Burguess, K.; Spectroscopy2000,
15, 33.
Submitted: November 22, 2011
Published online: February 2, 2012