Nota Técnica
*e-mail: [email protected]
HIGH PERFORMANCE THIN LAYER CHROMATOGRAPHIC DETERMINATION OF NIFEDIPINE IN HUMAN SERUM AFTER LIQUID-LIQUID EXTRACTION
Sigrid Mennickent*, Jonathan Contreras, Berta Schulz and Marta de Diego
Departamento de Farmacia, Facultad de Farmacia, Universidad de Concepción, P.O. Box 237, Concepción, Chile Mario Vega
Departamento de Bromatologia, Nutrición y Dietética, Facultad de Farmacia, Univerdidad de Concepción, P.O. Box 237, Concepción, Chile
Recebido em 11/5/11; aceito em 22/8/11; publicado na web em 30/9/11
A method using HPTLC for quantitation of nifedipine in serum was developed and validated. It includes a liquid-liquid extraction, and carbamazepine as internal standard. Chloroform: ethyl acetate: cyclohexane (19:2:2, v/v/v) was the mobile phase. The method showed good relationship (r = 0.996) (2.00 to 25.00 ng/band, corresponding to 0.02 and 0.25 ng/µL in serum). The % RSD of intra-assay and inter-assay, were between 0.57 and 3.56 and 1.16 to 3.60, respectively. LOD and LOQ were 0.72 and 0.86 ng/band, respectively. The recovery values were between 93 and 102%. Rf for nifedipine and carbamazepine were 0.31 and 0.10, respectively. Keywords: nifedipine; high performance thin layer chromatography; quantitative determination.
INTRODUCTION
Nifedipine is a 1, 4-dyhydropiridine-derivative calcium-channel blocking agent (Figure 1). Nifedipine is used alone or in combination with other classes of antihypertensive agents in the management of hypertension. Calcium-channel blockers, as nifedipine, are consi-dered one of several preferred antihypertensive drugs for the initial management of hypertension in patients with a high risk of develo-ping coronary artery disease, including those with diabetes mellitus. Nifedipine also may be used in the management of hypertension in patients with low-renin hypertension (as black patients), coexisting angina, peripheral vascular-disease, or isolated systolic hypertension, and in geriatric patients.
Other uses of nifedipine are in the management of Prinzmetal variant angina and chronic stable angina pectoris, Raynaud´s pheno-menom, and preterm labor.
About its pharmacokinetics, approximately of 90% of an oral dose of nifedipine is rapidly absorbed from the gastrointestinal tract and serum concentrations usually are reached within 0.5-2.0 h, after oral administration as conventional capsules. When the drug is administered as extended-release tablets, its bioavailability relative to conventional nifedipine capsules is about 84-89%. In patients with normal renal and hepatic function, the plasma half-life of nifedipine is about 2 h when administered as conventional capsules, and about 7 h when administered
as extended-release tablets. The drug is extensively metabolized in the liver, and 60-80% of an oral dose of nifedipine is excreted in the urine almost entirely as inactive metabolites.1-3 Following administration of
a single extended-release tablet under fasting conditions, mean peak plasma nifedipine concentrations of about 115 ng/mL were reported.2
Patient´s adherence to antihypertensive drug regimen is a com-plex but important factor in achieving blood pressure control and reducing adverse cardiovascular outcomes.4-20 Non-adherence to
antihypertensive medication is about 50% of patients,4-8,10,12-15,17 and
only one in three patients have controlled blood pressure.6,9 Across
the time, it was observed a slow continuous decline in persistence to pharmacotherapy compliance.10,12,13,15 Patient´s non-adherence to
medications has been attributed to both intentional (i.e, a conscious decision not to take medications) and unintentional (i.e, failure to take medications due to poor understanding or forgetfulness) reasons.17
The more common ways to evaluate the adherence of the patients with their medication are questionnaires about the daily administra-tion of the drug, and pill counts, with the problem that the results can be true or false.21-27 Determination of drug levels in biological
fluids can be a useful tool to evaluate pharmacotherapy adherence by relating the serum or plasma levels of drugs with compliance.1-3
Patient with hepatic and/or renal damage can be exclude from the study, because these conditions are related with a lower drug excretion and, therefore, with higher plasmatic concentrations.
For determination of nifedipine in blood, some methods using HPLC,28-35 voltammetry36-38 and spectrophotometry39,40 have been
reported.
No method was found in the literature for analysis of this drug in blood using HPTLC.
High performance thin layer chromatography (HPTLC) is a techni-que carried out within a short period of time, as allows for the analysis of a large number of samples simultaneously. Therefore, the principal advantage of HPTLC is a fast analysis, with a high selectivity, accu-racy, sensitivity (nanograms in UV absorbance mode and picograms in fluorescence mode) and precision.41 Authors have performed some
works using HPTLC for quantitative determination of drugs in biolo-gical fluids,42-45 and in dosage forms,46-51 with exact and reliable results.
determination of nifedipine in human serum, suitable for medication adherence studies.
EXPERIMENTAL
Material
Apparatus
A Camag (Muttenz, Switzerland) HPTLC system was used, consisting of a TLC Scanner 3, equipped with software winCATS 1.4.2; automatic TLC Sampler 3; vertical twin trough chambers 10 x 10 and 10 x 20 cm and HPTLC plates precoated with silica gel F 254 Merck (Darmstadt, Germany).
Other instrumentations used were WLW Centrifuge (Germany), Heidolph shaker Metrohm (USA), and Reacti-Vap evaporator Thermo Fisher Scientific (Waltham, MA, USA).
Chemicals and reagents
United States Pharmacopeia (USP) standards of nifedipine and carbamazepine (as internal standard) (Figure 2), with a purity grade of 94% each, were obtained from Sigma-Aldrich Chemicals (St. Louis, MO). Chloroform, ethyl acetate, cyclohexane and ethanol were obtained from Merck (Darmstadt, Germany). All chemicals and reagents were of analytical grade.
Methods
Standard solutions
Nifedipine was dissolved with chloroform:ethanol (8:1, v/v), in dark, to obtain a stock solution of 1.00 mg/mL. Later, blank serum samples were spiked with this solution, to obtain final concentrations of 0.02 to 0.25 ng/µL of nifedipine. Working solutions were prepared at concentrations of 0.02, 0.05, 0.10, 0.15, 0.20 and 0.25 ng/µL, and quality control samples52 were prepared at concentrations of
0.02-0.10 and 0.25 ng/µL.
The solutions were protected from light with an aluminum foil wrapping and usually freshly prepared solutions were used.
The internal standard, carbamazepine, was added to serum prior to analysis by pipeting 20 µL of a solution of 50 ng/µL into 2 mL of blank serum.
Drug-free serum used for the validation of the method was obtai-ned from healthy volunteers. Serum collected was stored at -20 ºC. Serum samples
Six patient volunteers who were using nifedipine (30-60 mg once daily) as treatment for hypertension participated in this study. The samples were heated at 37 ºC and later centrifuged to obtain serum. The serum samples were frozen at -20 ºC pending analysis (about 2 days). The sampling was carried out under extremely subdued light and all tubes and syringes were wrapped in aluminum foil because of the photolability of nifedipine.
The volume of serum used was 2 mL. Unknowns were applied as bands 3 times and references were applied as bands 2 times, each, and distribution of bands was done accordingly the data pair method. Standards used were at concentrations of 0.02, 0.10 and 0.25 ng/uL.
Extraction procedure
For preparation of samples for chromatography, a 20 µL aliquot of the internal standard carbamazepine (50 ng/µL) was added to 2 mL of spiked serum, and vortex-mixed. The sample was then aci-dified by addition of 100 µL of 7M HClO4, vortex mixed, and later
4 mL of the extraction solvent mixture dichloromethane: n-hexane (30:70, v/v) was added. This mixture was vortex-mixed for 1 min and then centrifuged for 10 min at 6000 rpm. The organic layer was transferred to another glass tube and the contents were evaporated to dryness at room temperature under a gentle stream of pure nitrogen. The residue was reconstituted in 200 µL of chloroform:ethanol (8:2, v/v). An aliquot of 10 µL of this solution was spotted for analysis. All the procedure was accomplished under safety conditions and with the needed precautions because the stability of nifedipine.
Chromatography
Chromatography was carried out on HPTLC glass backed plates 10 x 10 cm and 20 x 10 cm precoated with silica gel F 254, layer thickness 0.2 mm Merck (Darmstadt, Germany), previously washed with methanol and activated at 120 ºC during 20 min.
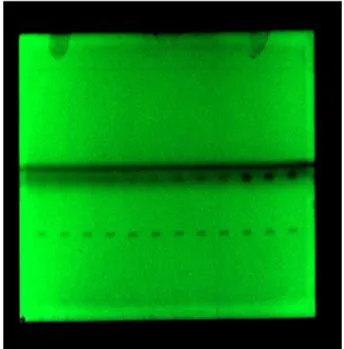
Sample application was done on 4 mm bands. The mobile phase consisted of chloroform:ethyl acetate:cyclohexane (19:2:2, v/v/v). The migration distance was 8 cm and the migration time 12 min. Chromatographic chambers were previously saturated with solvent mixture for 20 min. Densitometry readings were carried out using the Camag system described before, and with a deuterium lamp as the ra-diation source. Determinations were performed at a wavelength of 238 nm. Figure 3 shows a HPTLC plate with the developed spiked bands.
RESULTS AND DISCUSSION
Method optimization
The chromatographic conditions were arrived at after investiga-ting several parameters, such as detection wavelength, ideal mobile Figure 2. Chemical structure of carbamazepine
phase and their proportions, internal standards, and optimal conditions for sample extraction.
The best mobile phase was a mixture of chloroform:ethyl acetate:cyclohexane (19:2:2, v/v/v), which provided optimum sensi-tivity and adequate separation of sharp peaks (Rf for nifedipine ad the
internal standard carbamazepine were 0.31 and 0.10, respectively). Some wavelengths were tried, and 238 nm was selected as working wavelength. Complete resolution of the peaks with clear baseline separation was obtained of this way.
Calibration curves
Calibration curves were constructed using peak-area ratio for the nifedipine and the internal standard carbamazepine as a function of the concentration added. The linear range was between 0.02-0.25 ng/ µL which corresponded to 2.00 and 25 ng/band, respectively, after the extraction process and applying 10 µL to the chromatographic plates. Each solution was applied as bands 3 times. Solutions of concentration of 0.02, 0.05, 0.10, 0.15, 0.20 and 0.25 ng/uL were analyzed. This range of solution concentrations include the nifedi-pine concentration expected in serum (115 ng/mL = 0.115 ng/µL).2
Standard curves were constructed by plotting the peak area ratio of the analyte to the internal standard.
The calibration curves (n=5) of nifedipine were described by: y = 5464.6 x (± 0.1) x – 56.504 (±0.1) with a correlation coefficient,
r = 0.996.
Precision and accuracy
Quality control samples spiked at three concentrations (0.02-0.10 and 0.25 ng/µL) were used to assess precision and accuracy of the method. Three replicates each were prepared and each replicate was applied as bands three times. Inter-assay precision and inter-assay accuracy were calculated after repeated analysis in three different analytical runs. Each experiment included the sample extraction step.
Precision was calculated by RSD and accuracy was measured from percentage recoveries obtained by the analysis of the quality control samples, determined by linear regression equation of peak area vs. drug concentration.
The accuracy and precision did not exceed 4.25% of RSD at any level. Precision criteria for an assay method for drugs in biological fluids are that the precision will be 5 to 10% (RSD).53-55
The results are presented in Tables 1 and 2.
Detection and quantification limits
Serum spiked with nifedipine standard to obtain concentrations of 0.01-0.02 and 0.05 ng/µL were used to calculate the limit of detection (LOD) and limit of quantification of the method.
LOD was 0.72 and LOQ was 0.86 ng/band, respectively,
deter-mined using the equations:56 LOD = 3.3 σ/b; LOQ = 10 σ/b, where
σ is the standard deviation of the responses, and b corresponds to the slope obtained from the curve peak area versus concentration of the analyte. These values were experimentally verified.
Selectivity
The selectivity of the method was examined by preparing and analyzing checked by analyzing human serum samples spiked with nifedipine and the internal standard carbamazepine.
Moreover, three independent blank human serum samples were checked for any interfering peaks. No interference was observed.
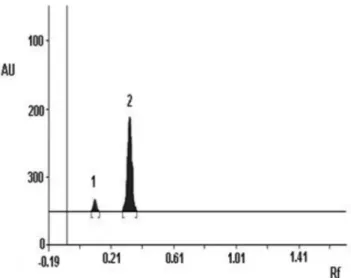
Nifedipine and carbamazepine were well separated under the HPTLC conditions applied. Resolution (RS) between both peaks
was 3.08 (Rf carbamazepine = 0.10; Rf nifedipine = 0.31) (Figure 4).
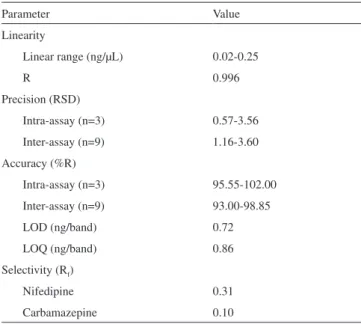
Table 3 summarized all of validated values.
Application of the method
The nifedipine concentration ranged between 0.07 and 0.23 ng/ µL. Nifedipine plasma concentration of 115 ng/mL (0.115 ng/µL) is described in literature following administration of a single extended-release tablet under fasting conditions.2
Table 2. Method accuracy
Actual concentration
(ng/µL)
Measured concentration
(ng/µL) a
Accuracy, % b RSD, %
Intra-assay (n=3)
0.020 0.047 ± 0.0017 95.55 3.68 0.100 0.098 ± 0.0035 98.90 3.56 0.250 0.255 ± 0.0063 102.00 2.45
Inter-assay (n=9)
0.020 0.047 ± 0.0020 93.00 4.20 0.100 0.098 ± 0.0042 97.37 4.25 0.250 0.344 ± 0.0128 98.85 3.73 aEach value is the mean ± standard deviation. bFounded concentration/added concentration x 100. cRelative standard deviation.
Table 1. Precision of the method
Concentration (ng/µL)
Relative standard deviation (RSD), % Intra-assaya Inter-assayb
0.02 3.56 3.60
0.10 1.96 2.44
0.25 0.57 1.16
an= 3; analyzed on the same day (three solutions of each concentration); bn= 9; analyzed on three different days (three solutions of each concentration prepared for 3 days)
Figure 4. Separation between nifedipine peak and the internal standard carbamazepine peak. 1º peak: carbamazepine; 2º peak: nifedipine. Axis X:
CONCLUSIONS
The method was sensitive enough to detect a quantity as low as 0.72 ng/band and the linear range was between 0.02-0.25 ng/µL which corresponded to 2.00 and 25 ng/band, respectively, after the extraction process and applying 10 µL to the chromatographic plates. This range includes serum concentration found in literature (0.115 ng/µL ≈ 0.11 g/µL). Both accuracy and precision values were very
acceptable, and the peaks of nifedipine and of the internal standard carbamazepine were well resolved. Liquid-liquid extraction yields a good recovery of nifedipine from serum.
No other method using HPTLC was found in the literature, for the quantification of nifedipine in human serum neither in human plasma. The analysis is fast, and the method allows a large number of samples to be measured simultaneously. This method can be reliably applied to drug adherence evaluation.
ACKNOWLEDGMENTS
The authors would like to thank the Research Council at the University of Concepción (Projects DIUC nº 208.074.041-1.0 and nº 208.074.040-1.0).
REFERENCES
1. Mc Evoy, G.; AHFS Drug Information, 51th ed., American Society of Health- System Pharmacists: Bethesda, 2009.
2. Hardman, J.; Limbird, L.; Las Bases Farmacológicas de la Terapéutica, 10th ed., Mc Graw-Hill: México, 2003.
3. S w e e t m a n , S . ; M a r t i n d a l e, G u í a C o m p l e t a d e C o n s u l t a
Farmacoterapéutica, 34th ed., Pharma Editores S.L.: Barcelona, 2003.
4. Benson, J.; Britten, N.; BMJ 2002, 325.
5. Marentette, M. A.; Gerth, W. C.; Billings, D. K.; Zarnke, K. B.; Can. J.
Cardiol. 2002, 18, 649.
6. Krousel-Wood, M.; Thomas, S.; Muntner, P.; Morisky, D.; Current
Opinion in Cardiology 2004, 19, 357.
7. Wogen, J.; Krelick, C. A.; Livornese, R. C.; Yokoyama, K.; Frech, F.; J.
Manag. Care Pharm. 2004, 10, 88.
8. Degli, E.; Sturani, A.; Di Martino, M.; Falasca, P.; Novi, M. V.; Baio, G.; Buda, S.; Volpe, M.; J. Hum. Hypertens. 2002, 16, 439.
9. Ren, X. S.; Kazis, L. E.; Lee, A.; Zhang, H.; Miller, D.; J. Clin. Phar. Ther. 2002, 27, 47.
10. Conlin, P. R.; Gert, W. C.; Fox, J.; Roehm, J. B.; Bocuzzi , S. J.; Clin.
Ther. 2001, 23, 1999.
11. van Wijk, B. L.; Klungel, O. H.; Heerdink, E. R.; de Boer, A.;
Pharma-coepidemiol. Drug Saf. 2006, 15, 587.
12. van Wijk, B. L.; Klunge, O. H.; Heerdink, E. R.; de Boer, A.; J. Hyper-tens. 2005, 23, 2101.
13. Wang, P. S.; Bohn, R. L.; Knight, E.; J. Gen. Intern. Med. 2002, 1, 504. 14. Breekveldt-Postma, N. S.; Penning-van Bees, F. J.; Siiskonen, S. J.;
Falvey, H.; Vincze, G.; Klungel, O. H.; Herings, R. M.; Curr. Med. Res. Opin. 2008, 24,121.
15. Bloom, B. S.; Clin. Ther. 1988, 20, 671.
16. Fitz-Simon, N.; Bennett, K.; Feely, J.; Ther. Clin. Risk Manag. 2005, 1, 93.
17. Bokhour, B.; Berlowitz, D.; Long, J.; Kressin, N.; J. Gen. Intern. Med. 2006, 221, 577.
18. Johnell, K.; Rastam, L.; Lithman, T.; Sundquist, J.; Merlo, J.; BMC
Public Health 2005, 5, 1471.
19. Kidd, K. E.; Altman, D. G.; Control Clin. Trials 2000, 2,184S. 20. Dolder, C.; Furtek, K.; Lacro, L.; Jeste, D.; Psychosomatics 2005,
46,135.
21. Osterberg, L.; Blaschke,T.; Drug Therapy 2005, 353, 487.
22. Cantrell, C. R.; Eaddy, M. T.; Shah, M. B.;Regan, T. S.; Sokol, M. C.;
Med. Care 2006, 44, 300.
23. Aikens, J.; Nease, D.; Nau, D.; Klinkman, M.; Schwenk, T.; Ann. Fam. Med. 2005, 3, 23.
24. Jukic, V.; Coll. Antropol. 2003, 27, 119.
25. Mushlin, A. I.; Appel, F. A.; Arch. Intern. Med 1977, 137, 318. 26. Payne, K. A.; Esmonde-White, S.; Curr. Hypertens. Rep. 2000, 2, 515. 27. Choo, P. W.; Rand, C. S.; Inui, T.S .; Med. Care 1999, 37, 846. 28. Tamaki, W.; Hiroyoshi, N.; Hitoshi, N.; Shigeru, O.; Mitsukazu, K.;
Japan JTDM 1999, 16, 358.
29. Zaater , M.; Hasan, E.; Najib, N.; Pol. J. Pharmacol. 2000, 52, 307. 30. Gil-Agusti , M. T.; Carda-Broch, S.; Monferrer-Pons, L. I.;
Esteve-Romero, J. S.; Biomed. Chromatogr. 2005, 20, 154.
31. Aboud-Auda, S. H.; Najjar, T. A.; Al-Khamis, K. I.;Al-Hadiya, B. M.; Ghilzai, N. M.; Al-Fawzan, N. F.; J. Pharm. Biomed. Anal. 2000, 22, 241.
32. Wang, X. D.; Lim, J. L.; Lu, Y.; Chen, X.; Huang, M.; Chowbay, B.; Zhou, S. F.; J. Chromatogr., B: Anal. Technol. Biomed. Life Sci. 2007,
852, 534.
33. Shah, S. A.; Savale, S. S.; Rathod, I. S.; Shishoo, C. J.; Ind. J. Pharm. Sci. 1999, 61, 81.
34. Kowalczuk, D.; Wawrzycka, M. B.; Maj, A. H.; JAOAC 2006, 89, 71. 35. Guo, Y.; Dai, J.; Qian, G.; Guo, N.; Ma, Z.; Guo, X.; Int. J.
Pharmaceu-tics 2007, 341, 91.
36. Madhusudana, R. T.; Jayarama, R. S.; Anal. Lett. 2004, 37, 2079. 37. Ghoneim, M. M.; Tawfik, A.; Khatashaba, P. Y .; Anal. Bioanal. Chem.
2003, 375, 369.
38. Ozaltin, N.; Yardimci, C.; Suslu, I .; J. Pharm. Biomed. Anal. 2002, 30, 573.
39. Rahman, N.; Ahmad Khan, A.; Hejaz Azmi, N.; Il Farmaco 2004, 55, 47.
40. Alagar Raja, M.; Selva Kumar, D.; Muthu Kumar, S.; Purnina, T.; Int. J.
Res. Pharm. Sci. 2010, 1, 20.
41. Wilson, I.; Ther. Drug Monit. 1996, 18, 484.
42. Mennickent, S.; Sobarzo, A.; Vega, M.; Godoy, C. G.; de Diego, M.; J.
Sep. Sci. 2007, 30, 2167.
43. Mennickent , S.; Vega, M.; Godoy, C. G.; J. Chil. Chem. Soc. 2003, 48, 71.
44. Mennickent, S.; Fierro, R.; Vega, M.; de Diego, M.; J. Sep. Sci. 2009,
32, 1454. Table 3. Results of method validation
Parameter Value
Linearity
Linear range (ng/µL) 0.02-0.25
R 0.996
Precision (RSD)
Intra-assay (n=3) 0.57-3.56 Inter-assay (n=9) 1.16-3.60 Accuracy (%R)
Intra-assay (n=3) 95.55-102.00 Inter-assay (n=9) 93.00-98.85 LOD (ng/band) 0.72 LOQ (ng/band) 0.86 Selectivity (Rf)
Nifedipine 0.31
45. Mennickent, S.; Sobarzo, A.; Vega, M.; de Diego, M.; Godoy, C. G.; Rioseco, P.; Saavedra, L.; IJPCP 2010, 14, 41.
46. Mennickent, S.; Vega, M.; Godoy, C. G.; Yates, T.; Bol. Soc. Chil. Quim. 2000, 45, 615.
47. Mennickent, S.; Yates, T.; Vega, M.; Godoy, C. G.; Saelzer, R.; Rev. Med.
Chile 2002, 130, 409.
48. Mennickent, S.; Pino, L.; Vega, M.; Godoy, C. G.; de Diego, M.; J. Sep. Sci. 2007, 30, 772.
49. Mennickent , S.; Pino, L.; Vega, M.; de Diego, M.; J. Sep. Sci. 2007, 31, 201.
50. Mennickent, S.; Nail, M.; Vega, M.; de Diego, M.; J. Sep. Sci. 2007, 30, 1893.
51. Mennickent, S.; Contreras, J.; Reyes, C.; Vega, M.; de Diego, M.; J.
PLanar Chromatogr. 2010, 23, 75.
52. Food and Drug Administration; Guidance for Industry. Bioanalytical
Method Validation, U. S. Department of Health and Human Services,
Food and Drug Administration, USA, 2001. 53. Shabir, G.; J. Chromatogr., A 2003, 987, 57.
54. Quattrochi, O.; Abelaira, S.; Laba, R.; Introducción a la HPLC:
Aplica-ción y práctica, 1a ed., Artes Gráficas Farro: Buenos Aires, 1992.
55. Daniel, W.; Bioestadística. Base para el Análisis de las Ciencias de la
Salud, 5a ed., Uteha Noriega Editores: México, 1996.
56. The United States Pharmacopeia;U. S. Pharmacopeial Convection Inc.,