Article
J. Braz. Chem. Soc., Vol. 25, No. 2, 271-281, 2014. Printed in Brazil - ©2014 Sociedade Brasileira de Química 0103 - 5053 $6.00+0.00
A
*e-mail: [email protected]
A Validation Method Development for Simultaneous LC-ESI-TOF/MS Analysis of
Some Pharmaceuticals in Tangkas River-Malaysia
Fouad F. Al-Qaim,a,b Md P. Abdullah,*,a,c Mohamed R. Othman,a,c Jalifah Latipa and Wan Afiqa
aSchool of Chemical Sciences and Food Technology, Faculty of Science and Technology,
Universiti Kebangsaan Malaysia (UKM), 43600 Bangi, Selangor, Malaysia
bDepartment of Chemistry, Faculty of Sciences for Women, Babylon University, P.O. Box 4, Hilla, Iraq
cCentre for Water Research and Analysis (ALIR), Faculty of Science and Technology,
Universiti Kebangsaan Malaysia (UKM), 43600 Bangi, Selangor, Malaysia
Fármacos são substâncias químicas sintéticas ou naturais que podem ser encontrados em medicamentos de prescrição médica, drogas terapêuticas isentas de prescrição e medicamentos veterinários. A ocorrência de fármacos no meio ambiente e no ciclo da água em quantidades vestigiais (na faixa de nanogramas a poucos microgramas por litro) tem sido amplamente discutida na literatura na década passada. O aumento na frequência de detecção é em grande parte atribuída aos avanços nas técnicas analíticas e instrumentação. Este artigo descreve o desenvolvimento, otimização e validação de um método de análise simultânea de sete produtos farmacêuticos de diferentes classes cafeína (CAF), prazosina (PRZ), maleato de enalapril (ENL), carbamazepina (CBZ), nifedipina (NFD), levonorgestre l (GNL), sinvastatina (SMV) utilizando extração em fase sólida (SPE cartuchos Oasis HLB ) seguido por cromatografia líquida acoplada a espectrometria de massas com tempo de voo e ionização por electrospray (LC-ESI-TOF/MS). A faixa linear de calibração, 0,5-250 µg L-1, proporcionou coeficientes de correlação linear (R2) acima de 0,99 para todos os compostos. Os limites de quantificação instrumental (IQL) para todos os produtos farmacêuticos variou de 0,5-5 µg L-1 no solvente por injeção direta de uma mistura padrão. A eficiência de extração (EE%), para a maioria dos compostos, foi superior a 40 e 60%, em água de rio e em água pura, respectivamente. O limite de quantificação (LOQ) para todos os produtos farmacêuticos variou de 13-800 ng L-1 para água de rio. A precisão inter e intra dia do método foi calculado, como o desvio-padrão relativo (RSD%) de 2,33-22,3% e 0,6-9,9% , respectivamente, exce to para a cafeína, que apresentou um RSD% de 20,1% a 50 µg L-1. O efeito da matriz variou entre 10-41%. Dos sete produtos farmacêuticos, seis compostos farmacêuticos foram detectados naamostra de água de rio.
Pharmaceuticals are synthetic or natural chemicals that can be found in prescription medicines, over-the-counter therapeutic drugs and veterinary drugs. The occurrence of pharmaceuticals in the environment and the water cycle at trace levels (in the range of nanograms to low micrograms per litre) has been widely discussed and published in literature in the past decade. The increase in detection is largely attributable to the advances in analytical techniques and instrumentation. This paper describes development, optimisation and validation of a method for the simultaneous analysis of 7 multi-class pharmaceuticals (caffeine (CAF), Prazosin (PRZ), enalapril maleate (ENL), carbamazepine (CBZ), nifedipine (NFD), levonorgestrel (LNG), simvastatin (SMV)) using solid phase extraction (SPE cartridges Oasis HLB) followed by liquid chromatography-time-of-flight/mass spectrometry (LC-ESI-TOF/MS). Its linearity, 0.5-250 µg L–1, provided determination coefficients (R2) above 0.99 for all compounds. The Instrumental Quantification Limits (IQLs) for all pharmaceuticals ranged from 0.5-5 µg L–1 in the solvent as a standard mixture (i.e., direct injection). The extraction efficiency (EE%) was more than 40% and 60% in river and deionised water for most of compounds, respectively. Limit of quantification (LOQ) for all pharmaceuticals ranged from 13-800 ng L –1 in spiked river water. The inter and intra day precision of the method, calculated as the relative standard deviation (RSD%), 2.33-22.3% and 0.6-9.9%, respectively, except for caffeine, which has a RSD% of 20.1% at 50 µg L−1. Matrix effect was investigated and ranged from 10-41%. Out of seven pharmaceuticals,
six pharmaceutical compounds were detected in the river water sample.
Introduction
The presence of residues of pharmaceutically active compounds in aquatic environments is considered an emerging environmental issue because of their detection in sewage treatment plants (STPs), hospital effluent, and surface, ground and drinking water in various countries.1-3
These residues are introduced into the aquatic environment from numerous several sources, such as insufficiently treated sewage and hospital effluents, improper disposal of expired medications and unused drugs, land fill leachates and accidental spillage during manufacturing and distribution.4-6
Several instruments have been used to analyse pharmaceutical residues in water samples. Liquid chromatography - tandem mass spectrometry [LC-MS/MS] is one of the most popular analytical methods used to analyse pharmaceutical residues and their metabolites due to its versatility, specificity and selectivity.7-9
Different approaches have been tried, including liquid chromatography - time of flight/mass spectrometry [LC-TOF/MS], gas chromatography-mass spectrometry (GC-MS),LC-MS, voltammetry, potentiometry and LC-Uv.10-18
Although environmental applications are still scarce, several authors have reported on the application of
LC-Q-TOF for the screening, confirmation and quantitative analysis of target environmental contaminants, such as pharmaceuticals phenols and pesticides. SPE is widely used in concentration step of sample preparation in the determination of contaminants (e.g., pesticides and pharmaceuticals) from environmental water samples. Depending on the choice of sorbent, a wide range of polarities and chemical classes may be covered.19
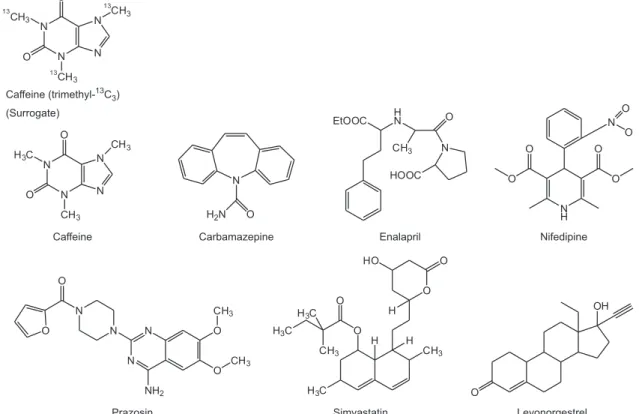
The compounds studied belong to the groups of calcium channel blockers (nifedipine), reninangiotensin (enalpril), lipid modifying agent (simvastatin), antiepileptics (carbamazepine), antihypertensive (prazosin), sex hormones (levonorgestrel) and nervous system stimulant (caffeine). The structures for all compounds are given in Figure 1.
Occurrence of human pharmaceuticals pollution in Malaysian environment has never been studied before except of very few studies;5 therefore conducting such
study is crucial to have primary information about the pollution status in Malaysia. This study is the first study investigating human pharmaceuticals and synthetic hormones in Tangkas River, Malaysia. Tangkas River is a tributary of Langat River, a main river in the distinct of Hulu Langat in the state of Selangor, Malaysia. The river flows through settlement areas of residential, schools and restaurants. The pharmaceuticals as listed in Table 1 were
selected on the basis of their consumption in Malaysia20
and environmental occurrence and persistency reported in previous studies.
In the light of these concerns, the objective of the work is to develop a new, fast, selective and sensitive analytical method for detection and quantification of a broad range of pharmaceuticals in terms of polarity in river water.
The method is based on a single SPE extraction protocol for small sample volume of 100 mL for fast sample preparation followed by LC-ESI-TOF/MS instrument analysis with 16.1 min total run time despite of using long column 250 mm with i.d. 5 µm.
Several key points, such as optimization of collision energy and elution solvent for extraction to enhance the quantitative analysis in terms of signal-to-noise ratio (S/N ratio) were discussed.
Experimental
Chemicals and reagents
The pharmaceuticals studied were: nifedipine (CAS: 21829-25-4), enalapril maleate (CAS: 76095-16-4), prazosin (CAS: 19237-84-4), caffeine (CAS: 58-08-2), levonorgestrel (CAS: 797-63-7), carbamazepine (CAS: 298-46-4) and simvastatin (CAS: 79902-63-9). All pharmaceuticals standards were of analytical grade (> 99%) and purchased from Sigma-Aldrich (USA). Isotopically labelled compound, used as surrogate and internal standard, was [caffeine 13C
3] obtained from
Sigma-Aldrich (USA). Deionised water (DIW) used was supplied by EASYPure RODI (USA). HPLC-grade methanol (MeOH), HPLC-grade acetonitrile (ACN), HPLC grade acetone and formic acid (FA) were supplied by Merck (Germany). Ethyl acetate was supplied by J. T. Baker (USA).
The cartridges used for solid phase extraction (SPE) were Oasis HLB (3cc, Waters, USA). Individual stock
standard solutions (1000 mg L–1) were prepared in
HPLC-grade methanol and stored at –18 °Cto minimise the degradation of the standard. A mixture of all pharmaceutical standards was prepared by appropriate dilution of the individual stock solutions. Further dilutions of this mixture were prepared in 0.1% FA in (MeOH-DIW (10:90, v/v)) before each analytical run and were used as the working standard solutions.
Sampling and sample preparation
Samples are collected from Tangkas River, it is located in Kajang, a city in Selangor, Malaysia. Tangkas River is downstream of a main medicinal centre in this area. Samples were collected in March 2013 and there was no rain for at least two days prior to samples collection. All samples were collected in 1 L amber glass bottles using a Nylon polymer bucket previously rinsed with distilled water and methanol. The samples were vacuum filtered through 0.7 µm GF/F glass fiber filter and stored at 4 °C to minimize degradation of pollutants until SPE extraction.
SPE of samples was carried out with a 10-sample GAST SPE vacuum manifold (DOA-P504-BN, USA). The SPE protocol was optimized through several experiments involving the following variables, sample loading flow rate, elution solvent, kind of SPE sorbent, sample size and the final solvent to reconstitute of analytes after drying (stream of nitrogen). In the light of the results of these preliminary trails, for further experiments, we select 9 mL min–1, 5 mL of ethyl acetate, 3cc HLB Oasis
cartridges, 100 mL of sample and 0.1% FA in MeOH-DIW (10:90, v/v) as a final solvent to reconstitute the analytes before injection.
The extraction efficiency of the target analytes from sample studied at two pHs, the cartridges were Oasis HLB, tested at neutral pH (without pH adjustment, pH = 7.2) and pH 2.5 using 1 mol L–1 HCl. The cartridges were
preconditioned with 2 mL of ethyl acetate, 2 mL of MeOH
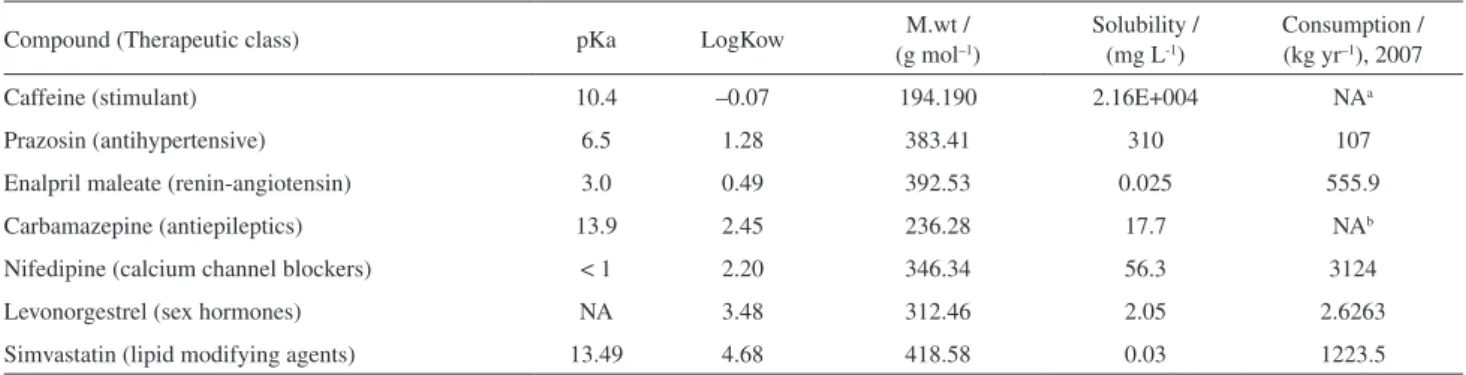
Table 1. Physico-chemical properties of all target pharmaceuticals compounds20-23
Compound (Therapeutic class) pKa LogKow M.wt /
(g mol–1)
Solubility / (mg L-1)
Consumption / (kg yr–1), 2007
Caffeine (stimulant) 10.4 –0.07 194.190 2.16E+004 NAa
Prazosin (antihypertensive) 6.5 1.28 383.41 310 107
Enalpril maleate (renin-angiotensin) 3.0 0.49 392.53 0.025 555.9
Carbamazepine (antiepileptics) 13.9 2.45 236.28 17.7 NAb
Nifedipine (calcium channel blockers) < 1 2.20 346.34 56.3 3124
Levonorgestrel (sex hormones) NA 3.48 312.46 2.05 2.6263
Simvastatin (lipid modifying agents) 13.49 4.68 418.58 0.03 1223.5
and 2 mL of deionized water at a flow rate of 1 mL min–1.
After the conditioning step aliquots of 100 mL of sample (without pH adjustment, pH = 7.2) were loaded into the cartridge. Samples were passed through the cartridges at a flow rate of 9.0 mL min–1 and then, rinsed with 1 mL of
deionised water prior to elution. After that, the cartridges were dried under vacuum during approximately 15 min at a flow rate 14 mL min–1 to remove excess of water and finally
the analytes retained were eluted with 5 mL of ethyl acetate at 1 mL min–1. The extracts so obtained were evaporated to
dryness by a gentle nitrogen stream and redissolved with 1 mL of 0.1% FA in MeOH-DIW (10:90, v/v). 40 µL of the extract was automatically injected into LC-ESI-TOF/MS system for analysis.
LC-ESI-TOF/MS analysis
The LC analysis were performed using a Dionex Ultimate 3000/LC 09115047 (USA) system equipped with a vacuum degasser, a quaternary pump, an autosampler and a UV-Vis diode array detector. Chromatography was performed on a Thermo Scientific C18 (250 mm × 2.1 mm,
i.d.: 5 µm) column. The injection volume was 40 µL. All compounds were analysed in positive ion (PI) mode and eluted off the column with a mobile phase consisting of (A) 0.1% FA in DIW and (B) ACN-MeOH (3:1, v/v) at 0.3 mL min–1. The elution started at 5% B and was then
linearly increased to 60% B over 3 min, further increased to 97% B over 3 min and then kept isocratic for 5 min. Next, the elution was returned to its starting conditions over 11.1 min and allowed to equilibrate for 5 min prior to the next run.
The mass spectrometry was carried out on a TOF instrument (Bruker/Germany) equipped with a Z-spray electrospray interface. The results were obtained with the following settings: MS capillary voltages, 4000/3500 (PI/NI); collision energy for all analytes, 2-30 eV; drying-gas flow rate, 8.0 L min–1; drying gas temperature, 190 °C; set
capillary, 4000 V; set end plate offset −500 V; set collision cell RF, 250 Vpp and nebuliser pressure, 4.0 bar. Two adduct ions, namely [M+H]+ and [M+Na]+, were observed using
TOF/MS analysis in positive-ion mode. The TOF results were collected between m/z 50-600 with low collision energy of 10 eV. All analytes were acquired using an independent reference spray via the LockSpray interference to ensure accuracy and reproducibility; mixture of sodium hydroxide and formic acid was used as the lock mass m/z 90.9766 - 974.8132. The accurate mass was calculated using software MassLynx incorporated in the instrument.
The mass resolution (R) was calculated based on the full width at half maximum (FWHM). All pharmaceuticals
have R ≥ 6000 at 1.0 µg L-1 level of spiking in river water
for all pharmaceuticals.
Validation of the analytical procedure
Each compound was identified based on mass value (m/z) and retention times. Quantitation was carried out using the TOF mode, by extracting the narrow window extracted ion chromatogram (nwXIC) of the molecular ion for each compound (typically extracted using a 0.03 Da window) as reported in one study 0.02 Da.24
Positive identification of the target compounds was based on (i) accurate mass measurement of the base ion with an error of ≤ ± 10.5 part per million (ppm) for most of compounds; (ii) LC retention time of the analyte compared to that of a standard with an error of ≤ ± 0.7% for most of compounds.
The reproducibility and repeatability of the method were evaluated from run-to-run experiments (three successive injections of a standard solution) with three different concentrations 10, 50 and 300 µg L–1 and
week-to-week experiments (three successive weeks) with 100 µg L–1. The precision of the method (in terms of peak
areas and retention time) was expressed as the relative standard deviation (RSD%) of replicate measurements. All results were presented in Tables 2 and 3.
Calibration curves were generated of each analyte by injecting pooled solutions prepared from the standard mixtures (0.5-250 µg L–1). Calibration curves were built for
each compound by plotting the peak area of each analyte against the concentration of each analyte using linear regression analysis and the concentration range that gave good fit (determination coefficients, R2 > 0.99). The IQLs
were estimated from the injection of a standard solution successively diluted until reaching a concentration level corresponding to the least concentration in calibration curves for each compound. LOQ was defined as the minimum detectable amount of an analyte in spiked river water extract giving a signal-to-noise ratio of ≥ 10.
Matrix effects
To evaluate the matrix effects (ME%) on signal intensity. SPE extracts of river water was spiked with pharmaceuticals (spike level of 200 µg L–1). The spiked
samples were injected to LC-ESI-TOF/MS.
The matrix effect could be calculated with the following equation:
By this equation, the effect of sorbent is ignored so only the effect of matrix is considered, as reported elsewhere.25
Where AS is the peak area of the analyte in pure standard
solution, ASP is the peak area in the spiked matrix extract (after drying with nitrogen before injection) and AUSP is the
peak area in the un-spiked matrix extract.
In this procedure the losses of analytes caused during ionization can be evaluated. Yet excluding any losses caused by SPE and further sample preparation. ME% (+) suggests ionization suppression and ME% (–) suggests ionization enhancement.
Results and Discussion
Selection of the mobile phase and elution program
Several experiments were provided to select the best elution program and mobile phase based on running time, resolution, and signal-to-noise ratio (S/N). The optimal separation of 7 compounds detected in PI mode was achieved using a gradient elution (16.1 min) and a mobile phase ACN-MeOH (3:1, v/v). Total analysis in the PI mode (including the equilibration to the initial mobile phase conditions) was 16.1 min, which represented an approximate three-fold reduction in the analysis time compared to another study (45-min run).26 An example of
the total ion chromatogram (TIC) showing the separation of compounds detected in PI mode is showing in Figure 2.
Selectivity and robustness
The selectivity of the methods was investigated by analyzing chromatograms obtained from standards individually, standards mixture and solvent without standards. The retention times for all standards were same. Robustness was studied by changing mobile phase, change place of instrument and volume injection, at all changes, the retention time and peak purity still same without differences (Table 4)
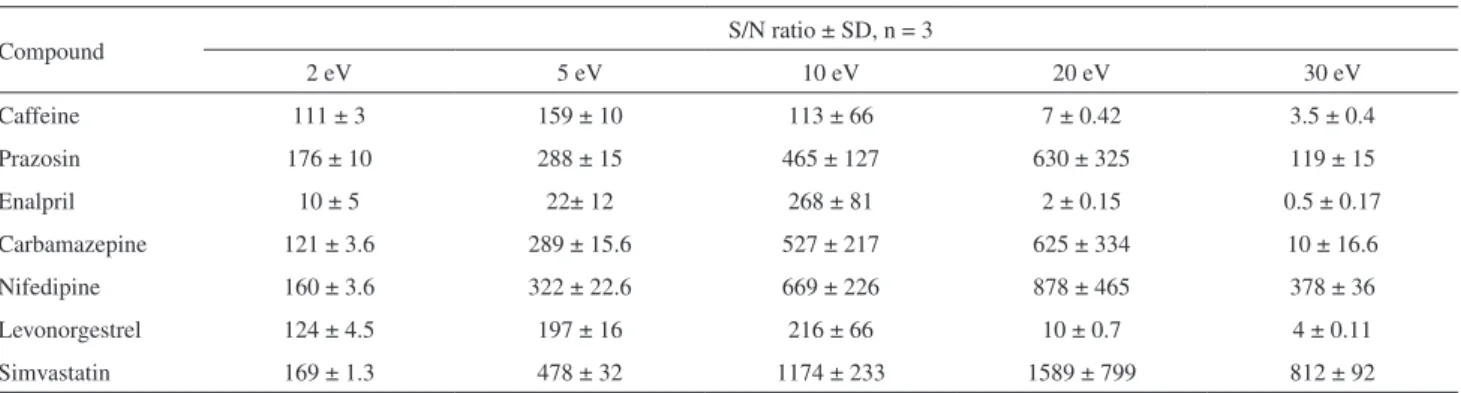
Optimization of collision energy
The collision energy was studied from 2 to 30 eV to identify the optimum value for all analytes. (Table 5) indicates that signal-to-noise ratio for all analytes was best at 10 eV, the only exception being caffeine and
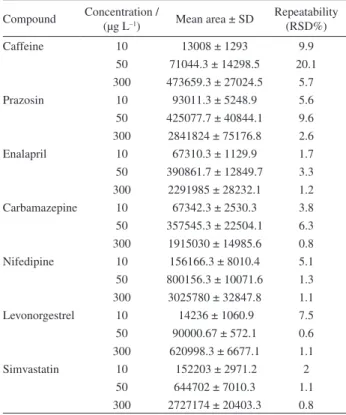
Table 2. Repeatability for all target compounds with different concentrations (n = 3)
Compound Concentration /
(µg L–1) Mean area ± SD
Repeatability (RSD%)
Caffeine 10
50 300
13008 ± 1293 71044.3 ± 14298.5 473659.3 ± 27024.5
9.9 20.1 5.7 Prazosin 10 50 300
93011.3 ± 5248.9 425077.7 ± 40844.1
2841824 ± 75176.8
5.6 9.6 2.6 Enalapril 10 50 300
67310.3 ± 1129.9 390861.7 ± 12849.7
2291985 ± 28232.1
1.7 3.3 1.2 Carbamazepine 10 50 300
67342.3 ± 2530.3 357545.3 ± 22504.1
1915030 ± 14985.6
3.8 6.3 0.8 Nifedipine 10 50 300
156166.3 ± 8010.4 800156.3 ± 10071.6
3025780 ± 32847.8
5.1 1.3 1.1 Levonorgestrel 10 50 300
14236 ± 1060.9 90000.67 ± 572.1 620998.3 ± 6677.1
7.5 0.6 1.1 Simvastatin 10 50 300
152203 ± 2971.2 644702 ± 7010.3 2727174 ± 20403.3
2 1.1 0.8
Table 3. Reproducibility for all pharmaceuticals within three weeks using 100 µg L-1 of standards
Compound
First week Mean area,
n = 3
Second week Mean area,
n = 3
Third week Mean area,
n = 3
Reprodu-cibility (RSD%)
Caffeine 209151.7 166455.3 195161 11.4
Prazosin 992821 1100117 1261084 12.1
Enalapril 775081.7 696124.7 717404 5.6
Carbamazepine 635262.3 636771.7 662055.3 2.33
Nifedipine 1538248 1398330 1410392 5.4
Levonorgestrel 204321 299816 262652.7 18.8
Simvastatin 905267 1421774 1303055 22.3
enalapril, which show the best response at 5 eV. In the case of 20 eV, the S/N ratio was high for four compounds, (prazosin, carbamazepine, nifedipine and simvastatin); meanwhile, caffeine, enalapril and levonorgestrel were fragmented completely (94, 99.3 and 95.4%, respectively). This variation may be attributed to the structure of the compounds and abbility of these compounds to resist the high collision energy. Thus, 10 eV was selected as the optimum value as a good compromise between the best response for all analytes and an acceptable response for caffeine and enalapril.
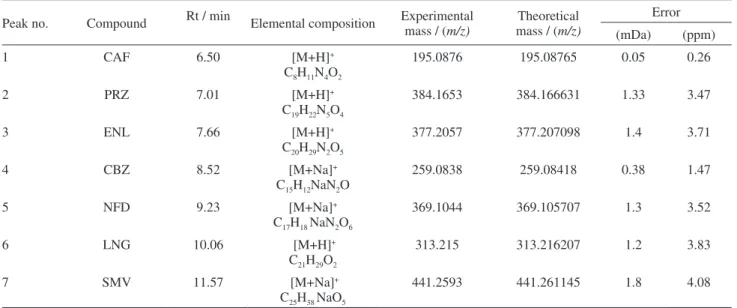
Elemental composition
The accurate mass data for the molecular ions were processed using Microsoft Excel program, which provided the elemental formulas and mass errors (i.e., differences between the accurate masses and the theoretical values). Table 6 lists the exact mass measurements and mass errors obtained in the TOF mode for molecular ions. The errors obtained were between 0.26-4.08 ppm or 0.05-1.8 mDa
which is within the widely accepted accuracy threshold of 5 ppm.24 The intensities of the mass of the compounds
decreased as the collision energy increased.
Solid phase extraction: effect of pH, choice of eluent and sorbent.
Commercially available Oasis HLB polymeric sorbent is a copolymer that contains lipophilic divinylbenzene units and more hydrophilic N-vinylpyrrolidone units. The pharmaceuticals were spiked in deionised water at a concentration of 1.0 µg L–1 and the pharmaceuticals were
eluted with studied solvents to select the best eluent. The studied elution solvents were 5 mL of ethyl acetate as (eluent A), 3 mL of ethyl acetate plus 3 mL of methanol as (eluent B) and 3 mL of acetone plus 3 mL of methanol as (eluent C). Ethyl acetate gave the highest extraction efficiency for all analytes with some exceptions. In average, the analytes were extracted between 121 and 28.5% with (eluent A), between 172 and 42% with (eluent B) and between 142 and 22% with (eluent C). Therefore, ethyl
Table 4. Effect of injection volume, lab movement and mobile phase on the robustness
Robustness Parameters
Retention time / (min)
CAF PRZ ENL CBZ NFD LNG SMV
38 µL 6.53 6.99 7.59 8.53 9.25 10.07 11.58
42 µL 6.52 6.95 7.63 8.43 9.17 9.98 11.50
40 µL 6.50 7.01 7.66 8.52 9.23 10.06 11.58
Lab 1 6.52 6.92 7.60 8.42 9.20 9.98 11.47
Lab2 6.50 7.02 7.66 8.52 9.22 10.1 11.51
MP1a 6.52 6.99 7.68 8.50 9.21 10.03 11.56
MP2b 6.53 7.01 7.67 8.58 9.27 10.18 11.51
Average 6.52 6.98 7.64 8.5 9.22 10.06 11.53
SD 0.012 0.036 0.035 0.057 0.033 0.07 0.043
RSD% 0.18 0.52 0.45 0.67 0.35 0.7 0.37
aMobile phase composition (75% ACN-MeOH,v/v); bmobile phase composition (77% ACN-MeOH,v/v).
Table 5. Optimization of collision energy based on signal-to-noise ratio value
Compound S/N ratio ± SD, n = 3
2 eV 5 eV 10 eV 20 eV 30 eV
Caffeine 111 ± 3 159 ± 10 113 ± 66 7 ± 0.42 3.5 ± 0.4
Prazosin 176 ± 10 288 ± 15 465 ± 127 630 ± 325 119 ± 15
Enalpril 10 ± 5 22± 12 268 ± 81 2 ± 0.15 0.5 ± 0.17
Carbamazepine 121 ± 3.6 289 ± 15.6 527 ± 217 625 ± 334 10 ± 16.6
Nifedipine 160 ± 3.6 322 ± 22.6 669 ± 226 878 ± 465 378 ± 36
Levonorgestrel 124 ± 4.5 197 ± 16 216 ± 66 10 ± 0.7 4 ± 0.11
acetate (eluent A) was chosen as the best eluent for further experiments. Table 7 summarises, the performance of the evaluated elution solvents. All pharmaceuticals in this study have different polarities in terms of Log Kow: namely caffeine (–0.07), prazosin (1.28), enalapril (0.49), carbamazepine (2.45), nifedipine (2.2), levonorgestrel (3.48) and simvastatin (4.68).
Based on these results, caffeine is the most polar compound and simvastatin is the least polar. The extraction efficiency of organic compounds by SPE is highly dependent on the polarity of the eluents and compounds.
The results show that the extraction efficiency for caffeine was the lowest with (Eluent A) but highest with (Eluent B and C). The extraction efficiency of enalapril was the highest with eluent C. In the case of prazosin, carbamazepine, nifedipine, the highest extraction efficiency
was found with (Eluent A) rather than (Eluent B) or (Eluent C). This finding may be attributed to the polarity of the compounds versus the polarity strength of the elution solvents. However, these results were consistent with previous studies using different cartridges.5,24
Based on this result, ethyl acetate (Eluent A) was selected as a good compromise, extracting all pharmaceuticals with an extraction efficiency ranged from 30% to 127% for 100 mL river samples fortified with 1.0 µg L–1.
Ethyl acetate (5 mL) was used as the eluent in the pH optimization experiments. The extraction efficiency of the pharmaceuticals was studied at pH 2.5 and without pH adjustment (pH = 7.2). The pharmaceuticals were spiked at level of concentration 1 µg L–1 in river water and
deionised water. For most of the compounds, pH did not have a pronounced effect on the extraction efficiency, with the exception of nifedipine which was poorly recovered at low pH (5% at pH 2.5). Nifedipine could be extracted at fairly high yield at pH without adjustment (40%). At pH 2.5, enalapril was extracted at high level of extraction efficiency (70%). This suggests improvement of extraction efficiency related to stability of carboxylic group in the structure of enalapril at pH 2.5. However, surface water without pH adjustment was considered for further work because of the basicity of the most compounds (pKa > 7). Therefore, no pH adjustment was performed in this study as shown in Figure 3.
Different cartridges were used to study the extraction efficiency of target compounds, including SupelcleanTM
ENVI-Chrom P (highly crosslinked, neutral, specially cleaned styrene-divinylbenzene co-polymer resin used to retain hydrophobic compounds with some hydrophilic
Table 6. Elemental composition and mass measurements for all pharmaceuticals
Peak no. Compound Rt / min Elemental composition Experimental mass / (
m/z)
Theoretical mass / (m/z)
Error
(mDa) (ppm)
1 CAF 6.50 [M+H]+
C8H11N4O2
195.0876 195.08765 0.05 0.26
2 PRZ 7.01 [M+H]+
C19H22N5O4
384.1653 384.166631 1.33 3.47
3 ENL 7.66 [M+H]+
C20H29N2O5
377.2057 377.207098 1.4 3.71
4 CBZ 8.52 [M+Na]+
C15H12NaN2O
259.0838 259.08418 0.38 1.47
5 NFD 9.23 [M+Na]+
C17H18 NaN2O6
369.1044 369.105707 1.3 3.52
6 LNG 10.06 [M+H]+
C21H29O2
313.215 313.216207 1.2 3.83
7 SMV 11.57 [M+Na]+
C25H38 NaO5
441.2593 441.261145 1.8 4.08
Table 7. Optimization of elution solvent to extract all pharmaceuticals (level of spiking is 1.0 µg L–1 in DIW)
Compound
Eluent A Eluent B Eluent C
EE% (RSD%, n = 3)
EE% (RSD%, n = 3)
EE% (RSD%, n = 3)
Caffeine 120.87 (3.1) 172 (3.34) 141.6 (4.7)
Prazosin 73.51(4.3) 54.9 (7.2) 19.5 (3.1)
Enalapril 95.64 (4.2) 90.9 (4.6) 115 (1.8)
Carbamazepine 83.92(1.8) 61.6 (0.63) 28.7 (5.4)
Nifedipine 63.97(4.6) 51.7 (2.69) 22 (3.9)
Levonorgestrel 67.55 (1.1) 82.9 (2.11) 63.7 (4.8)
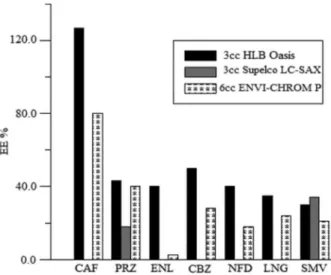
functionality under reversed phase conditions), Oasis HLB cartridges (universal polymeric reversed-phase sorbent developed for the extraction of a wide range of acidic, basic, and neutral compounds) and SupelcleanTM
LC-SAX (quaternary amine, Cl– counter-ion, ion
exchanger and reverse-phase sorbent cartridge). Thus, multiple interior structures were used among the different cartridges. As Shown in Figure 4, better extraction efficiencies were obtained for the target compounds with Oasis HLB compared to ENVI-CHROM P, despite the differences in size (3cc for Oasis HLB and 6cc for ENVI-CHROM P).
LC-SAX was only effective for simvastatin and prazosin, not the other target compounds. Thus, this cartridge is recommended for the extraction of more hydrophobic and weakly acidic compounds. Based on these results, 3cc HLB Oasis cartridges were selected for further experiments.
Linearity and limit of quantifications
The effective linear dynamic ranges (R2 > 0.99)
determined for pure standards are presented in Table 8. The LC-ESI-TOF/MS method was found to be linear up to the concentration of 250 µg L–1. Higher concentrations were not
analyzed. The LOQs were determined for every compound in river water. The instrumental quantification limit (IQL) was determined to be the concentration that has the signal to noise ratio of ≥ 10. The IQLs ranged from 0.5-5 µg L–1.
The LOQs was determined to be the concentration that spiked in surface water and had the signal to noise ratio of
≥ 10. In surface water, the LOQ ranged from 13-800 ng L–1.
Matrix Effect
Co-eluting matrix components may cause suppression of the analyte signal during electrospray ionization and therefore, the suppression of the signals of the studied components was evaluated. In the chromatogram of the river water extracts,some signal suppression was noticed for some compounds at the end of the chromatographic run (> 8 min). This indicates that the matrix constituents that elute at higher proportions of acetonitrile can severely suppress the ionization of the analytes eluting at retention times longer than 8 min.
To quantify the matrix effect, a set of experiments were performed. SPE extracts of river water were spiked (200 µg L–1) with the studied compounds and analyzed. The
peak areas of the individual compounds were compared to the peak areas of the pure standards made in the solvent. The enhancement or suppression of the signal was calculated according to equation (1). The ion suppression was ranged from (10-41%) in river sample extracts. Some signal suppression was noticed for carbamazepine, nifedipine and levonorgestrel, i.e., 37, 41 and 24%, respectively. The ion suppression for the rest of the compounds was less than 20%. More severe signal suppression was observed during the analysis of river water, where over 24% of the signal intensity was lost for the compound having retention times longer than 8 min. At higher proportions of acetonitrile, the more lipophilic (hydrophilic) matrix components elute from the column and these were probably responsible for most of the signal suppression. The results were in line with the previous study that has been reported by Hernando et al.. 27
All method validation parameters were presented in Table 8.
Application for real samples
The studied compounds are commonly used pharmaceuticals in Malaysia (Figure 1). This new
Figure 3. Influence of pH adjustment, pH 2.5 versus pH without adjustment, on the extraction efficiency obtained using Oasis HLB cartridges (level of spiking is 1.0 µg L–1 in surface water).
developed method was applied to assess the occurrence of studied pharmaceuticals in Tangkas River. To make sure that the internal standard (caffeine 13C
3) was not present
in the water sample blank, sample without any internal standard was analyzed. The internal standard (caffeine
13C
3) was not detected in real sample so this method
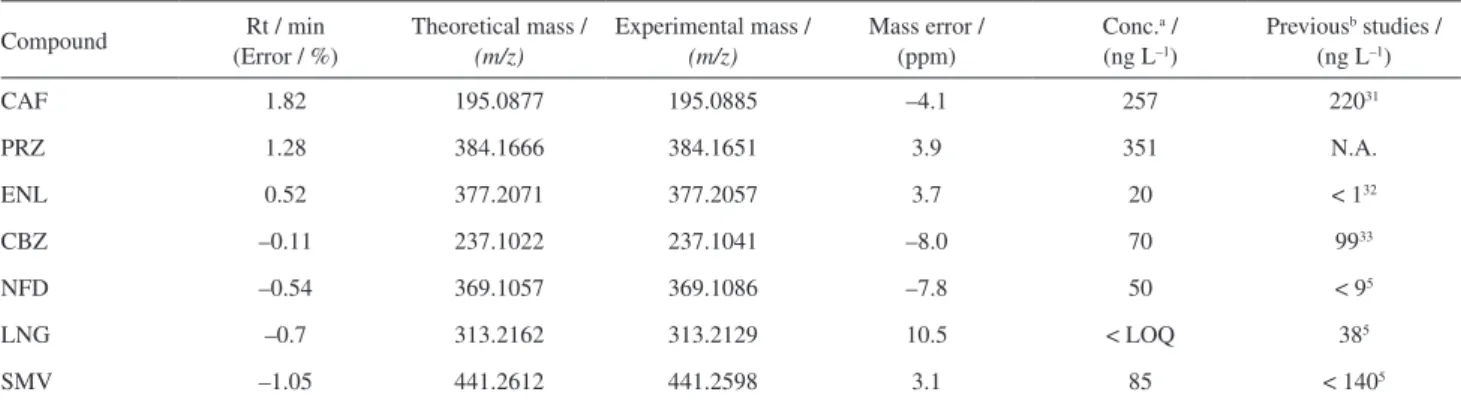
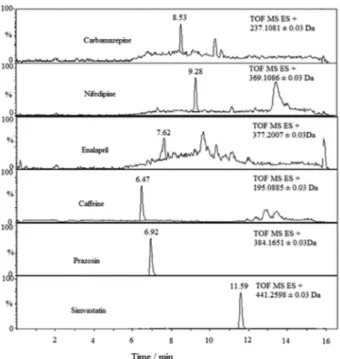
considered more selective for studied compounds. This is the first report of human pharmaceutical pollutants in samples collected from Tangkas River, Malaysia. All pharmaceuticals detected in Tangkas River were presented in Figure 5. Results of samples analysis is presented in Table 9. In March 2013, six target analytes were determined in Tangkas River at concentrations of 257, 351, 20, 70, 50 and 85 ng L–1 for caffeine, prazosin,
enalapril, carbamazepine, nifedipine and simvastatin, respectively. The rest of compounds were detected but at level of concentration < LOQ.
In this study prazosin is reported for the first time in the aquatic environment worldwide. It was found in the river with the concentration of 351 ng L–1. The high level
of caffeine (257 ng L–1) is not only due to the amount
present in pharmaceuticals but also to its presence in some products such as chocolate, coffee, tea, or sports drinks. This widespread use results in caffeine be detected in effluent and influent of sewage treatment plants at high level of concentration in µg L–1.28,29
Antihypertensive class such as nifedipine, was detected at low concentration, 50 ng L–1. This may be attributed
to the fact that nifedipine is easily degraded and is light sensitive so it does not show high persistence in the aquatic environment. Nifedipine was not detected in 11 rivers samples collected from Germany which is consistent with our results that showed the scarce occurrence of nifedipine in Tangkas river water.30 Enalapril was present
at low concentration (20 ng L–1). Levonorgestrel was
detected at concentration < LOQ. Carbamazepine and simvastatin were detected at 70 and 85 ng L–1, respectively.
The confirmation of the detection of caffeine, prazosin, enalapril, carbamazepine and simvastatin in the surface water was performed by comparison to the mass spectra and retention times of the standards for each compound (Table 9).
Table 8. Linearity, instrumental quantification limits (IQLs), limit of detection (LOD), matrix effect, extraction efficiency and limit of quantification (LOQ) for pharmaceuticals in the LC-ESI-TOF/MS.
Compound Linearity range /
(µg L–1) (R2) Linear equation
IQL / (µg L–1)
EE%a River
EE%a
DIW ME%
b LOQ /
(ng L–1)
CAF 2.5-150 (0.992) Y = 3191.23 * X + 3774.76 2.5 127 120 10 15
PRZ 1.5-150 (0.996) Y = 19094.4 * X + 11138.6 1.5 43 74 17 33
ENL 2.5-150 (0.999) Y = 15239.1 * X + -9304.22 2.5 40 96 15 15
CBZ 1.5-150 (0.999) Y = 12736.9 * X + 7173.42 1.5 50 84 37 61
NFD 1.5-50 (0.995) Y = 28323.7 * X + 18310 1.5 40 64 41 40
LNG 5-250 (0.991) Y = 4329.93 * X + 7737.9 5 35 68 24 800
SMV 0.5-150 (0.996) Y = 17643.2 * X + 98634.9 0.5 30 29 18 13
CAF 13C
3 66 90 14
aLevel of spiking is 1.0 µg L–1 of pharmaceutical standards and surrogate (CAF 13C
3); blevel of spiking is 200 µg L–1 of pharmaceutical standards and internal standard (CAF 13C
3).
Table 9. Confirmation data of all target pharmaceuticals in real sample
Compound Rt / min (Error / %)
Theoretical mass /
(m/z)
Experimental mass /
(m/z)
Mass error / (ppm)
Conc.a / (ng L–1)
Previousb studies / (ng L–1)
CAF 1.82 195.0877 195.0885 –4.1 257 22031
PRZ 1.28 384.1666 384.1651 3.9 351 N.A.
ENL 0.52 377.2071 377.2057 3.7 20 < 132
CBZ –0.11 237.1022 237.1041 –8.0 70 9933
NFD –0.54 369.1057 369.1086 –7.8 50 < 95
LNG –0.7 313.2162 313.2129 10.5 < LOQ 385
SMV –1.05 441.2612 441.2598 3.1 85 < 1405
Figure 5. Detection of six pharmaceuticals residues in Tangkas river sample.
Conclusion
The developed SPE-LC-ESI-TOF/MS method was precise, sensitive and accurate allowing extraction and determination of caffeine, prazosin, enalapril, carbamazepine, nifedipine, levonorgestrel and simvastatin from water samples. The recovery obtained for all target compounds using (3cc Oasis HLB) cartridges were good relative to previous studies.
The optimization of mobile phase, gradient elution program and collision energy plays an important role in enhancing the signal-to-noise ratio in terms of quantification analysis for all compounds. TOF/MS is a very sensitive detector able to detect extremely low concentrations in real samples with high accuracy and high resolution in terms of m/z value. The method performance data indicate that the techniques applied to routine analysis of surface water samples for pharmaceuticals is selective and sensitive for the majority of compounds tested with LOQ down to 13 ng L–1. The developed
method was successfully applied for the detection of six pharmaceutical residues at 40 µL volume injection with low matrix effect in Tangkas River, Malaysia.
Acknowledgements
The authors thank Mr. Alefee of centre for research and instrumentation management (CRIM) in Malaysia, for providing the facilities (LC-TOF/MS) to carry out this work and the ALIR staff for providing deionised water and
facilities for sampling. This work was financially supported by several research grants namely UKM-DLP-2012-024, UKM-ST-06-FRGS0093-2010 and UKM-AP-2011-21.
References
1. Robinson, I.; Junqua, G.; Coillie, R.; Thomas, O.; Anal. Bioanal. Chem.2007,387, 1143.
2. Loos, R.; Wollgast, J.; Huber, T.; Hanke, G.; Anal. Bioanal. Chem.2007,387, 1469.
3. Daneshvar, A.; Svanfelt, J.; Kronberg, L.; Weyhnmeyer, G. A.;
Environ. Sci. Pollut. Res.2010,17, 908.
4. Joseph, L.; Zaib, Q.; Khan, I. A.; Berge, N. D.; Yong-Gyun, P.; Saleh, N. B.; Yoon, Y.; Water Res.2011,45, 4056.
5. Al-Odaini, N. A.; Zakaria, M. P.; Yaziz, M. I.; Surif, S.;
J. Chromatogr., A2010, 121, 6791.
6. Gomez, M. J.; Petrovic, M.; Fernandez-Alba, A. R.; Barcelo, D.;
J. Chromatogr., A2006,1114, 224.
7. Gros, M.; Petrovic, M.; Barcelo, D.; Talanta2006,70, 678. 8. Lopez-Serna, R.; Perez, S.; Ginebreda, A.; Petrovic, M.;
Barcelo, D.; Talanta 2010,83, 410.
9. Ferrer, I.; Zweigenbaum, J. A.; Thurman, E. M.; J. Chromatogr., A 2010, 1217, 5674.
10. Stolker, A. A. M.; Rutgers, P.; Oosterink, E.; Lasaroms, J. J. P.; Peters, R. J. B.; Vanrhijn, J. A.; Nielen, M. W. F.; Anal. Bioanal. Chem.2008, 391, 2309.
11. Martin, J.; Buchberger, W.; Alonso, E.; Himmelsbach, M.; Aparicio, I.; Talanta2011,85, 607.
12. Lin, W.; Chen, H.; Ding, W.; J. Chromatogr., A2005, 1065, 279.
13. Basher, C.; Lee, J.; Pederson-Bjergaard, S.; Rasmussen, K.E.; Lee, H.K.; J. Chromatogr., A2010,1217, 6661.
14. Corcia, A. D.; Nazzari, M.; Rao, R.; Samperi, R.; Sebastiani, E.;
J. Chromatogr., A2000,878, 87.
15. Abdel-Hamid, M. E.; ILFarmaco.2000,55, 136.
16. El-Desoky, H. S.; Ghoneim, M. M.; Habazy. A. D.; J. Braz. Chem. Soc.2011, 2, 239.
17. Bonfilio, R.; de Araújo, M. B.; Salgado, H. R. N.; J. Braz. Chem. Soc.2011, 2, 292.
18. Babaei, A.; Afrasiabi, M.; Mirzakhani, S.; Taheri, A. R.; J. Braz. Chem. Soc.2011, 2, 344.
19. Weigel, S.; Kallenborn, R.; Huhnerfuss, H.; J. Chromatogr., A 2004,1023, 183.
20. Malaysian Statistics on Medicines, Pharmaceutical Services Divisions (Ministry of Health Malaysia, 2007), http://www. pharmacy.gov.my/v2/en/documents/malaysian-statistics-medicines.html, accessed on December, 2013.
21. DrugBank, Open data drug and drug Target Database. Available at http://www.drugbank.ca/ accessed in October, 2013. 22. Zendelovska, D.; Simeska, S.; Sibinovska, O.; Kostova, E.;
Trojacanec, J.; Zafirov, D.; J. Chromatogr., B 2006,839, 85.
23. Vieno, N. M.; Tuhkanen, T.; Kronberg, L.; J. Chromatogr., A 2006,1134, 101.
24. Petrovic, M.; Gros, M.; Barcelo, D.; J. Chromatogr., A2006, 1124, 68.
25. Ternes, T. A.; Water Res.1998,32, 3245.
26. Petrovic, M.; Hernando, M. D.; Diaz-Cruz, S.; Barcelo, D.;
J. Chromatogr., A2005,1067, 1.
27. Hernando, M. D.; Petrovic, M.; Fernandez-Alba, A. R.; Barcello, D.; J. Chromatogr., A2004,1046, 133.
28. Pedrouzo, M.; Borrull, F.; Pocurull, E.; Marce, R. M.; Water Air Soil Pollut.2011,217, 267.
29. Lacey, C.; Basha, S.; Morrissey, A.; Tobin, J. A.; Environ Monit Assess.2012,184, 1049.
30. Ternes, T.; Bonerz, M.; Schmidt, T.; J. Chromatogr., A2001, 938, 175.
31. Ferrer, I.; Thurman, E. M.; J. Chromatogr., A2012,1259, 148. 32. Garcia-Ac, A.; Segura, P.A.; Viglino, L.; Furtos, A.; Gagnon, C.; Prevost, M.; Sauve, S.; J. Chromatogr., A2009,1216, 8518. 33. Yu, Z.; Peldszus, S.; Huck, P.M.; J. Chromatogr., A2007,1148,
65.
Submitted: July 15, 2013