Article
J. Braz. Chem. Soc., Vol. 25, No. 2, 238-245, 2014. Printed in Brazil - ©2014 Sociedade Brasileira de Química 0103 - 5053 $6.00+0.00
A
*e-mail: [email protected]
Characterization and Quantification by Gas Chromatography of Free Steroids in
Unsaponifiable Matter of Vegetable Oils
Kelly da S. Bezerra and Nelson R. Antoniosi Filho*
Laboratório de Métodos de Extração e Separação (LAMES), Instituto de Química, Universidade Federal de Goiás, Campus Samambaia, CP 131, 74001-970 Goiânia-GO, Brazil
O estudo sobre os esteróides livres e sua utilização na caracterização de óleos é interessante já que sua distribuição é diferente para cada óleo. Embora vários trabalhos mostrem a análise desses esteróides em óleos, um trabalho mais abrangente mostrando a presença de esteróides menos abundantes ainda é limitado. Os esteróides foram extraídos a partir da matéria insaponificável usando reação de saponificação em microescala. Após a extração os esteróides foram caracterizados por cromatografia gasosa (GC) utilizando os detectores por ionização de chama (FID) e espectrometria de massas (MS). Todos os picos cromatográficos presentes nos óleos que poderiam ser de esteróides livres foram caracterizados e quantificados. Os resultados evidenciaram grande diversidade de tipos e teores de esteróides livres. Os óleos de milho e moringa apresentaram maiores teores de esteróides em relação aos outros óleos analisados. Os óleos de babaçu, palmiste e canola foram os que apresentaram os menores teores.
The study of free steroids and their use in oil characterization is interesting because the distribution of these steroids varies from one oil to another. Although several papers analyze the most abundant steroids in oils, studies including less common steroids are scarce. Free steroids were extracted from unsaponifiable fraction using the saponification reaction adapted micro-scale. After extraction, steroids were characterized by gas chromatography (GC) using flame ionization (FID) and mass spectrometry (MS) detectors. All chromatographic peaks in the oils that could belong to free steroids were characterized and quantified. Results evidenced great diversity in types and levels of free steroids. Corn and moringa oils had higher levels of steroids than the other oils analyzed. Babassu, palm kernel and canola oils had the lowest steroid levels.
Keywords: phytosterols, saponification reaction, GC-FID, GC-MS
Introduction
The characterization of oils is of great importance for different areas of science since it makes possible to predict the properties inherent in each oil, and depending on the goal, to inform whether or not they present the expected properties. Several methods use fatty acid
composition analysis to characterize oils.1-3 However, this
characterization method can be inefficient since most of the
fats and oils may contain the same fatty acids.4-5
One group of chemical components that can be used for characterization purposes is steroids, which are formed in oils from reactions involving condensation and
rearrangements of the lipid squalene.6-8 They are present in
oils along with other compounds forming unsaponifiable.9
Steroids are predominantly distributed in free and, to some
extent, in conjugated fatty acids and glucosides.10-13
The so-called steroid profile, that is, the types of steroids present in a substance and their relative proportions, is not the same for different oils. This therefore serves as a
fingerprint for identifying them.14-15 In addition to providing
characterization, steroid analysis can serve as a traceability
parameter in identifying and detecting adulteration.16-17
Using steroid composition, Al-Ismail et al. studied
adulteration in olive oil, a high-quality and high-value oil, using other cheaper vegetable oils such as cottonseed,
sunflower, corn and soybean oil.18
contained in this fraction.19-21 What sets this study apart is
the reduction to micro-scale of the sample saponification phase coupled with GC using medium polarity capillary columns rather than the nonpolar columns used in other
methods.22-24
The sample saponification method is applicable only to the analysis of steroids in the free form. Saponification reaction conditions break existing connections in conjugated steroids, which can therefore not be identified
by this method. 25
In this context, considering how little is known about which free steroids are found in various oils and how they are distributed, the goal of this paper is to characterize and quantify the steroids present in these samples using a method developed for the extraction and separation of the steroids in unsaponifiable fraction.
Experimental
Reagents, solvents and reference standards
Solvents used were of HPLC grade and purchased from the Tedia Company Inc. (Fairfield, CT, USA). Reference
standards of stigmasterol, cholesterol, β-sitosterol,
campesterol, brassicasterol and betulin were of GC purity (greater than 99%) and were acquired from Sigma Aldrich Chemical Company (St. Louis, MO, USA). The derivatizing
agent used was MSTFA [N-methyl-N-(trimethylsilyl)
trifluoroacetamide] also purchased from Sigma Aldrich. All other reagents were of analytical grade.
Oil samples
Oils used in this study were purchased locally in Goiânia, GO, Brazil and Marabá, PA, Brazil. Canola, cotton, palm kernel and corn oils were industrially refined; the remaining oils, crambe, moringa, soybean, sunflower, peanut, palm, babassu and castor oils, were used in their raw form.
Extraction of free steroids in unsaponifiable fraction
The saponification reaction was started by weighing 1 g of sample in a test tube and adding 15 mL ethanol and 10 mL of 50% m/v potassium hydroxide aqueous solution. The test tube was allowed to react in a previously sealed water bath at 60 °C for 60 min. After the reaction time, the reaction product contained in the test tube was transferred to a separatory funnel. The tube was washed successively with 20 mL of ethanol, 10 mL of cold water, 10 mL of hot water and 3 mL of hexane, which were all transferred to the funnel. The unsaponified matter was extracted five
times with 25 mL portions of hexane. These extracts were combined and washed three times with 10 mL of 10% v/v ethanol aqueous solution. The solution was dried with anhydrous sodium sulfate and the solvent was evaporated. The sample was solubilized in 1000 µL of pyridine, of which 200 µL was transferred to a vial for analysis. To this vial a volume of 100 µL of MSTFA (derivatizing agent) was added.
Quantification by GC-FID
A chromatographic method for quantification the free steroids was developed etulin as internal standard. In quantitative analysis, 150 µL of betulin solution was added to each vial before derivatization.
The analysis of free steroids was performed on a Shimadzu GC 2010 gas chromatograph equipped with a flame ionization detector (FID) in accordance with the chromatographic method developed in this study. A
DB17HT capillary column (30 m × 250 µm × 0.15 µm)
was used. The injector temperature was 280 °C with splitless injection of 2 µL of sample and a linear velocity
of 30 cm s-1, H
2 5.0 was the carrier gas with a flow rate
of 40 mL min-1. The oven operated initially at 200 °C. It
was heated to 330 °C at a rate of 3 °C min-1 and was kept
at this temperature for 5 min. The detector operated at a temperature of 320 °C.
Steroid content was determined by the ratio between the area and mass of internal standard and the area of identified steroids. Concentration of the different steroids present in
the oil was expressed as mg steroid per kg of oil.
Characterization by GC-MS
The GC-MS analysis was performed on a Shimadzu GC-17A gas chromatograph directly coupled to a Shimadzu QP5050A mass spectrometer. The chromatographic column and temperature programming was similar to that described for GC-FID analysis. The injection mode was manual in this case. The carrier gas used was He 5.0 with a linear velocity
of 35 cm s-1. Mass spectra were obtained in electron impact
mode (EI) between 40 and 600 a.m.u. using 70 eV with a quadrupole analyzer. For GC-MS analyses, the internal standard betulin was not added to the samples.
Assay recovery
The efficiency of the proposed method was evaluated by recovery assays with soybean oil. Before saponification reaction the oil was fortified by adding standard solutions
brassicasterol. Afterwards, samples were analyzed by GC-FID.
Multivariate analysis
Principal component analysis (PCA) was used for the data analyses of steroids composition, using the software Octave 3.2.4 for Windows.
Results and Discussion
This method was developed on the basis of test tube microscale transposition of the conventional saponification reaction. This approach provides speed and ease of operation. Traditional methods, on the other hand, use reflux under heating, which requires more complex experimental apparatus than with a test tube and also require
large quantities of sample and reagents.26
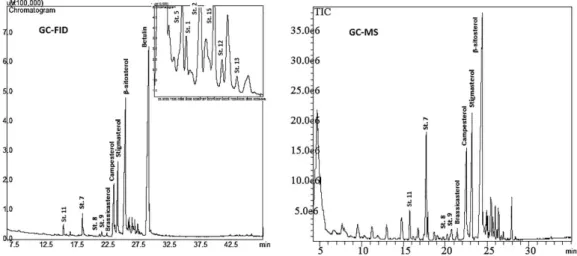
The different steroids present in oils were characterized using data obtained by chromatographic analysis with FID and MS detectors. The chromatographic method proved efficient in detecting and separating steroids since it can be applied to different types of detectors with no loss of analytical sensitivity. Figures 1 and 2 show the steroid analysis chromatograms for soybean and palm oil, respectively, examples of the excellent results obtained using this method.
The major steroids in oils, brassicasterol, campesterol,
stigmasterol and β-sitosterol, were characterized by
analyzing the corresponding reference standards. Other steroids characterized without reference standards in this study were labeled St. 1 to St. 16.
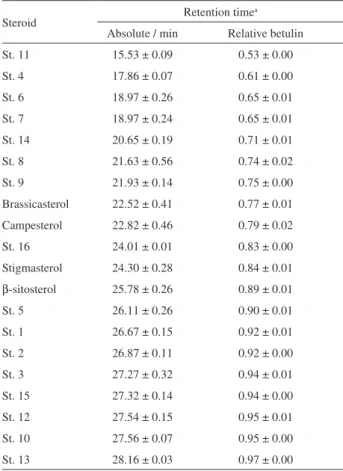
This analysis made possible to identify the retention times of the steroids present in the different oils as well as retention times relative to the internal standard betulin via GC-FID analysis. In Table 1 the retention times obtained
Figure 1. Chromatographic analysis by gas chromatography coupled to a flame ionization detector (GC-FID) and gas chromatography coupled to a mass detector (GC-MS) of free steroids present in soybean oil.
for all steroids characterized are listed in ascending order, along with standard deviations. The steroids eluted in time periods ranging from 15.53 min to 28.16 min. The internal standard used in quantifying the steroids eluted in 29.06 min.
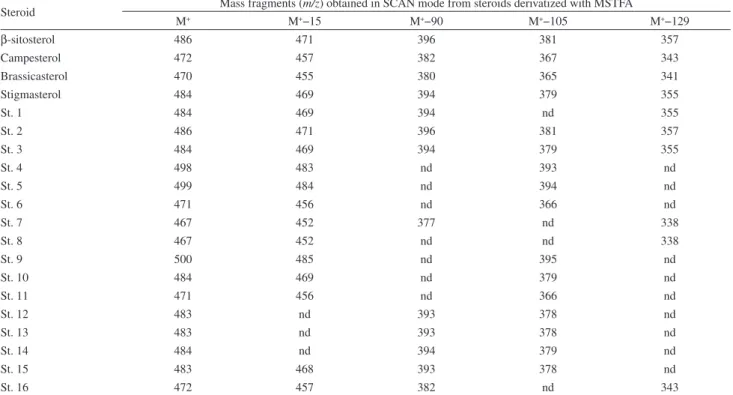
GC-MS in electron impact mode was used to obtain mass spectra for each characterized steroid. Table 2 shows the main fragmentation standards for these steroids derivatized with MSTFA: (1) the loss of a methyl group from the derivatization structure connected to the steroid molecule; (2) the loss of the entire structure of the derivatizer connected to the steroid molecule; (3) the loss
of the steroid’s entire angular side chain.27
Therefore, derivatized steroids easily lose a methyl
cluster (M+−15) under ionization, generating the first
fragmentation ion. Fragment M+−90 has already sustained
the loss of methyl together with the hydroxytrimethylsilane (TMSOH) cluster. Another fragmentation ion, characteristic of most steroids, is formed with the elimination of the entire side chain, leaving only the set of the four rings represented
by the fragment m/z 255. Other important fragments relating
to ring cleavage in the steroid molecule are M+−129, m/z 213
and m/z 173. Spectra of steroids derivatized using MSTFA
substituents have fragmentation ions typical of m/z 73 for the
Si(CH3)3clusterof the derivatizing molecule.
28-30
Steroids St. 1 to St. 16 did not have their structures elucidated since it is known that steroids may appear as structural isomers or stereoisomers. For this reason, any proposed structure may not be correct and may not include
all possible isomeric configurations.31
Recovery assays were performed to evaluate the precision and accuracy of the developed method. This assay was performed using cholesterol standard solutions, which do not naturally occur in vegetable oils, and brassicasterol standard solutions, present in many vegetable oils. Results are shown in Table 3.
For the study of precision, the results obtained by the assay recovery were expressed by coefficients of variation (CV). The lowest CV (5.36%) was found for
the recovery of cholesterol, 10 mg kg-1. The highest CV
(18.76%) was found for the recovery of brassicasterol, 10
mg kg-1. Coefficients of variation values were considered
suitable for the developed method. The values are in agreement with those obtained for steroids analysis in literature.32,33
Good recoveries were observed for both fortification levels, with typical values ranging from 77.32 to 110.74%. To confirm the accuracy of method, recoveries were tested
using Student’s t-test, being established as a null hypothesis
(H0) the recovery of 100% of standard solutions. The null
hypothesis is acceptable when the absolute value of tcalc
does not exceed the value of ttab. The t-test was applied
with 99% confidence and n–1 degrees of freedom. Thus, one cannot affirm the existence of significant differences between the recovery obtained and expected value (100%),
except for the recovery of cholesterol 10000 mg kg-1, which
was not satisfactory.
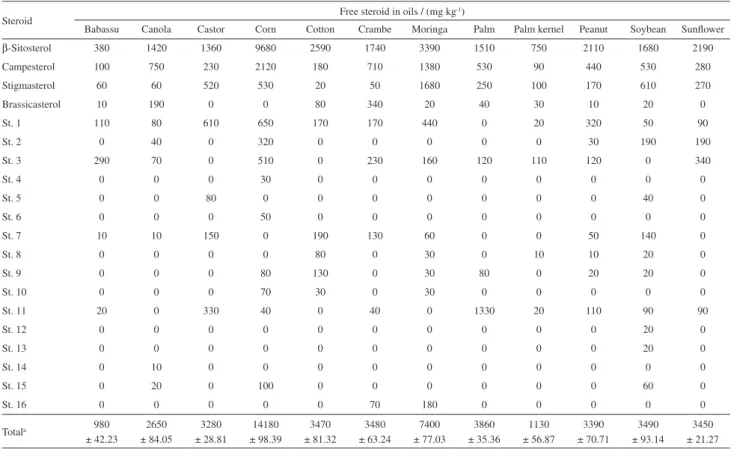
Quantitative data obtained by GC-FID for concentration
of steroids (mg kg-1) in oils are shown in Table 4. A large
variation between different types of steroids in the samples could be observed. Results show that the samples of babassu, palm kernel and canola oils had the lowest free steroid concentrations. Cottonseed, peanut, sunflower, soybean, crambe, palm and castor oil had intermediate steroid levels which were close to each other. Corn and moringa oils had the highest steroid content. Since a large number of free steroids were characterized and quantified, their levels were somewhat higher than those obtained in other studies.15,30-31
As expected, β-sitosterol was the most abundant steroid
in all samples.31 Of the oils analyzed, soybean oil displayed
the greatest diversity in steroid types. Oils such as canola,
Table 1. Absolute elution times and elution times in relation to the internal standard of steroids identified using the developed method
Steroid Retention time
a
Absolute / min Relative betulin
St. 11 15.53 ± 0.09 0.53 ± 0.00
St. 4 17.86 ± 0.07 0.61 ± 0.00
St. 6 18.97 ± 0.26 0.65 ± 0.01
St. 7 18.97 ± 0.24 0.65 ± 0.01
St. 14 20.65 ± 0.19 0.71 ± 0.01
St. 8 21.63 ± 0.56 0.74 ± 0.02
St. 9 21.93 ± 0.14 0.75 ± 0.00
Brassicasterol 22.52 ± 0.41 0.77 ± 0.01
Campesterol 22.82 ± 0.46 0.79 ± 0.02
St. 16 24.01 ± 0.01 0.83 ± 0.00
Stigmasterol 24.30 ± 0.28 0.84 ± 0.01
β-sitosterol 25.78 ± 0.26 0.89 ± 0.01
St. 5 26.11 ± 0.26 0.90 ± 0.01
St. 1 26.67 ± 0.15 0.92 ± 0.01
St. 2 26.87 ± 0.11 0.92 ± 0.00
St. 3 27.27 ± 0.32 0.94 ± 0.01
St. 15 27.32 ± 0.14 0.94 ± 0.00
St. 12 27.54 ± 0.15 0.95 ± 0.01
St. 10 27.56 ± 0.07 0.95 ± 0.00
St. 13 28.16 ± 0.03 0.97 ± 0.00
corn and soybean oil contain characteristic steroids which facilitate their characterization when compared with mixtures of other oils.
It is important to mention that during the development of seeds, they are exposed to several factors that may affect their properties and characteristics. Genotypes and environmental conditions are among the main ones. In relation to environmental conditions, soil properties, cultivation’s site, precipitation’s amount and temperature, as well as agricultural practices (irrigation and fertilization)
are important.30 Another factor that influences the
characteristics of seeds is industrial processing. Refining and degumming can lead reduction of some components
important of seeds. It was shown that such factors can affect levels, but not the composition of steroids in seeds. In this sense the composition of steroids in oil is considered a fingerprint.34
The observations about steroid composition in Table 5 may facilitate oil characterization by mixing with any of the oils analyzed in this paper.
Multivariate analysis
Using quantitative data for free steroids in various oils, a chemometric evaluation was made to correlate the types and levels of steroids present in them. For this, a model based on
Table 2. Mass fragments obtained from the spectrum of each steroid
Steroid Mass fragments (m/z) obtained in SCAN mode from steroids derivatized with MSTFA
M+ M+−15 M+−90 M+−105 M+−129
β-sitosterol 486 471 396 381 357
Campesterol 472 457 382 367 343
Brassicasterol 470 455 380 365 341
Stigmasterol 484 469 394 379 355
St. 1 484 469 394 nd 355
St. 2 486 471 396 381 357
St. 3 484 469 394 379 355
St. 4 498 483 nd 393 nd
St. 5 499 484 nd 394 nd
St. 6 471 456 nd 366 nd
St. 7 467 452 377 nd 338
St. 8 467 452 nd nd 338
St. 9 500 485 nd 395 nd
St. 10 484 469 nd 379 nd
St. 11 471 456 nd 366 nd
St. 12 483 nd 393 378 nd
St. 13 483 nd 393 378 nd
St. 14 484 nd 394 379 nd
St. 15 483 468 393 378 nd
St. 16 472 457 382 nd 343
M+: molecular ion; M+−15: molecular ion−15 m/z, and so on; nd: not detected.
Table 3. Assay recoveries for steroids
Steroid Fortification level /
(mg kg-1) n Mean recovery / % SD CV / % tcalc ttab
Cholesterol
10 5 109.33 5.86 5.36 3.56
t99% = 4.60
2000 5 84.63 15.01 17.74 −2.29
10000 5 78.12 9.22 11.80 −5.31
Brassicasterol
10 5 85.22 15.99 18.76 −2.07
2000 5 110.74 12.87 11.62 1.86
10000 5 77.32 12.68 16.40 −4.00
Table 4. Free steroid levels quantified in the samplesa Retention time ± standard deviation
Steroid Free steroid in oils / (mg kg
-1)
Babassu Canola Castor Corn Cotton Crambe Moringa Palm Palm kernel Peanut Soybean Sunflower
β-Sitosterol 380 1420 1360 9680 2590 1740 3390 1510 750 2110 1680 2190
Campesterol 100 750 230 2120 180 710 1380 530 90 440 530 280
Stigmasterol 60 60 520 530 20 50 1680 250 100 170 610 270
Brassicasterol 10 190 0 0 80 340 20 40 30 10 20 0
St. 1 110 80 610 650 170 170 440 0 20 320 50 90
St. 2 0 40 0 320 0 0 0 0 0 30 190 190
St. 3 290 70 0 510 0 230 160 120 110 120 0 340
St. 4 0 0 0 30 0 0 0 0 0 0 0 0
St. 5 0 0 80 0 0 0 0 0 0 0 40 0
St. 6 0 0 0 50 0 0 0 0 0 0 0 0
St. 7 10 10 150 0 190 130 60 0 0 50 140 0
St. 8 0 0 0 0 80 0 30 0 10 10 20 0
St. 9 0 0 0 80 130 0 30 80 0 20 20 0
St. 10 0 0 0 70 30 0 30 0 0 0 0 0
St. 11 20 0 330 40 0 40 0 1330 20 110 90 90
St. 12 0 0 0 0 0 0 0 0 0 0 20 0
St. 13 0 0 0 0 0 0 0 0 0 0 20 0
St. 14 0 10 0 0 0 0 0 0 0 0 0 0
St. 15 0 20 0 100 0 0 0 0 0 0 60 0
St. 16 0 0 0 0 0 70 180 0 0 0 0 0
Totala 980
± 42.23
2650 ± 84.05
3280 ± 28.81
14180 ± 98.39
3470 ± 81.32
3480 ± 63.24
7400 ± 77.03
3860 ± 35.36
1130 ± 56.87
3390 ± 70.71
3490 ± 93.14
3450 ± 21.27
aRetention time ± standard deviation
Table 5. Data about steroid composition
Identified steroid Consideration
β-sitosterol Were identified in all oils Campesterol
Stigmasterol
Brassicasterol Sunflower, castor and corn oil can be distinguished from the other samples by their absence
St. 1 Palm oil can be distinguished from the other samples by their absence
St. 2 Canola, peanut, sunflower, soybean and corn oil can be distinguished from other samples by their presence
St. 3 Cotton, soybean and castor oil can be distinguished from other samples by their absence
St. 4 Present only in corn oil
St. 5 Soybean and castor oil can be distinguished from other samples by their presence
St. 6 Present only in corn oil
St. 7 Sunflower, palm kernel, palm and corn oil can be distinguished from the other samples by their absence
St. 8 Cotton, peanut, moringa, soybean and palm kernel oil can be distinguished from the other samples by their presence
St. 9 Cotton, peanut, moringa, soybean, palm and corn oil can be distinguished from the other samples by their presence
St. 10 Cotton, moringa and corn oil can be distinguished from the other samples by their presence
St. 11 Cotton, canola and moringa oil can be distinguished from the other samples by their absence
St. 12 Present only in soybean oil
St. 13 Present only in soybean oil
St. 14 Present only in canola oil
St. 15 Canola, soybean and corn oil can be distinguished from the other samples by their presence
principal component analysis (PCA) was used to show the
relative importance of each steroid in the discrimination.35
Using quantitative data for free steroids in various oils, a chemometric evaluation was made to correlate the types and levels of steroids present in them.Thus, a model based on principal component analysis (PCA) was used to show the relative importance of each steroid in
the discrimination.35
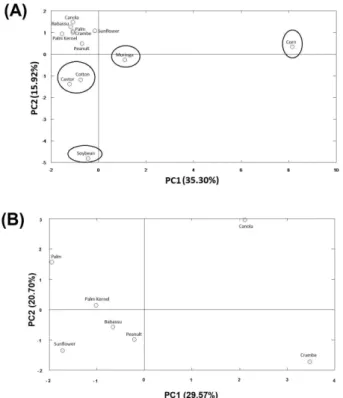
Based onpreprocessed autoscaled data, two models of PDA that could together explain the discrimination of oils in theircomposition steroids were developed. It was established that only two principal components are sufficient for the discriminationfor each model. The resulting principal component projections are shown in Figure3.
Model shown in Figure 3A hasan excellentdiscrimination of corn, moringa, soybean, castor, and cotton oils.The first two principal components account for 51.22% of the total variance for data in this model.
By loadings was realized that discrimination occurred
by the influence of steroids: β-sitosterol, campesterol,
St. 1, St. 2 , St. 3 , St. 4 , St. 5, St. 7, St.10, St. 12, and St.15. An important fact is that most significant steroids in discrimination of this model are present in higher levels in oil. Only the peculiar steroids St. 4 (corn) and St. 12 (soybean) were significant in the PCA, so the amount has influenced more than the types of steroids for that model.
The discrimination of other oils was based on the model illustrated in Figure 3B. To develop this model oils already detailed in Figure 3A were excluded from the data matrix. The first two principal components account for 50.27% of total variance for data in this model.
The loadings that contributed to discrimination of oils in this model were campesterol, stigmasterol, brassicasterol, St. 3, St. 9, St. 11, St. 15, and St. 16. The St. 15 and St. 16 are peculiar steroids that contributed to discrimination by canola and crambe, respectively. It was noticed that in this model the types of steroids were relevantin the model in Figure 3B.Palm and palm kernel despite being two different oils belonging to same oilseed, could also be well discriminated by PCA.
These results demonstrate the ability to identify the composition of different oils steroids by PCA model. This criterion of elimination was employed considering both levels as well as the types of steroids identified in oils analyzed.
Conclusions
This study has presented an efficient method for analyzing free steroids in the unsaponifiable fraction of oils. The developed method presented proper precision and accuracy. Therefore, a quality parameter was included in the method for the analysis of vegetable oils. The analyses indicate the existence of characteristic steroids and show that each oil has its own peculiar distribution. This strategy makes feasible to characterize oils by means of free steroid analysis data. This study complements previous ones since a greater variety of oils were analyzed and a larger number of steroids were characterized, since most previous studies reported the presence of only the most important and most abundant steroids. The oils analyzed in this study were correctly discriminated by PCA analysis, proving that this is an important tool in the identification of different oils according to their steroids composition.
Supplementary Information
Supplementary information (Figures S1-S16) is available free of charge at http://jbcs.sbq.org.br as PDF file.
Acknowledgments
The authors are grateful to MCT, FINEP, FUNAPE and CNPq for their financial support, to Prof. Dr. Anselmo Elcana de Oliveira to the contributions on multivariate analysis discussions and to Capes and CNPq for Kelly da
Silva Bezerra’s scholarships and Nelson Roberto Antoniosi Filho’s productivity fellowship (Grant # 309832/2010-1).
References
1. Spangenberg, J. E.; Macko, S. A.; Hunziker, J.; J. Agric. Food Chem. 1998, 46, 4179.
2. Butinar, B.; Bucar, M. M.; Valencic, V.; Raspor, P.; J. Agric. Food Chem. 2010, 58, 5227.
3. Simionato, J. I.; Garcia, J. C.; Santos, G. T.; Oliveira, C. C.; Visentainer, J. V.; Souza, N. E.; J. Braz. Chem. Soc. 2010, 21, 520.
4. Andrikopoulos, N. K.; Giannakis, I. G.; Tzamtzis, V.;
J. Chromatogr. Sci. 2001, 39, 137.
5. Hlongwane, C.; Delves, I. G. L.; Wan, W.; Ayorinde, F. O.;
Rapid Commun. Mass Spectrom. 2001, 15, 2027. 6. Bloch, K.; Nobel Lecture 1964, 79.
7. Piironen, V.; Lindsay, D. G.; Miettinen, T. A.; Toivo, J.; Lampi, A.-M.; J. Sci. Food Agric. 2000, 80, 939.
8. Bach, T. J.; Lipids 1986, 21, 82.
9. Schwartz, D. P.; J. Am. Oil Chem. Soc. 1988, 65, 246. 10. Breinholder, P.; Mosca, L.; Lindner, W.; J. Chromatogr. B 2002,
777, 67.
11. Cordeiro, P. J. M.; Vilegas, J. H. Y.; Lanças, F. M.; J. Braz. Chem. Soc. 1999, 10, 523.
12. Schrick, K.; Shiva, S.; Arpin, J. C.; Delimont, N.; Isaac, G.; Tamura, P.; Welti, R.; Lipids 2011, 47, 185.
13. Hang, J.; Dussault, P.; Steroids 2010, 75, 879.
14. Zhang, X.; Julien-David, D.; Miesch, M.; Geoffroy, P.; Raul, F.; Roussi, S.; Aoudé-Werner, D.; Marchioni, E. Steroids 2005, 70, 896.
15. Choong, Y. M.; Lin, H. J.; Chen, C. W.; Wang, M. L.; J. Food Drug. Anal. 1999,7, 279.
16. Alonso, L. J.; Fontecha, L. L.; Juárez, M.; J. Am. Oil Chem. Soc. 1997, 74, 131.
17. Gutierrez, F. I.; Albi, V. M. A.; J. Agric. Food Chem. 2000, 48, 1106.
18. Al-Ismail, K. M.; Alsaed, A. K.; Ahmad, R.; Al-Dabbas, M.;
Food Chem. 2010, 121, 1255.
19. Plank, C.; Lorbeer; J. Chromatogr. A 1994, 683, 95.
20. Phillips, K. M.; Ruggio, D. M.; Ashraf-Khorassani, M.; J. Food Lipids 2005, 12, 124.
21. Cunha, S. S.; Fernandes, J. O.; Oliveira, M. B. P. P.;
J. Chromatogr. A 2006, 22, 220.
22. Makin, H. L. J.; Honour, J. W.; Shackleton, C. H. L.; Griffiths W. J.; Steroid Analysis; Springer: New York, 2010, ch. 3. 23. Ferreira, H. E. C. S.; Elliott, W. H.; J. Chromatogr. Biomed.
1991, 562, 697.
24. Horning, E. C.; Haahti, E. O. A.; Vandenheuvel, W. J. A.; J. Am. Oil Chem. Soc. 1961, 38, 625.
25. Bhawani, S.; Sulaiman, O.; Hashim, R.; Mohamad, M. N.; Trop. J. Pharm. Res. 2010, 9, 301.
26. Brooks, C. J. W.; Phil. Trans. R. Soc. A 1979, 293, 53. 27. Cheng, M. T.; Barbalas, M. P.; Pegues, R. F.; McLafferty, F. W.;
J. Am. Oil Chem. Soc. 1983, 105, 1510.
28. Kalo, P.; Kuuranne, T.; J. Chromatogr. A. 2001, 935, 237. 29. Kasal, A.; Budesinsky, M.; Griffiths, W. J.; Steroid Analysis;
Springer: New York, 2010, ch. 2.
30. Soupas, L.; Juntunen, L.; Säynäjoki, S.; Lampi, A. M.; Piironen, V.; J. Am. Oil Chem. Soc. 2004, 81, 135.
31. Verleyen, M. T.; Verhe, K. F. R.; Huyghebaert, D. A.; Greyt, W. D.; J. Am. Oil Chem. Soc. 2002, 79, 117.
32. Lechner, M.; Reiter, B.; Lorbeer, E.; J. Chromatogr. A 1999, 857, 231.
33. Frega, N.; Bocci, B.; Lecker, G.; J. Am. Oil Chem. Soc. 1992, 69, 447.
34. Yamaya, A.; Endo, Y.; Fujimoto, K.; Kitamura, K.; Food Chem.
2007, 102, 1071.
35. Flores, I. S.; Godinho, M. S.; de Oliveira, A. E.; Alcantara, G. B.; Monteiro, M. R.; Menezes, S. M. C.; Lião, L. M.; Fuel
2012, 99, 40.
Submitted: May 13, 2013