Quim. Nova, Vol. 28, No. 1, 54-56, 2005
Artigo
*e-mail: [email protected]
DEVELOPMENT AND VALIDATION OF AN ALTERNATIVE TITRATION METHOD FOR THE DETERMINATION OF SULFATE ION IN INDINAVIR SULFATE
Breno de Carvalho e Silva, Lígia Maria Moreira de Campos and Gerson Antônio Pianetti*
Departamento de Produtos Farmacêuticos, Faculdade de Farmácia, Universidade Federal de Minas Gerais, Av. Pres. Antônio Carlos, 6627, 31270-901 Belo Horizonte - MG
Recebido em 27/1/04; aceito em 2/8/04; publicado na web em 12/11/04
A simple and rapid precipitation titration method was developed and validated to determine sulfate ion content in indinavir sulfate raw material. 0.1 mol L-1 lead nitrate volumetric solution was used as titrant employing potentiometric endpoint determination using a lead-specific electrode. The United States Pharmacopoeia Forum indicates a potentiometric method for sulfate ion quantitation using 0.1 mol L-1 lead perchlorate as titrant. Both methods were validated concerning linearity, precision and accuracy, yielding good results. The sulfate ion content found by the two validated methods was compared by the statistical t-student test, indicating that there was no statistically significant difference between the methods.
Keywords: indinavir sulfate; titration; sulfate ion content.
INTRODUCTION
Indinavir sulfate (Figure 1) is a widely prescribed HIV protease inhibitor used against acquired immune deficiency syndrome (AIDS). The drug has a molar mass of 711.88 g/mol for the sulfate salt and 613.88 g/mol for the free base. Indinavir is prescribed as sulfate salt due to the superior gastrointestinal solubility and absorption when compared with the free base. In addition, the sulfate salt, when administrated in its therapeutic dose, leads to a higher bioavailability compared to the free base administration, expressed as area under curve (AUC) and peak plasma concentration (CMAX)1-3. Indinavir sulfate is prepared by the treatment of indinavir free base monohydrate with sulfuric acid in anhydrous ethanol4.
An important quality parameter presented in literature for indinavir sulfate raw material is the quantitative determination of the sulfate ion4,5.
The sulfate ion quantitative determination must be done to confirm the ideal stoichiometric proportion between indinavir and sulfate ion. The specification range for sulfate ion is from 13.2% to 14.4%4,5. Sulfate ion outside this range could indicate that indinavir is present as free base form or that sulfate ion, in excess, is present as impurity.
The quantitation of sulfate ion in pharmaceutical substances is carried out, in international pharmacopoeias, by gravimetric analysis, accomplished by the precipitation of barium sulfate after treating the
sample with barium chloride solution. Other method used for the sulfate ion determination is the ion exchange chromatography6-8. Both methods are laborious and time consuming, besides the high economical cost of ion exchange chromatography method.
A simple and sensitive titrimetric method for the sulfate ion quantitation in indinavir sulfate raw material, based on the ion precipitation with lead by the addition of lead perchlorate volumetric solution, is described by Johnson et al.4 and by the United State Pharmacopeial Forum5. The premise of this method is based on the stoichiometric reaction of sulfate and lead ions with precipitation of lead sulfate. The excess of lead is accused by a lead-specific electrode indicating the titration endpoint potentiometrically. Despite the simplicity of this titrimetric method, lead perchlorate is not indicated as primary standard due to its characteristics of been highly hygroscopic, toxic and hazardous. For these reasons this work reports the development and validation of an alternative precipitation titrimetric method using lead nitrate volumetric solution as titrant. Lead nitrate is a dry and not hygroscopic powder, less toxic and dangerous, indicative of a better titrant than perchlorate salt.
Few volumetric methods validation procedures have been reported, for pharmaceutical products, some described by Liang et al., Marona et al. and Hassan et al.9-11. In spite of a chemical method, based on stoichiometric reaction, does not demand validation, such procedures must be applied when instrumentation is used. Commonly, analytical methods are validated according to International Conference on Harmonisation guidelines for validation of analytical procedures12. In this work the parameters evaluated were linearity, precision and accuracy. The methods can be considered specific in their essence since the specificity of the reaction between sulfate and lead ions. In addition, any inorganic impurity in the sample is present in a very low amount. The validated methods were applied for the sulfate ion quantitation in indinavir sulfate raw material and the results were compared by the statistical t-student test.
EXPERIMENTAL PART
Chemicals and solvents
55 Development and Validation of an Alternative Titration Method
Vol. 28, No. 1
Limited (Hyderabad, India). All the solvents and reagents used in the titration methods were analytical grade. Water used in the titration was distilled. Potassium sulfate (99.0%) was used to prepare standard sulfate stock solution (Merck, Germany). Lead perchlorate [Pb(ClO4)2, 98.0%] (Aldrich, USA) and lead nitrate [Pb(NO3)2, 99.7%] (J.T. Baker, USA) were used.
Instrumentation and analytical conditions
Metrohm E510 potentiometer was used in conjunction with a Metrohm lead-specific electrode (Herisau, Switzerland). Two titrimetric methods were used.
Method A specified the use of 0.1 mol L-1 lead perchlorate volumetric solution as titrant. For the preparation of the solution, 9.203 g of lead perchlorate were exactly transferred to a 200 mL volumetric flask, diluted in water and the volume completed with the same solvent. 5 mL of the result solution were transferred to a 125 mL conical flask and added 50 mL of water and, under magnetic agitation 5 drops of 0.1% (w/v) xylenol orange and 5 g of methenamine were added. The solution was standardized with 0.05 mol L-1 edetate dissodium until yellow color. Each milliliter of 0.05 mol L-1 edetate dissodium is stoichiometric related to 23.008 mg of Pb(ClO4)2.
Method B specified the use of 0.1 mol L-1 lead nitrate volumetric solution as titrant. For the preparation of the solution, 8.280 g of lead nitrate were exactly transferred to a 250 mL volumetric flask, diluted in water and the volume completed with the same solvent. 5 mL of the result solution were transferred to a 125 mL conical flask and added 50 mL of water and, under magnetic agitation 5 drops of 0.1% (w/v) xylenol orange and 5 g of methenamine were added. The solution was standardized with 0.05 mol L-1 edetate dissodium until yellow color. Each milliliter of 0.05 mol L-1 edetate dissodium is stoichiometric related to 16.560 mg of Pb(NO3)2.
Mixture of methanol and water (1:1, v/v) was used as diluent for sulfate ion standard solutions or indinavir sulfate raw material. Titrations were performed with standardized 0.1 mol L-1 lead perchlorate or 0.1 mol L-1 lead nitrate, for methods A and B, respectively. The endpoint was potentiometrically indicated using a lead-specific electrode as indicator and a silver/silver chloride electrode as reference. Each milliliter of 0.1 mol L-1 lead perchlorate or 0.1 mol L-1 lead nitrate is stoichiometric related to 9.604 mg of sulfate ion. All toxic materials were disposed of in accordance with Good Laboratory Practices.
Methods validation
For both methods, validation tests of linearity, precision and accuracy were accomplished using a standard sulfate ion stock solution prepared with potassium sulfate at the final concentration of 16.87 mg of sulfate ion per milliliter.
Linearity
The standard calibration curve was obtained with five sulfate ion solutions, 33.74, 50.61, 67.48, 84.35, 101.22 mg ml-1. Volumes of 2.0, 3.0, 4.0, 5.0 and 6.0 ml of the standard sulfate ion stock solution
were transferred to conical flasks and 80 ml of methanol/water (1:1, v/v) were added. Each calibration curve point was performed in triplicate within two consecutive days (n = 6). The linearity was estimated by linear regression analysis by the least square regression method.
Precision
The response factor, defined as the relation between consumed volume and sulfate ion quantity, was applied for the determination of repeatability (intra-day) and intermediate precision (inter-day). Repeatability was evaluated by the relative standard deviation (RSD) of the response factors calculated from the standard calibration cur-ve points (n = 15). Intermediate precision was determined within two days by comparing the response factors calculated from the standard calibration curve points obtained on the first and second day (n = 30). RSD below 2.0% is recommended for repeatability and intermediate precision.
Accuracy
The accuracy was studied by recovery of known amounts of standard sulfate ion added to indinavir sulfate raw material within two consecutive days of analysis. Volumes of 1.0, 2.0 and 4.0 mL of standard sulfate ion stock solution, corresponding to 16.87, 33.74 and 67.48 mg of sulfate ion were added to conical flasks containing 250 mg of indinavir sulfate (33.74 mg of sulfate ion) and 80 ml of methanol/water (1:1, v/v). A blank solution containing 250 mg of indinavir sulfate (33.74 mg of sulfate ion) and 80 ml of methanol/ water (1:1, v/v) was also prepared. For each recovery point the titration was performed in triplicate within two consecutive days (n = 6). The percent recovery of added sulfate ion was calculated from the volu-mes consumed in the titrations.
Statistical analysis
A solution containing 500 mg of indinavir sulfate (67.48 mg of sulfate ion) and 80 mL of methanol/water (1:1, v/v) was titrated with 0.1 mol L-1 lead perchlorate (method A) or 0.1 mol L-1 lead nitrate (method B) and the endpoint was achieved potentiometrically. Five determinations were accomplished for each method (n = 5). The statistical analysis of the equivalence between the two titrimetric methods was achieved by the t-student test, at the significance level of 0.05, using mean sulfate ion content results and respective standard deviations.
RESULTS AND DISCUSSION
Methods validation
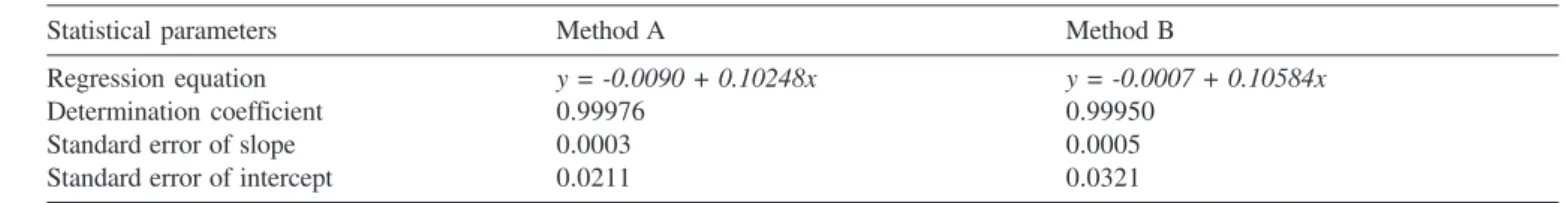
The standard sulfate ion curves, by methods A and B, obtained within two consecutive days, were constructed by plotting quantity of sulfate ion versus consumed volume of titrant. The linear regression analysis showed good linearity in the quantity sulfate ion range of 33.74 mg to 101.22 mg, with a determination coefficient over 0.999 for both methods (Table 1).
Table 1. Methods A and B linear regression analysis results for standard sulfate ion calibration curves
Statistical parameters Method A Method B
Regression equation y = -0.0090 + 0.10248x y = -0.0007 + 0.10584x
Determination coefficient 0.99976 0.99950
Standard error of slope 0.0003 0.0005
56 de Carvalho e Silva et al. Quim. Nova
proportion of indinavir free base. Furthermore, the raw material water content of 3.08% corroborates to the low sulfate ion content found.
CONCLUSIONS
The presented titrimetric methods for the quantitation of sulfate ion in indinavir sulfate raw material showed good linearity, precision and accuracy. The t-student test indicated that both methods were statistically equivalents. The method that uses 0.1 mol L-1 lead nitrate as titrant (method B) is easy to handle, less toxic and dangerous compared with the method that uses 0.1 mol L-1 lead perchlorate as titrant (method A). In that way both methods could be used for the ion analysis in routine quality control, but method B is more advisable for the sulfate ion determination in indinavir sulfate raw material.
ACKNOWLEDGEMENTS
We would like to thank the Brazilian Pharmacopoeia for financial support.
REFERENCES
1. Vacca, J. P.; Dorsey, B. D.; Schleif, W. A.; Levin, R. B.; McDaniel, S. L.; Darke, P. L.; Zugay, J.; Quintero, J. C.; Blahy, O. M.; Roth, E.; Sardana, V. V.; Schlbach, A. J.; Graham, P. I.; Condra, J. H.; Gotlib, L.; Holloway, M. K.; Lin, J.; Chen, I. W.; Vastag, K.; Ostovic, D.; Anderson, P. S.; Emini, E. A.; Huff, J. F.; Proc. Natl. Acad. Sci. U.S.A.1994, 91, 4096.
2. Yeh, K. C.; Deustsch, P. J.; Haddix, H.; Hesney, M.; Hoagland, V.; Ju, W. D.; Justice, S. J.; Osbournem B.; Sterrett, A. T.; Stone, J. A.; Woolf, E.; Waldman, S.; Antimicrob. Agents Chemother.1998, 332.
3. Patrick, A. J.; Potts, K. E.; Clin. Microbiol. Rev.1998, 11, 614.
4. Johnson, B. D.; Howard, A.; Varsolona, R.; McCauley, J.; Ellison, D. K.; Anal. Prof. Drug Substances1999, 26, 319.
5. United States Pharmacopeial Convention; Pharmacopeial Forum, Rockville, MD 2000, vol. 26, p. 1638.
6. United States Pharmacopeial Convention; United States Pharmacopeia, USP 26: NF 21, Rockville, MD 2003, p. 2126.
7. European Pharmacopoeia Commission; European Pharmacopoeia, EP 4th
ed., EDQM, Strasbourg 2001, p. 40.
8. Her Majesty’s Stationary Office; The British Pharmacopoeia, BP 2000, London 2000, A144.
9. Liang, Z.; Bonneville, C.; Senez, T.; Henderson, T.; J. Pharm. Biomed. Anal.2002, 28, 245.
10. Marona, H. R. N.; Schapoval, E. E. S.; Eur. J. Pharm. Biopharm.2001, 52, 227.
11. Hassan, S. S. M.; Ghalia, M. H. A.; Amr, A. G. E.; Mohamed, A. H. K.; Talanta 2003, 60, 81.
12. International Conference on Harmonisation (ICH); Topic Q2B, Validation of Analytical Procedures: Methodology, Proceedings of the Commission of the European Communities 1996.
The methods precision was estimated by the RSD of the response factors obtained from the linearity test results within two consecutive days. All the RSD results for repeatability and intermediate precision, for method A and method B, were below 1.0%, which indicated excellent intra-day and inter-day precision for both methods (Table 2).
The accuracy of both methods, expressed as the percent recovery of standard sulfate ion added to indinavir sulfate raw material within two consecutive days of analysis, ranged between 98.0% and 102.0%, indicating good accuracy of both methods (Table 3).
Statistical analysis
The titrimetric methods described were applied for the quantitation of sulfate ion in indinavir sulfate raw material. The results were compared by t-student test for the evaluation of the statistical equivalence between the methods (Table 4). The calculated p-value was greater than the level of significance (0.05) for both methods. The t-student test did not reveal significant statistical difference between the experimental values obtained in the sample assayed by the two methods. The results indicated that both methods could be used to quantify sulfate ion in indinavir sulfate raw material. The mean values obtained (12.85% and 12.83%) were outside the specification range sulfate ion (13.2% to 14.4%) indicating that the studied indinavir sulfate raw material could had an undesirable
Table 4. Methods A and B statistical t-student test results for sulfate ion content in indinavir sulfate raw material
Methods Sulfate ion content RSD (%) t-test p-value % (n = 5)
A 12.85 0.19 1.195 0.298
B 12.83 0.27
Table 3. Methods A and B percent recovery results of standard sul-fate ion added to indinavir sulsul-fate raw material
Method Added standard Percent recovery RSD (%)
sulfate ion (mg) (n = 6)
A 16.87 98.32 0.27
33.74 99.31 0.62
67.48 99.19 0.24
B 16.87 98.03 0.53
33.74 99.08 0.18
67.48 100.55 0.10
Table 2. Methods A and B intra-day and inter-day precision results for standard sulfate ion solutions
Method Precision test Average response RSD (%)
factor
A Intra-day (day 1); n = 15 0.1020 0.39
Intra-day (day 2); n = 15 0.1027 0.41
Inter-day; n = 30 0.1023 0.51
B Intra-day (day 1); n = 15 0.1061 0.91
Intra-day (day 2); n = 15 0.1055 0.61