A
r
ti
c
le
*e-mail: [email protected]
Validation of a Method using Solid Phase Extraction and Liquid Chromatography
for the Determination of Pesticide Residues in Groundwaters
Sergiane S. Caldas, Adriana Demoliner and Ednei G. Primel*
Escola de Química e Alimentos, Programa de Pós-Graduação em Química Tecnológica e Ambiental, Universidade Federal do Rio Grande - FURG, Av Itália, km 8 s/n, 96201-900 Rio Grande-RS, Brazil
Neste trabalho, um método para determinação dos agrotóxicos carbofurano, clomazona, 2,4-D e tebuconazol em águas subterrâneas é descrito. O método utiliza a Extração em Fase Sólida (EFS) com cartuchos de C18 e quantificação por Cromatografia Líquida de Alta eficiência com Detector de Arranjo de Diodos (CLAE-DAD). Após a otimização dos parâmetros de extração e separação dos compostos, o método foi validado avaliando-se curva analítica, linearidade, limites de detecção e quantificação, precisão e exatidão (recuperação). O método apresentou recuperações médias de 87,9% e 96,9%, para a repetibilidade e precisão intermediária, respectivamente, com RSD de 0,8 a 20,7% para todos os compostos. O método será empregado na determinação de agrotóxicos em águas subterrâneas com um limite de quantificação de 0,2 µg L-1.
A method is described for the determination of the pesticides carbofuran, clomazone, 2,4-D and tebuconazole in groundwaters. The method involves solid phase extraction (SPE) with C18 cartridges and quantification by high performance liquid chromatography with diode array detector (HPLC-DAD). After the optimization of the extraction and separation parameters, the method was validated by evaluating the analytical curve, linearity, limits of detection and quantification, precision and accuracy (recovery). The method presents an average recovery of 87.9% and 96.9%, in repeatability and intermediate precision conditions, respectively, with adequate precision (RSD from 0.8 to 20.7%), for all compounds. The method will be applied to determine pesticides in groundwater samples with limit of quantification of 0.2 µg L-1.
Keywords: pesticides, groundwater, HPLC-DAD, SPE, validation
Introduction
A group of artificially synthesized substances, called pesticides, has been used in agriculture to control pests
and to increase production.1 These substances protect the
agricultural crops, but overuse and incorrect use can pose
risks to human health and the environment.2,3
Brazil ranks eighth in pesticide use in the world,4 and Rio
Grande do Sul State is responsible for 10.4% of pesticide
consumption in Brazil.5 Many researchers have analyzed
the residue of pesticides in water samples.6-8 The pesticides
2,4-D, clomazone, tebuconazole and carbofuran are often used in the regional agriculture of Rio Grande do Sul.
The increase in the amount and variety of products applied to agriculture makes it necessary to monitor residues
in the environment;9 therefore, the analysis of pesticides has
received increasing attention in the last few decades.
Groundwater represents an important source of drinking water supply in many countries, and the use of pesticides in agricultural areas may lead to its contamination by
drift, runoff, drainage and leaching.10 The groundwater
contamination by pesticides has been documented in many
papers around the world.10-14
For many years, the pesticide analysis in environment samples has attracted the attention due to the wide use of such compounds, as well as its environmental impact. The European Union establishes rigid limits for pesticides in water destined to human consumption, establishing
0.1 µg L-1 for individual pesticides and 0.5 µg L-1 for the
sum of all pesticides. In the case of surface water that will be treated for human consumption, the maximum
limits allowed are 1 µg L-1 for individual pesticides and
5 µg L-1 for the total pesticides.15 In Brazil, Law No. 518,
concentration accepted for each individual pesticide in
water bodies.16,17 The Brazilian legislation does not include
the pesticides carbofuran, clomazone and tebuconazole,
and for 2,4-D the maximum value accepted is 30 µg L-1 for
drinking waters and 4 µg L-1 accepted for water bodies.
Due to the low detection levels required by regulatory bodies and the complex nature of the matrices in which the target compounds are present, efficient sample preparation and trace-level detection and identification are important
aspects of analytical methods.18 However, in order to reach
the low concentration levels permitted in potable water, a preliminary concentration step is required before the
chromatographic analysis.14
Pesticide in water samples are usually enriched by
liquid-liquid extraction (LLE)19,20 or solid phase extraction
(SPE).10,21 The conventional liquid-liquid extraction often
needs large amounts of toxic solvent and a time-consuming
procedure,22 while SPE is simple, fast and consumes very
small volumes of high purity solvents.20 Nowadays, SPE
is the most appropriate method for the enrichment of
pesticides in aqueous matrices.18,23
Gas chromatography (GC) and high performance liquid chromatography (HPLC) coupled with various detection systems are the most powerful tools for the analysis
of pesticides in water.14,24-28 However, many classes of
pesticide that have polar characteristics, low volatility or thermal instability, cannot be analyzed directly by GC and require special conditions such as derivatisation procedures. Liquid chromatography (LC) is the preferred approach for these polar and thermally labile pesticides, with a conventional UV detection or diode array detection
(DAD).29 The pesticides carbofuran, 2,4-D, clomazone
and tebuconazole (Figure 1) have been studied by many
authors by HPLC.28,30,31
The use of liquid chromatography combined with mass spectrometry (LC-MS-MS) has been proposed for
determining some of these pesticides.32-34 These methods
are much more specific and sensitive analytical techniques, but they are not affordable in most research laboratories because of the high cost of the equipment.
To guarantee that an analytical procedure gives reliable, exact and interpretable information about a sample, it must be validated. Therefore, diverse analytical methods for determination of pesticide residues have been developed
and validated;20,33,35 they describe definitions, procedures,
parameters and strategies for validation. The analytical parameters normally found for validation of separation methods are: selectivity, linearity and range, precision, accuracy, limit of
detection, limit of quantification and robustness.36
This paper reports a simple, relatively fast, and efficient SPE and HPLC-DAD method which was developed for the determination of carbofuran, clomazone, 2,4-D and tebuconazole in groundwaters. To obtain efficient pre-concentration with good precision and recovery, a C18 solid phase extraction system was applied. The method was validated and the parameters involved in the validation were calibration, linearity and range, limit of detection (LOD) and quantification (LOQ), precision (repeatability and intermediate precision), and accuracy (recovery). The proposed method will be used for the determination of pesticide residues in groundwaters, in an agricultural area in Rio Grande, Rio Grande do Sul State, Brazil.
Experimental
Chemicals
Carbofuran, clomazone, tebuconazole and 2,4-D analytical standard (purity > 99%) were supplied by Sigma Aldrich (São Paulo, Brazil). HPLC grade methanol and acetonitrile were supplied by Mallinckrodt (Phillisburg, NJ, USA). Phosphoric acid (85%) of analytical grade, by
Merck (Darmstadt, Germany). Water was purified with a
Direct-Q UV3® (resistivity 18.2 MΩ cm, Millipore, USA)
water purification system (Millipore, Bedford, MA, USA). The SPE extraction cartridges were octadecylsilane (Strata C18-E) with 200 mg of phase in cartridges and another polymeric Strata-X (copolymer of styrene-divinylbenzene with modified surface) with 200 mg of phase, both from Phenomenex (Torrance, CA, USA).
Equipment
To determine the optimum conditions of separation, two columns were tested, Spherisorb ODS2 5 µm 80 Å (150 × 4.6 mm), Waters, and Hyperclone BDS C18 5 µm 130 Å (250 × 4.6 mm), Phenomenex.
Different mobile phases comprising several combinations of methanol, acetonitrile and purified water were tested to provide sufficient resolution. The pH of the mobile phase was adjusted with the use of a Hanna pH 21, pHmeter.
Separation was performed using an HPLC apparatus consisting of a column Hyperclone BDS C18 5 µm 130 Å (250 × 4.6 mm I.D), from Phenomenex, a Waters 600 pump model, associated with a Waters 2996 Photodiode Array Detector, Rheodyne 20 µL loop injector, connected to an Empower PDA software for data acquisition.
The analytical column was conditioned by passing the mobile phase through it for 1 h at a flow-rate of
0.8 mL min-1 and the analytical column was operated at
ambient temperature. The flow-rate was set at 0.8 mL min-1
and quantification was carried out with DAD detection at 220.3 nm.
The identification of the four substances in the samples was accomplished on the basis of their retention times and by comparison between the DAD spectrum of the compounds in the standard solutions and the DAD spectrum of the detected peak in the sample.
Preparation of solutions and mobile phases
Individual pesticide stock solutions containing
1000 mg L-1 of the target compounds were prepared in
methanol and stored at −18 °C. Intermediate working
standards mixtures in methanol, containing 100 mg L-1 for
each pesticide were prepared and used to prepare the working standard solutions containing 10, 7.5, 5.0, 2.5, 1.25, 0.62,
0.31, 0.15, 0.07 and 0.05 mg L-1, that was used for spiking
samples and to prepare the analytical curves. Working standard solutions were prepared monthly, while the dilutions used for the analytical curves were prepared daily.
The mobile phase consisted of acetonitrile and purified water adjusted to pH 3.0 with phosphoric acid. The mobile
phases were degassed for 30 min in an ultrasonic bath before use.
Solid phase extraction procedure
The optimization of the extraction procedure included the type of the adsorbent. Two different sorbents were tested: octadecylsilane (Strata C18-E) with 200 mg of phase in cartridges and an average particle size of 55 µm and another polymeric Strata-X (copolymer of styrene-divinylbenzene with modified surface) containing 200 mg of phase in cartridges of 3 mL and an average particle size of 33 µm. All the experiments were repeated at least in triplicate.
A 250 mL volume of tap water sample was fortified by the addition of an established volume of solution with
10.0 mg L-1 of each pesticide, resulting in four levels of
fortification 0.2, 1.25, 5.0 and 10.0 µg L-1. Before sample
application, the SPE column was conditioned by 3 mL of methanol, 3 mL of purified water and 3 mL of purified water at pH 3.0, acidified with phosphoric acid 1:1 (v/v). After the conditioning step, aliquots of 250 mL of water samples, acidified at pH 3.0 with phosphoric acid (to increase the pesticide retention in the SPE cartridge) were
loaded through the cartridges with a flow rate of 6 mL min-1.
After that, the analytes were eluted with 1 mL (2 × 500 µL) of methanol, the volume was adjusted in 1 mL and injected into the chromatographic system.
Method validation
A validation process was carried out to confirm the suitability of the method for the intended use. The concepts of validation continue evolving and are constantly under
consideration by regulating agencies.37 Once the best
conditions for the analysis of the pesticides were defined, the validation of the method was carried out according to parameters described as follows.
Analytical curves and linearity
Linearity corresponds to the capacity of the method to supply results directly proportional to the concentration of the substance under investigation, within one determined
application range.38,39 Range is the interval between the upper
and the lower levels of analyte that have been demonstrated to be determined with precision, accuracy and linearity
using the method as written.39 The linearity of a method
correlation coefficient r > 0.99. The analytical curves and linearity of the detector response for the test compounds was evaluated by injecting a total of ten calibration working standard solutions in the concentration levels 0.05, 0.07,
0.15, 0.31, 0.62, 1.25, 2.5, 5.0, 7.5 and 10.0 mg L-1 with
three replicate injections per concentration.
Limit of detection (LOD) and quantification (LOQ)
LOD is the lowest concentration of analyte that can be detected and reliably distinguished from zero (or the noise level of the system), but not necessarily quantified; the concentration at which a measured value is larger
than the uncertainty associated with it,40 and the limit of
quantification (LOQ) is the lowest solute concentration that can be determined with acceptable precision and accuracy, under the stated experimental conditions. It is also expressed in concentration units. In this study, LOD and LOQ were determined considering the LOD as 3 times the baseline noise and the LOQ as the concentration that produced a signal 10 times the baseline noise, in a time
close to the retention time of the analyte.36
Precision and accuracy
Precision represents the dispersion of results between independent assays, repetition of the same samples, similar
samples or standards, under definite conditions.41,42
The precision is evaluated in terms of repeatability (RSDr) and intermediate precision (RSDip) and generally
is expressed as relative standard deviation (RSD).37,43
Precision (repeatability) is an important criterion for evaluating the analytical method performance. It is the degree of agreement among individual test results when the procedure is applied repeatedly. The precision is usually
expressed as the relative standard deviation (RSD).44
The precision in terms of repeatability was obtained by carrying out the extraction and analysis of fortified samples. Each spike level was extracted in three replicates and each extract injected three times. To evaluate the intermediate precision of the method, different days and operators were
used, only for spiked levels of 5.0 and 10.0 µg L-1.
To evaluate the instrument precision, intra-day and inter-day precision was calculated by measuring the areas of the peaks obtained from three injections of three different concentrations in the same day, and in different days and operators, respectively.
The accuracy of the analytical method is the proximity of the results obtained for the method under investigation in relation to the true value. In pesticide residue analysis, the accuracy normally is evaluated by carrying out recovery
assays.37,44 Recovery was determined at four concentrations,
in accordance with the recommendations of the International Conference on Harmonisation (ICH) and Brazilian National Agency of Sanitary Vigilance (ANVISA), by adding known amounts of the reference substance at the beginning of the process. Analyses were carried out in three replicates of “blank” surface water samples spiked at four different
levels (0.2, 1.25, 5.0 and 10.0 µg L-1). The accuracy of the
method should be within 70 and 120% at all concentrations
with RSD < 20%.37
Results and Discussion
Optimization of the chromatographic parameters and HPLC-DAD procedure
The optimum conditions of separation were better with the column Hyperclone BDS C18 5 µm 130 Å (250 × 4.6 mm) from Phenomenex because, in this case, a good peak shape and acceptable retention times were obtained. The water pH was adjusted to 3.0, because this pH provided optimum selectivity.
Several mixtures of mobile phases were tested. The mixtures with greater proportion of methanol, such as methanol:water (70:30, v/v) were not satisfactory because some substances were detected in a short time, before 5 min. This is not very good because the samples contain a relatively high concentration of anions and humic and fulvic acids that produce a high DAD response in the early part of the chromatogram. However, in proportions such as methanol:water (40:60, v/v), with a lower percentage of methanol, some compounds were detected in a long time, the same that had occurred with using a mixture of methanol, acetonitrile and water (30:24:46, v/v/v), where the results were not satisfactory because the pesticide tebuconazole was detected in a time longer than 20 min. Since run time is very important, we tried to find a shorter run time.
Unsatisfactory resolution was obtained for carbofuran and 2,4-D when the mobile phase was acetonitrile:water (60:40, v/v) pH 3.0, because co-eluting substances and the peaks were not ideal.
The gradient elution of the mobile phase was not satisfactory and we used an isocratic elution with a programation of the flow rate of the mobile phases, where the peaks were well resolved within acceptable retention time. The effective separation of the peaks in the chromatogram was achieved when the mobile phase composition were acetonitrile:water (52:48, v/v), pH 3.0
acidified with H3PO4 1:1; using a programming of the flow
rate of 0.8 mL min-1 to 8 min, increasing for 1.2 mL min-1
When we used a programation of a flow rate of mobile phases, the run time was increased but the peaks were not co-eluting, resulting in the most satisfactory resolution for the four substances.
Method validation
Data of analytical curves were performed using ten different concentrations ranged between 0.05 and
10.0 mg L-1 of each substance with three replicate injections
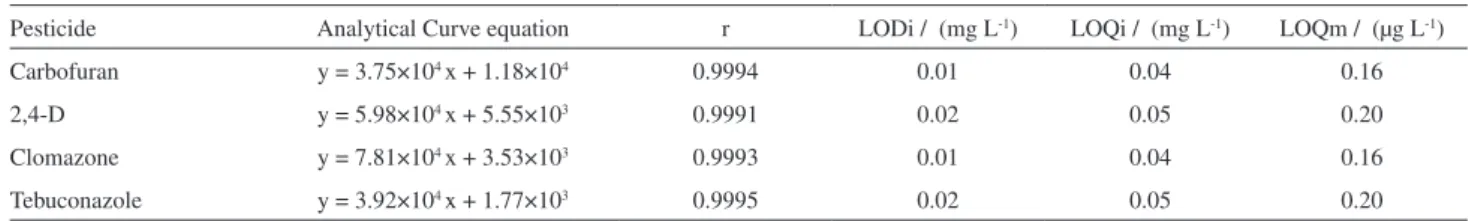
per concentration. Linear relationships between the ratios of the peak area signals and the corresponding concentrations were observed. The parameters of the analytical curves with the correlation coefficients are presented in Table 1. The values of the correlation coefficients were in accordance with the acceptable values of the ANVISA and Instituto Nacional de Metrologia, Normalização e Qualidade
Industrial (INMETRO).41,42
By comparison of the response with the baseline noise, the LOD for the mixture of pesticides were between 0.01
and 0.02 mg L-1 and the LOQ were between 0.04 and
0.05 mg L-1. After the 250-fold SPE pre-concentration step
the effective LOQ for the samples was 0.2 µg L-1, value
that was below the maximum residue limit established by the European Union for the sum of all pesticides, and the values established for some pesticides in Brazilian
legislation.15-17
Solid phase extraction prior to chromatographic determination was used in order to achieve a more sensitive method for the quantification of these pesticides. To accomplish this, samples of tap water were spiked with the pesticides at a concentration level range between 0.2
to 10.0 µg L-1.
The results from the optimization of the extraction procedure are shown in Table 2. Recoveries for all the compounds resulted in values ranged between 60.3% and 107.7%, using Strata X C18-E cartridges with good reproducibility RSD less than 20.7%, in the range of the
acceptable values.37 In consonance with other studies the
extraction of 2,4 D and clomazone showed good recoveries
with C18.7,25
The recoveries using polymeric cartridges were not satisfactory, mainly the ones for 2,4-D and clomazone, which present recoveries lower than 40%.
The method precision was measured by comparing the standard deviation of the response for nine injections of the four different calibration standard solutions (0.2, 1.25,
5.0 and 10.0 mg L-1), evaluated in terms of repeatability
(RSDr) and for two different calibration standard solutions
(5.0 and 10.0 mg L-1) in terms of intermediate precision
(RSDip). Table 2 summarizes the results of recovery and precision of the developed method, which presented satisfactory values.
Intra-day precision was calculated by measuring the areas of the peaks obtained from three injections of three
analytical standard solutions (0.625, 2.5 and 7.5 mg L-1) in
the same day, and inter-day values were taken in 10 days over a 2 month period. The precision was expressed as the percentage of the relative standard deviation (RSD). The values for the three different concentrations were ranged from 0.7-4.6% and 1.2-8.6% for intra- and inter-day values, respectively.
Applicability of the method
After the optimization and validation, the method was applied to real samples, to evaluate its applicability. The samples were collected in ten wells, located in an agricultural area in Rio Grande, the same region where a monitoring study of carbofuran, 2,4-D, clomazone and tebuconazole will be implemented for the period of one year. The groundwater samples were analyzed with the methodology described in this paper and the samples that gave negative findings for pesticides were spiked with
5.0 µg L-1 of all compounds and analyzed according to the
procedure described.
The method was also successfully used for the determination of four pesticides in well water samples, demonstrating the usefulness of the developed method. The chromatogram of well water blank and spiked well water samples can be observed in Figure 2, with their identification spectra of the detected compounds.
Table 1. Parameters of the analytical curve: equation, regression coeficient, instrumental limits of detection (LODi) and quantification (LOQi) and limit
of quantification of the method (LOQm)
Pesticide Analytical Curve equation r LODi / (mg L-1) LOQi / (mg L-1) LOQm / (µg L-1)
Carbofuran y = 3.75×10⁴ x + 1.18×10⁴ 0.9994 0.01 0.04 0.16
2,4-D y = 5.98×10⁴ x + 5.55×10³ 0.9991 0.02 0.05 0.20
Clomazone y = 7.81×10⁴ x + 3.53×10³ 0.9993 0.01 0.04 0.16
Conclusions
The proposed HPLC-DAD method has been evaluated in terms of linearity, precision and accuracy, in a concentration
range of 0.05 to 10.0 mg L-1, with a correlation coefficient
higher than 0.9991. The method presented an average recovery of 87.9% and 96.9%, in repeatability and intermediate precision conditions for all compounds. It Table 2. Recovery, repeatability (RSDr) and intermediate precision (RSDip), of the method, for mixture of carbofuran, 2,4-D, clomazone and tebuconazole
in tap water spiked at different levels
Pesticide Spiked level / (µg L-1) Recovery / (%) RSDr/ (%) Recovery / (%) RSDip / (%)
Carbofuran 0.20
1.25 5.00 10.00
101.4 66.7 89.8 93.7
19.4 20.7 5.0 12.3
-94.2 115.3
-20.6 19.4
2,4-D 0.20
1.25 5.00 10.00
60.3 88.7 74.4 82.7
12.8 1.0 13.1
5.0
-67.5 83.5
-2.1 0.8
Clomazone 0.20
1.25 5.00 10.00
101.8 84.4 101.1 104.3
16.2 13.2 5.7 6.6
-103.9 100.3
-2.8 3.1
Tebuconazole 0.20
1.25 5.00 10.00
98.6 100.3 107.7 92.0
17.1 19.0 8.4 2.8
-97.8 113.2
-4.7 2.7
-: in these levels, there are no tests for intermediate precision.
Figure 2. Chromatograms obtained from groundwater samples: (dash dot line) blank of groundwater at 220.3 nm and (solid line) groundwater sample spiked with 5 µg L-1 mixture of pesticides with their identification spectra of the detected compounds, at the best chromatographic conditions: acetonitrile:water
offers good accuracy and precision to determine pesticides in groundwater. The short analytical run time of 15.0 min leads to an effective cost and fast chromatographic procedure. Thus, the proposed methodology is rapid and selective with a simple sample preparation procedure that could be used for the convenient and effective determination of pesticide residue in groundwater samples.
Acknowledgments
The authors acknowledge CNPq, FINEP and FAPERGS for the financial support.
References
1. Acero, J. L.; Benítez, F. J.; Real, F. J.; González, M.; J. Hazard. Mater.2008, 153, 320.
2. Spadotto, C. A.; Gomes, M. A. F.; Luchini, L. C.; Andréa, M. M.; Monitoramento do Risco Ambiental de Agrotóxicos: Príncipios
e Recomendações, Embrapa Meio Ambiente: Jaguariúna, 2004, p. 29.
3. Coutinho, C. F. B.; Tanimoto, S. T.; Galli, A.; Garbellini, G. S.; Takayama, M.; Amaral, R. B.; Mazo, L. H.; Avaca, L. A.; Machado, S. A. S.; Pesticidas: Revista de Ecotoxicologia e Meio Ambiente
2005, 15, 65.
4. SINDAG; Sindicato Nacional da Indústria de Produtos para Defesa Agrícola; 2002, available at http://www.sindag.com.br, accessed in July 2007.
5. SINDAG; Sindicato Nacional da Indústria de Produtos para Defesa Agrícola; 2006, available at http://www.sindag.com.br, accessed in August 2007.
6. Filizola, H. F.; Ferracini, V. L.; Sans, L. M. A.; Gomes, M. A. F.; Ferreira, C. J. A.; Pesq. Agropec. Bras. 2002, 37, 659. 7. Primel, E. G.; Zanella, R.; Kurz, M. H. S.; Gonçalves, F. F.;
Machado, S. O.; Marchezan, E.; Quim. Nova2005, 28, 605. 8. Raposo Júnior, J. L.; Ré-Poppi, N.; Talanta 2007, 721, 1833. 9. Brito, N. M.; Amarante Jr., O. P.; Santos, R. A. T. C. R.; Ribeiro,
M. L.; Pesticidas: Revista de Ecotoxicologia e Meio Ambiente
2001, 11, 93.
10. Cerejeira, M. J.; Viana, P.; Batista, S.; Pereira, T.; Silva, E.; Valério, M. J.; Silva, A.; Ferreira, M.; Silva-Fernandes, A. M.; Water Res.2003, 37, 1055.
11. Battaglin, W. A.; Furlong, E. T.; Burkhardt, M. R.; Peter, C. J.; Sci. Total Environ.2000, 248, 123.
12. Carabias-Martínez, R.; Rodríguez-Gonzalo, E.; Herrero-Hernández, E.; Sánchez-San Román, F. J.; Flores, M. G. P.; J. Chromatogr., A2002, 950, 157.
13. Guzzella, L.; Pozzoni, F.; Giuliano, G.; Environ. Pollut. 2006,
142, 344.
14. D’Archivio, A. A.; Fanelli, M.; Mazzeo, P.; Ruggieri, F.; Talanta
2007, 71, 25.
15. Alda, M. L.; Kuster, M.; Barceló, D.; Mass Spectrom. Rev.2006, 25, 900.
16. Ministério da Saúde. Portaria No. 518, de 25 de março de 2004. Diário Oficial da União, 26 março. Ministry of Health, Brazil.
17. Ministério do Meio Ambiente. Conselho Nacional do Meio Ambiente (CONAMA). Resolução no 357, de 17 março de 2005. Classificação dos corpos de água e diretrizes ambientais para o seu enquadramento bem como estabelece condições e padrões de lançamento de efluentes. Diário Oficial da União, 18 março 2005. Ministry of Environment, National Council of Environment, Brazil.
18. Picó, Y.; Fernández, M.; Ruiz, M. J.; Font, G.; J. Biochem. Biophys. Methods 2007, 70, 117.
19. Ferracini, V. L.; Queiroz, S. C. N.; Gomes, M. A. F.; Santos, G. L.; Quim. Nova2005, 28, 380.
20. Brondi, S. H. G.; Lanças, F. M.; J. Braz. Chem. Soc.2005, 16, 650.
21. Azevedo, D. A.; Gerchon, E.; Reis, E. O.; J. Braz. Chem. Soc.
2004, 15, 292.
22. Ahmadi, F.; Assadi, Y.; Milani Hosseini, S. M. R.; Rezaee, M.; J. Chromatogr., A 2006, 1101, 307.
23. Bruzzoniti, M. C.; Sarzanini, C.; Costantino, G.; Fungi, M.; Anal. Chim. Acta2006, 578, 241.
24. Ahmed, F. E.; Trends Anal. Chem. 2001, 20, 649.
25. Palma, G.; Sánchez, A.; Olave, Y.; Encina, F.; Palma, R.; Barra, R.; Chemosphere 2004, 57, 763.
26. Sánchez-Ortega, A.; Sampedro, M. C.; Unceta, N.; Goicolea, M. A.; Barrio, R. J.; J. Chromatogr., A 2005, 1094, 70. 27. He, Y.; Lee, H. K.; J. Chromatogr., A2006, 1122, 7.
28. Tran, A. T. K.; Hyne, R. V.; Doble, P.; Chemosphere 2007, 67, 944.
29. Carabias-Martínez, R.; Rodríguez-Gonzalo, E.; Herrero-Hernández, E.; Hernández-Méndez, J.; Anal. Chim. Acta2004,
517, 71.
30. Miyauchia, T.; Moria, M.; Itob, K.; J. Chromatogr., A2005,
1063, 137.
31. Cid, A. P.; Del Mundo, F. R.; Espino, M. P. B.; Philippine Agric. Scientist2006, 89, 71.
32. Sannino, A.; Bolzoni, L.; Bandini, M.; J. Chromatogr., A2004,
1036, 161.
33. Rodrigues, A. M.; Ferreira, V.; Cardoso, V. V.; Ferreira, E.; Benoliel, M. J.; J. Chromatogr., A 2007, 1150, 267.
34. Pirard, C.; Widart, J.; Nguyen, B. K.; Deleuze, C.; Heudt, L.; Haubruge, E.; De Pauw, E.; Focant, J. F.; J. Chromatogr., A
2007, 1152, 116.
35. Beceiro-González, E.; Concha-Graña, E.; Guimaraes, A.; Gonçalves, C.; Muniategui-Lorenzo, S.; Alpendurada, M. F.; J. Chromatogr., A 2007, 1141, 165.
36. Ribani, M.; Collins, C. H.; Bottoli, C. B. G.; J. Chromatogr., A
37. Ribani, M.; Bottoli, C. B. G.; Collins, C. H.; Jardim, I. C. S. F.; Melo, L. F. C.; Quim. Nova2004, 27, 771.
38. International Conference on Harmonisation (ICH), Validation of Analytical Procedures: Definitions and Terminology, Q2A (CPMP/ICH/381/95), 1995.
39. Shabir, G.A.; J. Chromatogr., A 2003, 987, 57.
40. González, A. G.; Herrador, M. A.; TrAC, Trends Anal. Chem.
2007, 26, 227.
41. Instituto Nacional de Metrologia, Normalização e Qualidade Industrial (INMETRO); Orientações sobre Validacão de Métodos de Ensaios Químicos, DOQ-CGCRE-008, 2003.
42. Agência Nacional de Vigilância Sanitária (ANVISA); Guia para Validação de Métodos Analíticos e Bioanalíticos, Resolução RE No. 899, 2003. -National Health Surveillance Agency, Brazil. 43. Zanella, R.; Primel, E. G.; Gonçalves, F. F.; Martins, A. F.;
J. Chromatogr., A2000, 904, 257.
44. International Conference on Harmonisation (ICH), Validation of Analytical: Methodology, Q2B (CPMP/ICH/281/95), 1996.
Received: March 12, 2008