The Causes of Fiscal Transparency: Evidence in the Brazilian States
Robson Zuccolotto
Professor, Department of Business Administration and Accounting Sciences Federal University of Viçosa E-mail: [email protected]
Marco Antonio Carvalho Teixeira
Professor, Department of Public Management Getulio Vargas Foundation E-mail: [email protected]
Received on 02.21.2013-Desk acceptance on 02.25.2013-6th version accepted on 07.23.2014.
ABSTRACT
The transparency of governments to their citizens is seen as a necessary factor in democratic accountability and, consequently, in the con-solidation of democracy. Although the importance of transparency in government is often highlighted, its causes are still unknown, espe-cially in the Brazilian context. Following the trend of international empirical research, this exploratory study investigates the relationships between three sets of variables (current and past fiscal variables, socioeconomic variables and political variables) and fiscal transparency in the Brazilian subnational context. To identify the relationship between fiscal, socioeconomic and political variables and fiscal transpa-rency, the multiple linear regression technique was used. Prior to conducting the regression using the method of ordinary least squares, factor analysis was used, aiming to group the fiscal and socioeconomic variables into factors not only to reduce their quantity but also to eliminate their multicollinearity problems. Political variables, due to their qualitative nature, remained in their original form. The factor analysis sorted the variables into two groups: fiscal and socioeconomic factors. Because multiple regression allows only for the evaluation of the relationship between the parties included in the sample and the reference party, an F test was used to assess differences in the level of transparency among political parties. The results indicated that fiscal and socioeconomic variables explain the transparency levels of the Brazilian States. However, the political variables were not significant, indicating that the disclosure of fiscal information in Brazil seems not to be influenced by political ideologies. Furthermore, it is evident that the lack of a regulatory model of transparency in the budget process leads States to disclose a great deal of information about budget execution. Finally, the findings indicate that as an instrument for democratic consolidation, fiscal transparency remains incipient in Brazil.
Keywords: Fiscal transparency. Democratic accountability. Political parties. Subnational government.
1 INTRODUCTION
Because of these transformations, the Code of Good Practices on Fiscal Transparency was implemented by the Organization for Economic Cooperation and Development (OECD) and the International Monetary Fund (IMF), whose purpose is to guide countries to greater openness in the decision process related to their iscal policies.
Brazil followed this trend. Its administrative State re-form, drated in 1995, enabled modernization of the ad-ministrative structure with the implementation of commu-nication tools such as e-government. More recently, with the approval of the so-called Transparency Law (Comple-mentary Law 131/2009), the federal government, the states and the municipalities were required to present all of their expenses in a transparent manner. Because of this law, sin-ce May 2010, the federal government, states and municipa-lities with more than 100,000 inhabitants have been obliga-ted to maintain and update transparency portals on public spending, whereas municipalities with a population be-tween 50,000 and 100,000 inhabitants had until the end of 2011 to comply with the law. For municipalities with fewer than 50,000 inhabitants, the deadline was set for May 2013.
However, according to research by the Institute for Socioeconomic Studies [Instituto de Estudos Socioeconô-micos-INESC] (2011), no Brazilian capital fully complied with Complementary Act 131/2009 until the end of 2010. News published in the Folha de São Paulo newspaper2
sho-ws the same situation in municipalities with populations of 50,000-100,000 inhabitants, however, no studies were pu-blished on the theme. According to Complementary Law 131/2009, entities that did not provide their budgetary and inancial information within the deadlines set would be forbidden from receiving voluntary transfers (federal mo-ney) while non-compliant. Currently, there are no known cases of transfers not having been performed due to non-compliance with the law.
In addition to Complementary Law 131/2009, Law 12.527/2011 advocates the following measures: (1) the consolidation and deinition of a regulatory framework for access to public information in the custody of the State; (2) the establishment of procedures for the public adminis-tration to respond to citizen requests for information; and (3) the determination that access to public information is the rule and not the exception. hus, this legal instrument should constitute one of the bases to build the transparency and expansion process of social control over public afairs and to make Brazil one of the 89 countries with a law on access to public information.
Despite legal eforts, studies conducted in Brazil (Akutsu & Pinho, 2002; INESC, 2011; Loureiro, Teixei-ra, & Moraes, 2009; Pinho, 2006; Santana Junior, 2008) and overseas (Caamaño- Alegre et al., 2013; Herawaty & Hoque, 2007; Justice, 2006; Pérez, Bolivar, & Hernandez, Although the term “iscal transparency” is recent and
has been in the spotlight in recent years, the primary con-cern related to the term has a long history. he formation of the liberal state and representative democracies encou-raged the ight against the opacity that prevailed in monar-chical regimes and the legislative branch’s establishment of executive-branch accountability.
In recent decades, however, the expression “iscal trans-parency” seems to have become ubiquitous, and its appli-cation has transformed into something bigger than the accountability of the executive branch by the legislative branch, incorporating aspects related to market require-ments, civil demands from civil society and citizen parti-cipation in establishing public budgets (Caamaño-Alegre, Lago-Peñas, Reyes-Santias, & Santiago-Boubeta, 2013). Considering the Spanish context, the authors emphasi-ze that in the subnational context, the importance of is-cal transparency cannot be underestimated given that-as paradoxical as it may seem-the globalization process has strengthened the role of local government in the develo-pment and management of public policies, which has led to substantial changes in the public management process, including, inter alia, a focus on service quality, decentrali-zation, management professionalization and privatization. In Brazil, as stated by Loureiro, Teixeira and Prado (2008), this process may have been partly inluenced by globalization, but the big push for transparency began with the Federal Constitution (FC) of 1988’s establishment of ar-ticle 5, paragraph XXXIII, which states that all people have the right to receive information of particular interest or of collective or general interest from government agencies, to be provided within the period established by the law, sub-ject to liability, except for information whose secrecy is es-sential to the security of society and the State. In addition, article 37 deines the form of user participation in direct and indirect public administration; and in article 216, the responsibility of public administration for the management of the government is deined1. he FC of 1988 also returned
federative autonomy to the states; until then, the states, un-der the Constitution of 1967, were subject to the authority of the federal government.
According to Loureiro et al. (2008), this process of change resulted in greater administrative autonomy for subnational units and aroused the interest of many actors to know what governments do and the cost at which they do it. Consequen-tly, more importance was assigned to local governments in the development and management of public policies because they are geographically smaller units and more prone to sur-veillance by citizens. herefore, international iscal transpa-rency organizations consider this level of government to be the best suited to test new models of transparency and from there, to extend those models to national governments.
1 Law 12.572/2011, the General Law on Access to Information [Lei Geral de Acesso à Informação], represented a milestone in this process because it regulated societal access to government information (Angélico & Teixeira, 2012).
2008; Styles & Tennyson, 2007) reveal the existence of low iscal transparency in public administration regardless of governmental level.
Despite the existence of various legal guidelines to sti-mulate iscal transparency in subnational units, internatio-nal studies show that governments’ choice of iscal trans-parency levels depends not only on such initiatives but also (and primarily) on domestic political decisions and/ or external factors. In this regard, Jarmuzek, Polgar, Ma-tousek and Hölscher (2009) emphasize that there is a vast literature related to the political and institutional aspects of iscal transparency and that in general, empirical studies analyze the interactions between economic, political and institutional dimensions of governments and their level of transparency. hus, in addition to economic variables such as growth rate, debt ratio and impact on iscal performan-ce, the studies consider variables related to political and institutional motivations, including political polarization, government systems, electoral system, political parties and proneness to public spending.
In Brazil, even though studies have sought to investi-gate the causes of iscal transparency, it was not possible to identify studies3 that sought to conirm the international
literature’s indings in the Brazilian context or that conside-red political variables.
In addition to the fact that studies on transparency in Brazil are recent, some peculiarities of the Brazilian context are important. For example, multipartism is positive for the
democratic environment because it increases political con-testation (Dahl, 2012)4; however, it hinders (but does not
impede) analyses similar to those performed overseas, such as in the United States and Spain, which have majoritarian systems. Moreover, there is political incoherence in coa-litions at diferent government levels-i.e., party coacoa-litions in municipal and state elections do not comply with the federal logic. Parties that are allied at the local level may be rivals at the federal level, which may create constraints during political dispute (Krause, Dantas, & Miguel, 2010). Finally, recent predominant government coalitions in Bra-zil have been created through incentives, such as granting ministerial posts and department-commissioned posi-tions. Historically, the formation of government coalitions in Brazil at all three levels of government uses the distribu-tion of posidistribu-tions as its main instrument of support.
hus, following the trend of theoretical and empirical studies on the international scene and limiting the analy-sis to three sets of variables, this study seeks to answer the following question: What is the efect of iscal, socioecono-mic and political variables on the iscal transparency level of Brazilian states?
In view of the question proposed, the following ob-jectives were defined: (1) to identify the effect of fiscal and socioeconomic variables on Brazilian states’ level of transparency; and (2) to identify the existence of the effect of political parties on Brazilian state capitals’ level of fiscal transparency.
3 The search for studies that address the theme and alignment with international studies was limited to journals in the ields of management, accounting and tourism with CAPES Qualis stratum A2 to B5. 4 Although we cite Dahl (2012) throughout this text, it should be clariied that we do not adopt Dahl’s conception of democracy. Our conception of democracy is broad and is based on the pillars deined by Sartori
(1994): (1) the government should emanate from the popular will, which becomes the main source of sovereignty; (2) the rulers are accountable to the people, taking responsibility for acts and omissions commit-ted in the exercise of power; and (3) the State should be governed by rules that delimit its ield of action in defense of the basic rights of both individual and collective citizens. For more information about democracy theory, see Held (2006).
2 THEORETICAL FRAMEWORK
2.1 The Importance of Research and Different
Approaches to Transparency.
Fiscal institutions define the environment in which political actors, voters and the market interact. “Institu-tions affect behavior by producing actors with more or less certainty about the present and future behavior of other actors” (Hall & Taylor, 2003, p. 196). Based on this statement, Alt, Lassen and Rose (2006) emphasize that the understanding that institutions are important for choices and results constituted the basis for the last two decades’ increased concern for the principles of good governance, in which government transparency plays a prominent role.
Furthermore, in accordance with Alt et al. (2006), in-creasing iscal transparency is a way to provide voters, ob-servers, inancial markets and oten politicians themselves with more information about the intentions underlying iscal policy, about the possible actions taken by public managers and about the immediate and long-term con-sequences of established policies. As a result, Grigorescu (2003) notes that currently, many scholars are
increasin-gly aware of the importance of this issue and its potential explanatory power. hat author also suggests that due to the variety of interests involved in the low of informa-tion, the concept of transparency is not monopolized by any area of study, and it can be found in studies on in-ternational conlicts, inin-ternational organizations, political environment, monetary policy, trade, corruption, demo-cratic theory and public management, among others.
Finel and Lord (1999) emphasize that regardless of the area studied, most studies perceive government transparency as a factor that supports increased coope-ration between States, allowing collective problems to be solved. Corroborating this idea, Ritter (2000) states that one of the most recent explanations for democra-tic peace is based on the transparency of democracies. The author further argues that the reason for this expla-nation is that negotiations between countries that have “complete information” on each other are less likely to generate conflicts.
the degree of corruption or improving economic perfor-mance. he transparency of national governments plays the fundamental role of explicitly contributing to incre-ased accountability and implicitly contributing to demo-cratic consolidation (Kopits & Craig, 1998). According to this author, the democratic theory considers that a fun-damental characteristic of democracy is the government’s continuing responsiveness to its citizens’ preferences. hus, governmental transparency to citizens is seen as a necessary factor for democratic accountability and, con-sequently, for the consolidation of democracy.
Despite the importance given to the subject in the last decade, which caused the increasing presence of the concept of transparency in the academic literature, its meaning remains fluid, i.e., it is not yet a solidified concept, instead varying among different areas of kno-wledge. In part, this situation is due to the use of the transparency concept in different aspects related to in-formation flow.
An example is the use of the term in the literature on conlicts between countries, which argues that a country is transparent if another country can obtain information about its societal preferences and support for government actions (Schultz, 1999).
In political science, the concept of transparency is as-sociated with the government’s disclosure of information to internal and external actors (Grigorescu, 2003) and the consequent use of that disclosure as an instrument of pu-blic agents’ accountability when they adopt a procedure in-consistent with the proper use of public funds (Loureiro, Teixeira, & Prado, 2008).
In the field of public administration, Birkinshaw (2006) states that transparency can be understood as the management of public affairs for the public. Black (1997) completes that definition stating that transparent policies are the opposite of opaque policies, in which there is no access to decisions, to what they represent, to how they are made or to what is gained or lost with them.
As noted above, the previously presented concepts re-fer broadly to transparency, not specifying dimensions of
transparency that are more speciic, such as iscal transpa-rency, transparency in international relations, etc. Seeking greater speciicity in the conceptualization of iscal trans-parency, the following section presents the transparency concept and the studies that indicate its possible causes.
2.2 Fiscal Transparency.
Alt, Lassen and Skilling (2002) argue that iscal trans-parency refers to the informativeness, comprehensiveness and reliability of government budget statements. A com-monly cited deinition in studies on that theme is presented by Kopits and Craig (1998, p.1):
Fiscal transparency is defined (...) as openness toward the public at large about government structure and functions, fiscal policy intentions, public sector accounts, and pro-jections. It involves ready access to reliable, comprehen-sive, timely, understandable, and internationally compa-rable information on government activities (...) so that the electorate and financial markets can accurately assess the government’s financial position and the true costs and benefits of government activities, including their present and future economic and social implications.
Alt et al. (2002) emphasize that the most important aspects of fiscal transparency are commitment to a non--arbitrary language, the possibility of independent ve-rification and the ability to access more information in fewer documents.
Seeking to render the concept of transparency more applicable and less utopic, the editors of the OECD’s Best Practices for Budget Transparency define transparency as “openness about policy intentions, formulation and im-plementation” and budget transparency as “the full dis-closure of all relevant fiscal information in a timely and systematic manner” (Organisation for Economic Coo-peration and Development. OECD, 2001, p. 7). Table 1 shows, according to “Best Practices for Budget Transpa-rency,” how budgets should be prepared, the data to be reported and the procedures necessary to ensure their integrity.
As observed from the quotes and studies described above, the concern with transparency seems to have
be-come important in the late 1990s. As noted by Prado, Ribeiro and Diniz (2012), there are at least two reasons
Budget Reports Speciic Evidence Integrity Assurance
Budget Economic assumptions Accounting Policies Pre-budget Report Fiscal Expenses Processes and Responsibilities Monthly Report Financial Assets and Liabilities Audit
Biannual Report Non-inancial Assets Preliminary Public Scrutiny Annual Report Pensions and Retirement Obligations
Pre-election Report Contingent Liabilities Long-term Report
Table 1 The “three pillars” of the OECD’s best transparency practices
for this situation. The first is associated with the emer-gence of the use of interactive technologies as a mass phenomenon, particularly related to the expansion of the Internet. The second is related to the consolation of administrative modernization models of the public sector within the state reform context based on the in-tensive use of Information and Communication Tech-nologies (ICT).
Within the theoretical framework of fiscal transpa-rency (regardless of the existence of electronic means of public access) and best practices in fiscal transparency, several studies have sought not only to identify the levels of transparency in countries, states and municipalities but also to understand their causes and consequences.
According to Jarmuzek et al. (2009), these studies have relied on a broad literature on the political and institutional aspects of fiscal policy; therefore, most of them have sought to understand the relationship betwe-en transparbetwe-ency and the political, institutional and eco-nomic dimensions of governments.
Some theoretical results of the transparency effect in fiscal policy are noted by Shi and Svensson (2006), Bes-ley (2007), Alt et al. (2006) and Caamaño-Alegre, Lago--Peñas, Reyes-Santias and Santiago-Boubeta (2013); ho-wever, as noted by Alt et al. (2006), the effects of fiscal transparency depend on the issues under consideration. The authors emphasize, however, that with respect to the causes of fiscal transparency, these studies’ main empiri-cal conclusion is that increases in transparency are rela-ted to the reduction of indebrela-tedness and the possibility of generating budget cycles for political purposes.
Although empirical studies have sought to investi-gate the external causes of fiscal transparency, few stu-dies have proposed to study its endogenous causes. In this sense, to explore the (endogenous) determinants of fiscal transparency in the American states, Alt et al. (2006) use panel data to assess the evolution of budge-tary procedures of those states during the period 1976-1999. Their quantitative analysis assesses the impact of (1) political competition, (2) political polarization, (3) level of government competition, (4) government debt, (5) fiscal surplus and (6) fiscal deficit. In addition, they conduct case studies in four American states (Delaware, North Carolina, Rhode Island and Wyoming) and find evidence that both the political scene and the fiscal en-vironment affect the level of transparency.
With respect the political scene, the authors find that greater political competition is associated with a higher level of fiscal transparency, whereas political polariza-tion is associated with lower levels of fiscal transparency, which suggests that changes in the level of fiscal trans-parency occur to a lesser degree when political competi-tion occurs between only two parties.
Corroborating these findings, Dahl (2012) claims
that the development of a political system that allows for opposition, rivalry and competition between a govern-ment and its opponents is an important aspect of de-mocratization. Accordingly, that author also states that a key feature of democracy is the government’s continuous responsiveness to the preferences of its citizens, conside-red as political equals.
Furthermore, Alt et al. (2002) empirically support the proposition by Ferejhon (1999), namely, that high transparency is associated with the amount of State in-tervention in the economy. Those authors investigate the possible association between fiscal transparency with the Democratic and Republican parties. To them, De-mocrats are widely renowned as more favorable to state intervention in the economy than are Republicans. Ho-wever, these variables are not statistically significant for the sample and period selected.
The results presented by Alt et al. (2006) indicate that fiscal variables are relevant to establish the level of transparency. They argue that a high debt level is asso-ciated with low transparency and that both deficit and surplus are associated with a high level of transparency. They emphasize that the result associated with deficit indicate that when economic conditions are not favora-ble, politicians must increase the level of disclosure to justify their political choices. With respect to surplus, they emphasize that the reason for this result is that when politicians have good fiscal performance, they are more willing to disclose their results and to use them against their competitors.
Bellver and Kaufmann (2005) have built a trans-parency index for 194 countries based on more than twenty independent sources. The index includes an ag-gregated transparency indicator with two components: economic/institutional transparency and political trans-parency. The results indicate that transparency is asso-ciated with better socioeconomic and human develop-ment indicators, a high level of competitiveness and a low level of corruption.
Furthermore, Caamaño-Alegre et al. (2013) note that total public expenditure and the age of the elderly population have positive effects on fiscal transparency, whereas personnel expenses and financial burdens have a negative impact. Grigorescu (2003) complements the-se cauthe-ses by noting that debts to international organi-zations have a positive relationship to transparency be-cause international organizations require governments to disclose more information. In the Brazilian scenario, the study by Paiva and Zuccolotto (2009) indicates that appropriate revenue and human development are rela-ted to transparency, whereas the study by Cruz, Ferreira, Silva and Macedo (2012) points to tax revenue and the Municipal Dynamism Index (Índice Dinamismo Muni-cipal-IDM)5 as its main determinants.
3 METHODOLOGY
3.1 Study Population.
he Brazilian Federative Republic is formed from the indissoluble union of Brazil’s states and municipalities to-gether with the Federal District. Brazil has 26 states, 5,570 municipalities and one Federal District (Brazilian Institute of Geography and Statistics [Instituto Brasileiro de Geo-graia e Estatística]-IBGE, 2013). his study will investigate the 26 states comprising the Federative Republic of Brazil and the Federal District. he Federal District has speciic legislative and administrative characteristics. Sometimes it is similar to a state, and at other times, it is similar to a municipality.
3.2 Variables Investigated.
3.2.1 Dependent variable.
As a measure of the fiscal transparency of Brazilian states, the index for the year 2010 developed by Bider-man and Pottomatti (2010)6 for the Non-Governmental
Organization (NGO) Contas Abertas was used in this study. That index aims to develop fiscal transparency parameters and objective assessment methods to create indexes for federation units, taking into account stu-dies on parameters already adopted in existing metho-dologies, both in Brazil and overseas. Based on these parameters, three indexes were developed: the State Transparency Index (STI), the Municipality Transpa-rency Index (MTI) and the Federal Government Trans-parency Index (FGTI).
he parameters used by the authors for the STI are pre-sented next.
3.2.2 Fiscal transparency parameters.
Under the terms of Complementary Law 131 and from the perspective of iscal transparency, the authors considered as transparent federal agencies with websites that have three pa-rameters: (1) Content, (2) Time Series and Update Frequency and (3) Usability. Each of these parameters is detailed next. he total score of the three parameters is 2,750 points.
◆ Content
According to Biderman and Pottomatti (2010), parame-ter content comprises the availability of budget execution phases, revenue collection details, easy access to budget classiications and broad disclosure of bidding processes, agreements, contracts and information about civil servants. Its maximum score is 1,650 points, which corresponds to 60% of the total score.
◆ Time series and update frequency
This parameter, which has a maximum score is 200
points and represents 7% of the index, comprises the availability of time series (between one and five years) and maximum update frequency for available informa-tion (daily, weekly, monthly, quarterly, biannual and annual).
◆ Usability
This parameter includes the ability to download data for specific treatments and statistical comparisons, the ability to search using various time intervals (monthly, bimonthly, quarterly, biannual and annual) and interac-tion with users, making it possible to clarify any doubts, using the following tools: sitemap, glossary, frequently asked questions (FAQs) and the ability to contact by te-lephone and e-mail.
According to the methodology proposed by the au-thors, this parameter has a maximum score of 900 points, representing 33% of the Index.
3.2.3 Transparency index calculation.
From the sum of each subitem of the three components--Content, Time Series and Update Frequency, and Usabili-ty-the following maximum weights are given:
◆ C = Content, with maximum score = 1,650 points (60% of the total);
◆ TS = Time Series and Update Frequency, with maxi-mum score = 200 points (7% of the total);
◆ U = Usability, with maximum score = 900 points (33% of the total).
Cmax + TSmax + Umax = 2,750 points (100%)
or, in percentage terms (Transparency Index),
Cmax + TSmax + Umax = 1.
Based on these parameters, the authors classiied the states by iscal transparency level. he state with the highest index was São Paulo, and the state with the lowest index was Piauí7.
3.2.4 Independent and control variables.
With respect to the independent variables and follo-wing the findings of international and national studies, three sets of variables were investigated: fiscal (Alt, Lassen, & Rose, 2006; Cruz, Ferreira, Silva, & Mace-do, 2012; Paiva & Zuccolotto, 2009; Zuccolotto, Paiva, & Corrar, 2011), socioeconomic (Bellver & Kaufmann, 2005; Caamaño -Alegre et al., 2013) and political (Alt et al., 2006).
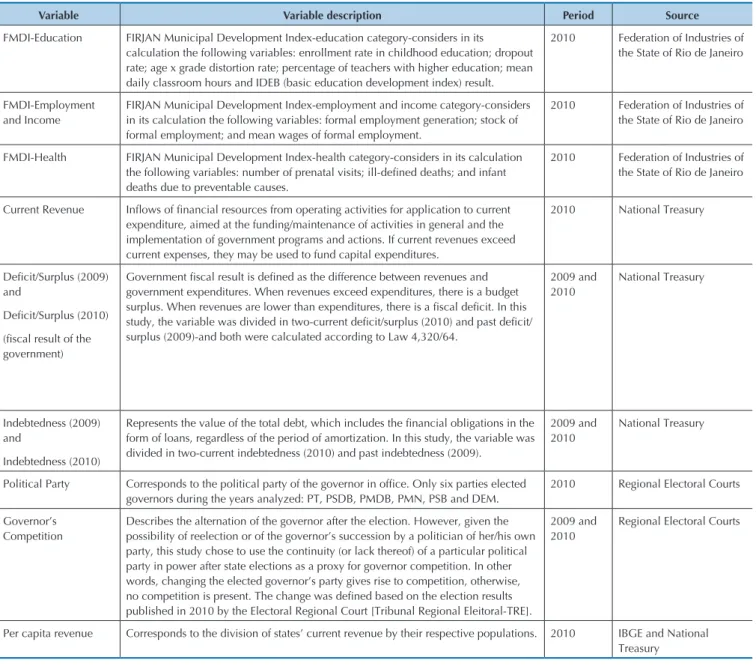
Table 2 shows the independent variables of the study along with their description, period and source.
With respect to the sign of the variables, it is expected that the iscal (current revenue, deicit/surplus and inde-btedness) and socioeconomic (FMDI education, FMDI employment and income and FMDI health) variables have positive signs, whereas for the political variables (governor’s competition and political party), a positive sign is expected for the former and no relationship is ex-pected between political parties and transparency for the reasons outlined above.
It should be noted that the consolidated FMDI was not used because it had multicollinearity problems with the variables Health, Education, FMDI--Employment and Income, Current Revenue, State In-debtedness and State Fiscal Deficit/Surplus. Thus, the FMDI subindicators were used to compose a new factor using the factor analysis technique and thus to eliminate the multicollinearity problem.
It is worth clarifying that in this study, the variable de-icit/surplus means the budget result of the government; therefore, it was not segregated. his choice was made because the existence of multicollinearity among the stu-dy variables led us to group them into factors and given
that the factor analysis technique cannot be performed with dummy variables, the nominal values of the deicit or surplus were used. In addition, the same methodology was maintained for the regression models, for purposes of standardizing the terms.
3.3 Technical Specification of the Study.
For the data analysis, the multiple linear regression te-chnique was used. Linear regression, according to Fávero, Beliore, Silva and Chan (2009), aims to investigate the re-lationship between two (simple regression) or more (mul-tiple regression) explanatory variables (which are presen-ted in a linear manner) and a metric dependent variable. Accordingly, the aim is to establish the relationship be-tween the dependent variable (iscal transparency of States) and the independent variables (FMDI-Health, FMDI-Edu-cation, FMDI-Employment and Income, State Indebted-ness, State Fiscal Deicit/Surplus, political parties (dummy) and governor’s competition (dummy)).
Due to the multicollinearity problems among variables (FMDI-Health, FMDI-Education, FMDI-Employment and Income, Current Revenue, Current Transfers, State
Indeb-Variable Variable description Period Source
FMDI-Education FIRJAN Municipal Development Index-education category-considers in its calculation the following variables: enrollment rate in childhood education; dropout rate; age x grade distortion rate; percentage of teachers with higher education; mean daily classroom hours and IDEB (basic education development index) result.
2010 Federation of Industries of the State of Rio de Janeiro
FMDI-Employment and Income
FIRJAN Municipal Development Index-employment and income category-considers in its calculation the following variables: formal employment generation; stock of formal employment; and mean wages of formal employment.
2010 Federation of Industries of the State of Rio de Janeiro
FMDI-Health FIRJAN Municipal Development Index-health category-considers in its calculation
the following variables: number of prenatal visits; ill-deined deaths; and infant
deaths due to preventable causes.
2010 Federation of Industries of the State of Rio de Janeiro
Current Revenue Inlows of inancial resources from operating activities for application to current
expenditure, aimed at the funding/maintenance of activities in general and the implementation of government programs and actions. If current revenues exceed current expenses, they may be used to fund capital expenditures.
2010 National Treasury
Deicit/Surplus (2009)
and
Deicit/Surplus (2010) (iscal result of the
government)
Government iscal result is deined as the difference between revenues and
government expenditures. When revenues exceed expenditures, there is a budget
surplus. When revenues are lower than expenditures, there is a iscal deicit. In this study, the variable was divided in two-current deicit/surplus (2010) and past deicit/
surplus (2009)-and both were calculated according to Law 4,320/64.
2009 and 2010
National Treasury
Indebtedness (2009) and
Indebtedness (2010)
Represents the value of the total debt, which includes the inancial obligations in the
form of loans, regardless of the period of amortization. In this study, the variable was divided in two-current indebtedness (2010) and past indebtedness (2009).
2009 and 2010
National Treasury
Political Party Corresponds to the political party of the governor in ofice. Only six parties elected
governors during the years analyzed: PT, PSDB, PMDB, PMN, PSB and DEM.
2010 Regional Electoral Courts
Governor’s Competition
Describes the alternation of the governor after the election. However, given the possibility of reelection or of the governor’s succession by a politician of her/his own party, this study chose to use the continuity (or lack thereof) of a particular political party in power after state elections as a proxy for governor competition. In other words, changing the elected governor’s party gives rise to competition, otherwise,
no competition is present. The change was deined based on the election results
published in 2010 by the Electoral Regional Court [Tribunal Regional Eleitoral-TRE].
2009 and 2010
Regional Electoral Courts
Per capita revenue Corresponds to the division of states’ current revenue by their respective populations. 2010 IBGE and National Treasury
tedness and State Fiscal Deicit/Surplus) observed in preli-minary tests, the factor analysis technique was applied be-fore the multiple linear regression technique. Fávero et al. (2009) deine factor analysis as an exploratory data analysis technique to reduce the number of variables describing a phenomenon and to detect structures in the relationships between variables, thereby classifying them.
Additionally, it should be noted that the purpose of using the factor analysis technique is not only to reduce factors but also to orthogonalize axes to eliminate the cor-relation between variables. For the composition of factors, the factor extraction method called the principal compo-nents method with orthogonal rotation was used in this study, which according to Fávero et al. (2009), produces factors that are not intercorrelated. he rotation method chosen was Varimax with Kaiser normalization. To assess the validity of the factor analysis, the Kaiser-Meyer-Olkin (KMO) criterion, Bartlett’s Test and percentage of total va-riance were used.
hus, ater the application of the factor analysis tech-nique, the variables FMDI-Education, FMDI-Health and FMDI-Employment and Income were transformed into the variable Socioeconomic Factor. he variables Current
Revenue, Indebtedness2010 and Deicit/Surplus2010(iscal result of the State) became the variable Fiscal Factor.
However, because the multiple linear regression tech-nique only assesses the relationship between the parties included in the regression model and the reference party (in the case of this regression model, the DEM-Brazilian Democratic Party), a variance test (the F test) was perfor-med to detect pairwise diferences in transparency levels between the parties.
Our research hypotheses for this study are as follows: HA: he states’ iscal conditions afect the transparency
in-dex.
HB: States with better social economic conditions (higher education, health and employment and income deve-lopment indicators) have higher iscal transparency in-dexes.
HC: States with greater political competition have higher iscal transparency indexes.
HD: Political parties do not afect the iscal transparency level. To perform the statistical tests, the sotwares Stata/SE 12.0 (StataCorp, College Station, Texas, USA) and IBM SPSS Statistic 19 (IBM Company, Armonk, New York, USA) were used.
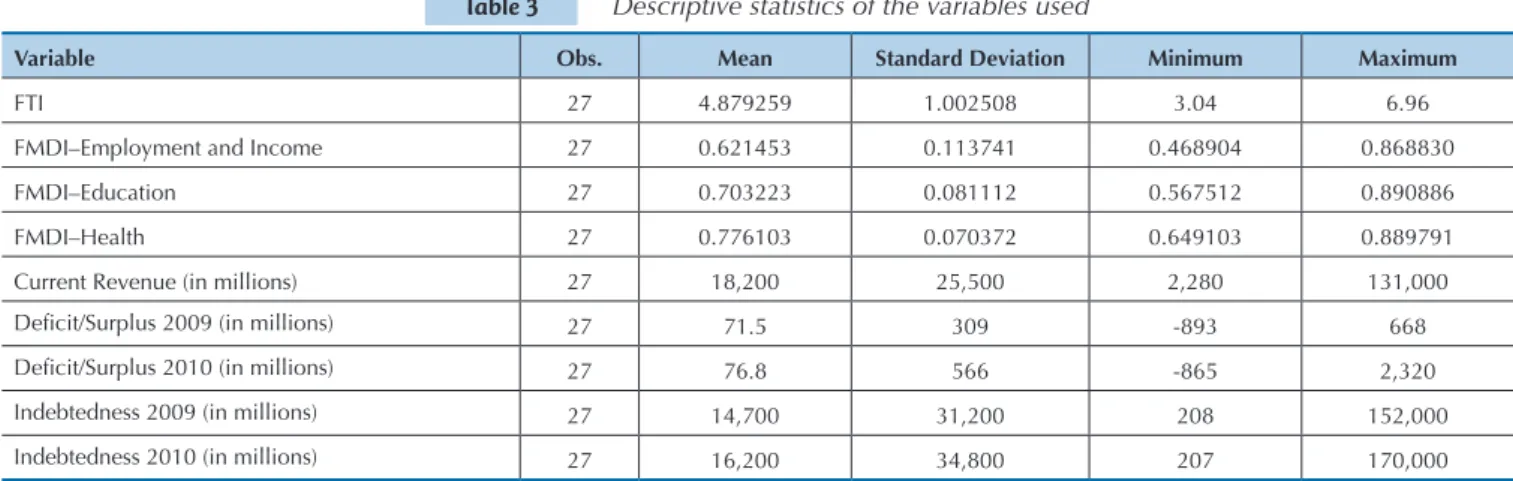
Before presenting the results and discussion, the descrip-tive statistics of the variables used are presented in Table 3.
As observed in Table 3, the variables FMDI–Employ-ment and Income, FMDI–Education and FMDI–Health had relatively high means (because these indicators os-cillate between zero and one) and low dispersion. he Sta-te Fiscal Transparency Index of the (FTI) has low mean and dispersion, indicating that Brazilian states have low levels of transparency and that none are very distant from the mean. he iscal result of the government, measured by the variable Deicit/Surplus, shows a low mean in 2009 and 2010 when compared to the mean of Current Reve-nue, but year 2010 has a high dispersion of values. he variable Current Revenues has high dispersion, which re-sults in a low means value for these revenues. he mean Indebtedness in both 2009 and 2010 has a high value when compared to revenue, the base to calculate the
in-debtedness of the states, and high dispersion, which most likely is related to the states’ revenue and size.
Before performing the regressions, the grouping of variables was performed to eliminate, by means of or-thogonal rotation, the multicollinearity between iscal variables and socioeconomic variables, as shown in the methodology. It is worth noting, however, that before the application of the factor analysis technique, the multiva-riate normality test was conducted for the variables, and the Doornik-Hansen test indicated multivariate norma-lity (Chi2 = 14.614 and ProbChi2 = 0.2632). In addition, tests for assessing outliers indicated the presence of three outliers in iscal variables: São Paulo, Rio de Janeiro and Minas Gerais. However, due to the objectives of this study, these outliers were kept in the analysis.
4 PRESENTATION AND DISCUSSION OF THE RESULTS
Variable Obs. Mean Standard Deviation Minimum Maximum
FTI 27 4.879259 1.002508 3.04 6.96
FMDI–Employment and Income 27 0.621453 0.113741 0.468904 0.868830 FMDI–Education 27 0.703223 0.081112 0.567512 0.890886 FMDI–Health 27 0.776103 0.070372 0.649103 0.889791 Current Revenue (in millions) 27 18,200 25,500 2,280 131,000
Deicit/Surplus 2009 (in millions) 27 71.5 309 -893 668
Deicit/Surplus 2010 (in millions) 27 76.8 566 -865 2,320
Indebtedness 2009 (in millions) 27 14,700 31,200 208 152,000 Indebtedness 2010 (in millions) 27 16,200 34,800 207 170,000
Therefore, as shown in Table 4, Bartlett’s test of sphericity and the Kaiser-Meyer-Olkin test revealed that factor analysis can be used because both were
sta-tistically significant, indicating that a correlation ma-trix is not identity, i.e., there is correlation between the variables.
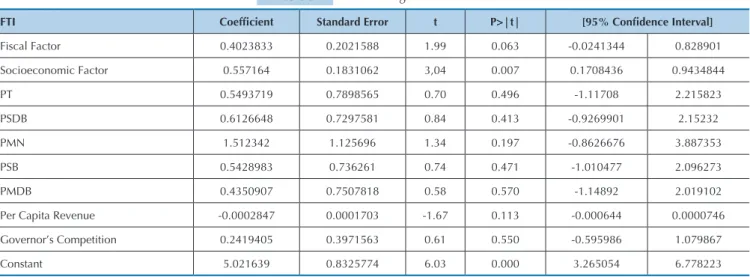
Once the factors were deined, the existence of an asso-ciation between iscal and socioeconomic factors and the transparency of Brazilian states was identiied by means of multiple linear regressions. According to international studies and aiming to eliminate the size efect among the states, the current revenue of each state divided by its po-pulation size was used as control variable.
he results indicate that the variable socioeconomic
factor was signiicant at the 5% level, whereas the variable iscal factor was not signiicant when this level of signi-icance was considered. However, if we lex the analysis (because this is an exploratory study), these variables were signiicant at 7%, conirming the irst two hypothe-ses of this study. In other words, states with better socio-economic and iscal indicators have better transparency indicators (Table 6).
Kaiser-Meyer-Olkin Measure of Sampling Adequacy 0.750 Bartlett’s Test of Sphericity Approx. Chi-Square 170.749
Df 15
Sig. 0.000
Table 4 KMO and Bartlett’s test results
Variable Fiscal Factor Socioeconomic Factor Communality
FMDI–Employment and Income 0.501 0.702 0.744
FMDI–Education 0.250 0.895 0.864
FMDI–Health 0.081 0.957 0.923
Current Revenue 0.889 0.410 0.958
Deicit/Surplus 2010 0.920 0.005 0.846
Indebtedness 2010 0.889 0.388 0.941
a-Rotation converged in 3 iterations
Table 5 Identification of factors through the Rotated Component Matrixa
FTI Coeficient Standard Error t P>|t| [95% Conidence Interval]
Fiscal Factor 0.4023833 0.2021588 1.99 0.063 -0.0241344 0.828901 Socioeconomic Factor 0.557164 0.1831062 3,04 0.007 0.1708436 0.9434844 PT 0.5493719 0.7898565 0.70 0.496 -1.11708 2.215823 PSDB 0.6126648 0.7297581 0.84 0.413 -0.9269901 2.15232 PMN 1.512342 1.125696 1.34 0.197 -0.8626676 3.887353 PSB 0.5428983 0.736261 0.74 0.471 -1.010477 2.096273 PMDB 0.4350907 0.7507818 0.58 0.570 -1.14892 2.019102 Per Capita Revenue -0.0002847 0.0001703 -1.67 0.113 -0.000644 0.0000746 Governor’s Competition 0.2419405 0.3971563 0.61 0.550 -0.595986 1.079867 Constant 5.021639 0.8325774 6.03 0.000 3.265054 6.778223
Table 6 Linear regression results
The factor analysis generated two factors that join-tly explain 87.93% of the total variance of observations, and after rotation of the axes, these factors were named fiscal factors and socioeconomic factors, as demons-trated in Table 5. The socioeconomic factor is
he regression model met the assumptions of error normality (z = 1.525 and Prob. 0.06361), non-heterosce-dasticity of residues (Chi = 0.04 and Prob. = 0.8404) and perfect non-collinearity (variance inlation factor lower than 10 for all variables).
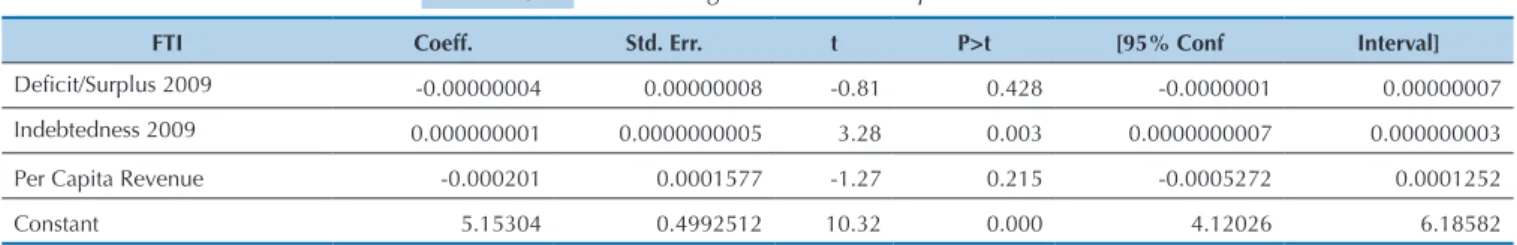
Additionally, Alt et al. (2006) emphasize that past fis-cal factors also affect the choice of transparency among
the American states, and accordingly, a new estimation was performed to identify whether this result would be repeated in Brazil. Thus, the variables Deficit/Surplus (indicating the government’s fiscal result) and Indeb-tedness were used, both for 20098; however, only the
In-debtedness2009 variable was statistically significant, as shown in Table 7.
As shown in Table 7, the variable Deicit/Surplus2009 (2009 iscal result) was not statistically signiicant. his can be partly explained by two possibilities: irst, the deicit may not yet have been converted into debt (indebtedness); therefore, there are no external pressures for major trans-parency; second, in the case of surplus, governments may feel comfortable with the amount of information disclosed, as noted by Alt et al. (2006). he irst part of this statement can be conirmed by observing that the variable Indebted-ness2009 was statistically signiicant in the model analyzed.
he results indicate that present (Table 6) and past (Table 7) iscal variables were signiicant in explaining the level of transparency of Brazil’s state capitals, corrobora-ting the indings of international studies, such as those performed by Alt et al. (2006) and Caamaño-Alegre et al. (2013), among others. In addition, for the variable iscal factors, the signiicance level of the analysis was lexed 7%. Furthermore, the fact that the variable Indebtedness2009 has a positive coeicient corroborates the assertion by Alt et al. (2006) that the main empirical conclusion of stu-dies on transparency is that an increase in transparency is related to indebtedness and the possibility of genera-ting budget cycles with political purposes. Nevertheless, the results must be viewed with caution because although statistically signiicant, the indebtedness coeicient is of little economic signiicance.
With respect to the socioeconomic factors, Table 6 indi-cates that states with better education, health and employ-ment and income displayed greater iscal transparency, in-dicating that the level of education, health and employment (and therefore revenue) positively afect transparency. his result is explained by the fact that better education, for example, leads to the formation of citizens who are critical and aware not only of their rights but also of their obliga-tions. herefore, when the rights to health, education and income have reached an acceptable level, the population itself will pressure its government to maintain good levels of services and certainly will contribute to keeping those services in good working condition. his result corrobora-tes the indings of the international literature, such as the seminal study by Bellver and Kaufmann (2005).
Regarding political parties, Table 6 indicates that this variable was not statistically signiicant. It should be noted that the party adopted as the reference for the deinition of dummy variables was the DEM and accordingly, the re-sults indicate that no party difered from the DEM in terms of transparency because none displayed signiicant coei-cients (p-value <0.05).
herefore, an F test was performed to check whether the level of transparency was diferent among the parties. As shown in Table 8, the results indicate that no diference is found in the level of transparency among parties.
FTI Coeff. Std. Err. t P>t [95% Conf Interval]
Deicit/Surplus 2009 -0.00000004 0.00000008 -0.81 0.428 -0.0000001 0.00000007
Indebtedness 2009 0.000000001 0.0000000005 3.28 0.003 0.0000000007 0.000000003 Per Capita Revenue -0.000201 0.0001577 -1.27 0.215 -0.0005272 0.0001252 Constant 5.15304 0.4992512 10.32 0.000 4.12026 6.18582
Table 7 Linear regression results of past fiscal effects
PT PSDB PMN PSB PMDB
PT
-PSDB F = 0.01 Prob F = 0.9066
-PMN F = 0.90 Prob F = 0.3573
F = 0.84 Prob F = 0.3712
-PSB F = 0.00 Prob F = 0.9999
F = 0.02 Prob F = 0.8931
F = 0.96 Prob F = 0.3410
-PMDB F = 0.04 Prob F = 0.8440
F = 0.12 Prob F = 0.7372
F = 1.13 Prob F = 0.3030
F = 0.04 Prob F = 0.8431
-Table 8 Transparency level and political parties-F Test results
As observed, the F Test results show low F statistic va-lues and p-value (prob F) higher than 0.05, indicating that no party difers from the others in relation to transparency. In addition to the political party (Table 6), the analysis of political variables considered the level of competition in the gubernatorial election (Table 6). In both cases, the-re was no the-relationship between these variables and states’ iscal transparency. hus, the fact that a governor belongs to a political party that represents continuity or change is not associated with the level of transparency of the sta-te that he/she governs, contradicting one of this study’s assumptions. With respect to political parties, it can be concluded that the transparency of Brazil’s subnational states is not associated with either right-wing or let-wing parties. In both cases, the results contradict what Alt et al. (2006) ind in their study of American states.
he fact that political parties and governor competition do not afect transparency in Brazil is not surprising; the for-mer was one of the hypotheses of this study because to be
elected, governments (and their respective parties) resort to electoral coalitions that oten do not obey any logic of party ideology. Furthermore, the fact that these coalitions are not vertical, i.e., that they are not the same at the federal, state and municipal levels, lead parties, which in many cases are ideologically distinct, to form unusual coalitions.
In addition, Krause, Dantas and Miguel (2010) em-phasize that partisan and political competition logic are lost in today’s Brazil due to what is called today’s coali-tion government, which occurs through incentives such as the granting of ministerial posts, departments and commissioned positions. Historically, the formation of government coalitions in Brazil at the three government levels has the distribution of positions as the main ins-trument of political support.
Another inding, resulting not from the analyses perfor-med in this study but found during its performance, is that transparency indicators in Brazil are still low because no state has obtained a score above 7.0 on a scale of zero to ten.
5 CONCLUSIONS
his study aimed to identify the iscal and socioecono-mic variables that afect the level of iscal transparency in Brazilian states, along with the efect of political variables on the level of those states’ iscal transparency.
he irst two hypotheses of this study (HA: he iscal conditions of the states afect the transparency index and HB: States with better socioeconomic conditions (higher Education, Health, and Employment and Income develo-pment indexes) have a higher iscal transparency indexes) were conirmed because the variables of Fiscal Factor and Socioeconomic Factor were statistically and economically signiicant. However, it is important to note that for the variable of Fiscal Factor, the analysis was lexed; therefore, a signiicance level of 7% was considered.
he irst hypothesis related to the political variables (HC: States with greater political competition have higher iscal transparency indexes) was refuted, whereas the se-cond such hypothesis (HD: Political parties do not afect the iscal transparency level) was accepted.
hese results indicate that transparency in Brazil’s sub-national states is inluenced by their iscal and socioecono-mic conditions, corroborating the indings of the interna-tional literature. hese results indicate, although partially, that states with better iscal conditions seem to have better conditions for structuring higher-quality information sys-tems for their citizens. In addition, states with better iscal conditions have more opportunities to invest in bureau-cracies and careers specializing in disclosure. Another im-portant piece of evidence is that socioeconomic conditions afect the level of transparency, indicating the importance of eicient and efective public policies in education, heal-th, employment and income.
he results also indicate that the political variables in-vestigated in this study (Political parties and Governor’s Competition) do not afect the level of transparency of Brazil’s subnational states, contradicting the indings of the international literature. However, as previously discussed, this inding strengthens the claim by Krause et al. (2010) about the identity problems of parties and their coalitions. his historical problem had already been noted by Cam-pello de Souza (1976) and had already indicated the fragili-ty of Brazil’s political parties.
Finally, it should be noted that given the low level of transparency displayed by Brazil’s subnational states, the existence of a reasonable distance between the government and civil society can be observed because little information is disclosed by the states, indicating that as argued by Pi-nho (2008), Brazilian democracy retains traces of Webe-rian patrimonialism9, a situation that is very common in
authoritarian regimes. his further reinforces the need for social participation in Brazilian democracy as a method of preventing the population’s right to information from re-maining exclusively in the hands of the public bureaucracy. In this respect, this study’s main contributions to the li-terature in this area are the evidence that iscal and socioe-conomic factors afect iscal transparency and that political variables do not afect transparency, highlighting society’s need to continuously monitor and politically engage with the public administration to reduce the informational asymmetries between the latter and citizens. Moreover, the importance of institutional reforms to strengthen par-ties and to increase the accountability mechanisms of pu-blic administrators (such as political reform, for example) should be highlighted so that the people can exercise their
negative political rights, which is a theme of a representa-tive democracy.
his study’s limitations are as follows. First, it is a trans-versal section, that is, only one year is analyzed. If there were data on transparency for additional years, a longi-tudinal study could prove to be more promising than the study performed herein. Second, the transparency index used contains partially subjective measures; nevertheless, it is the only transparency index currently available in Brazil for its states. hird, the measure used for the level of
trans-parency is not the same as in previous studies, thus limiting the comparison of the results and conclusions.
For future research, a longitudinal study is recommen-ded, considering the variables used herein together with other variables, aiming to capture the efect of the varia-bles (both in time and space) on iscal transparency. he performance of qualitative studies of these states aimed at identifying civil servants’ perceptions and experiences of what leads their States to disclose either more or less iscal information is also suggested.
Akutsu, L., & Pinho, J. A. G. De. (2002). Sociedade da informação, accountability e democracia delegativa: investigação em portais de governo no Brasil. Revista de Administração Pública, 36 (5), 471-493. Recuperado de http://bibliotecadigital.fgv.br/ojs/index.php/rap/ article/viewFile/6461/5045.
Alt, J. E., Lassen, D. D., & Rose, S. (2006). he causes of iscal
transparency: evidence from the U.S. States. IMF Staf Papers, 53, 30-57. Recuperado de http://www.jstor.org/stable/30036021.
Alt, J. E., Lassen, D. D., & Skilling, D. (2002). Fiscal transparency, gubernatorial approval, and the scale of government: evidence from the States. State Politics & Policy Quarterly, 2 (3), 230-250. doi:10.1177/153244000200200302.
Angélico, F., & Teixeira, M. A. C. (2012). Acesso à informação e ação comunicativa: novo trunfo para a gestão social. Desenvolvimento em Questão, 10 (21), 7-27. Recuperado de https://revistas.unijui.edu.br/ index.php/desenvolvimentoemquestao/article/view/342.
Bellver, A., & Kaufmann, D. (2005). Transparenting transparency: initial empirics and policy applications. World Bank Policy Research Working Paper, 1-72. Recuperado de http://web.worldbank.org/WBSITE/ EXTERNAL/WBI/EXTWBIGOVANTCOR/0,,contentMDK:20801140 ~menuPK:1977057~pagePK:64168445~piPK:64168309~theSitePK:17 40530~isCURL:Y,00.html.
Besley, T. (2007). Principled agents? he political economy of good government. OUP Catalogue. Oxford: Oxford University Press. Biderman, C., & Pottomatti, G. (2010). Metodologia para construção de
índice de transparência. Indice de transparencia. Recuperado em 20 dezembro, 2011, de http://indicedetransparencia.com/metodologia/. Birkinshaw, P. (2006). Freedom of information and openness: fundamental
human rights. Administrative Law Review, 58 (1), 177-218. Black, J. (1997). Transparent policy measures. In J. Black (Ed.). Oxford
dictionary of economics. Oxford: Oxford University Press.
Caamaño-Alegre, J., Lago-Peñas, S., Reyes-Santias, F., & Santiago-Boubeta, A. (2013). Budget transparency in local governments: an empirical analysis. Local Government Studies, 39 (2), 182-207. doi:10.1080/0300 3930.2012.693075.
Campello de Souza, M. C. (1976). Estados e partidos políticos no Brasil (1930 a 1964). São Paulo: Alfa-Omega.
Cruz, C. F., Ferreira, A. C. D. S., Silva, L. M. Da, & Macedo, M. Á. D. S. (2012). Transparência da gestão pública municipal: um estudo a partir dos portais eletrônicos dos maiores municípios brasileiros.
Revista de Administração Pública, 46 (1), 153-176. doi:10.1590/S0034-76122012000100008.
Dahl, R. A. (2012). Poliarquia: participação e oposição. São Paulo: Editora USP. Fávero, L. P., Beliore, P., Silva, F. L., & Chan, B. L. (2009). Análise de dados:
modelagem multivariada para tomada de decisões. São Paulo: Elsevier. Ferejhon, J. (1999). Accountability and authority: towards a model of
political accountability. In A. Przeworski, B. Manin, & S. C. Stokes (Eds.). Democracy, accountability and representation (pp. 131-153). New York: Cambridge University Press.
Finel, B., & Lord, K. (1999). he surprising logic of transparency.
International Studies Quarterly, 43 (2), 315-339. doi:10.1111/0020-8833.00122.
Grigorescu, A. (2003). International organizations and government transparency: linking the international and domestic realms.
International Studies Quarterly, 47 (4), 643-667. doi:10.1046/j.0020-8833.2003.04704003.x.
Hall, P. A., & Taylor, R. C. R. (2003). As três versões do
neo-institucionalismo. Lua Nova: Revista de Cultura E Política, (58), 193-223. doi:10.1590/S0102-64452003000100010.
Held, D. (2006). Models of democracy. Cambridge: Polity Press. Herawaty, M., & Hoque, Z. (2007). Disclosure in the annual reports
of Australian government departments: a research note.
Journal of Accounting & Organizational Change, 3 (2), 147-168. doi:10.1108/18325910710756159
Instituto Brasileiro de Geograia e Estatística. IBGE. (2013). Recuperado de http://www.ibge.gov.br/home/.
Instituto de Estudos Socioeconômicos. INESC. (2011). Transparência orçamentária nas capitais do Brasil. Brasília, DF: INESC. Recuperado de http://www.inesc.org.br/biblioteca/publicacoes/livros/2011/ transparencia-orcamentaria-nas-capitais-do-brasil-2011. Jarmuzek, M., Polgar, E. K., Matousek, R., & Hölscher, J. (2009). Fiscal
transparency in transition economies. SSRN Electronic Journal. doi:10.2139/ssrn.1437512.
Justice, J. B. (2006). E-government as an instrument of iscal accountability and responsiveness: do the best practitioners employ the best practices? he American Review of Public Administration, 36 (3), 301-322. doi:10.1177/0275074005283797.
Kopits, G., & Craig, J. (1998). Transparency in government operations (n. 158). Washington, D.C.: International Monetary Fund. Recuperado de https://www.imf.org/external/pubs/t/op/158/op158.pdf.
Krause, S., Dantas, H., & Miguel, L. F. (2010). Coligações partidárias na nova democracia brasileira: peris e tendencias (p. 384). São Paulo: Konrad Adenauer Unesp.
Lei 12.527, de 18 de novembro de 2011. Regula o acesso a informações previsto no inciso XXXIII do art. 5o, no inciso II do § 3o do art. 37 e
no § 2o do art. 216 da Constituição Federal; altera a Lei n. 8.112, de 11
de dezembro de 1990; revoga a Lei n. 11.111, de 5 de maio de 2005, e dispositivos da Lei n. 8.159, de 8 de janeiro de 1991; e dá outras providências. Brasil. Recuperado de http://www.planalto.gov.br/ ccivil_03/_ato2011-2014/2011/lei/l12527.htm.
Lei Complementar 131, de 27de maio de 2009. Acrescenta dispositivos à Lei Complementar no 101, de 4 de maio de 2000, que estabelece normas de inanças públicas voltadas para a responsabilidade na gestão iscal e dá outras providências, a im de determinar a disponibilização, em tempo real, de informações pormenorizadas sobre a execução orçamentária e inanceira da União, dos Estados, do Distrito Federal e dos Municípios. (2009). Recuperado de http://www. planalto.gov.br/ccivil_03/leis/lcp/lcp131.htm.
Loureiro, M. R., Teixeira, M. A. C., & Moraes, T. C. (2009). Democratização e reforma do Estado: o desenvolvimento institucional dos tribunais de contas no Brasil recente. Revista de Administração Pública, 43 (4), 739-772. doi:10.1590/S0034-76122009000400002.
Loureiro, M., Teixeira, M., & Prado, O. (2008). Construção de instituições democráticas no Brasil contemporâneo: transparência das contas públicas. Revista Organização & Sociedade, 15 (47), 107-119. Recuperado de http://scholar.google.com/scholar?hl=en&btnG=Searc h&q=intitle:Construção+de+Instituições+Democráticas+no+Brasil+ Contemporâneo:+Transparência+das+Contas+Públicas#0. Organisation for Economic Cooperation and Development. OECD.
(2001). OECD Best practices for budget transparency. Recuperado em 30 maio, 2012, de http://www.oecd.org/dataoecd/33/13/1905258.pdf.
Paiva, C. P., & Zuccolotto, R. (2009). Índice de transparência iscal das contas públicas dos municípios obtidos em meios eletrônicos de acesso público. Anais doEncontro da Associação Nacional de Pós-Graduação e Pesquisa em Administração (ANPAD) (pp. 1-15). São Paulo, SP, Brasil, 33. Recuperado de http://scholar.google.com/scholar ?hl=en&btnG=Search&q=intitle:Índice+de+Transparência+Fiscal+da s+Contas+Públicas+dos+Municípios+obtidos+em+Meios+Eletrônic os+de+Acesso+Público#0.
Pérez, C. C., Bolívar, M. P. R., & Hernández, A. M. L. (2008). E-government process and incentives for online public inancial information. Online Information Review, 32 (3), 379-400. doi:10.1108/14684520810889682.
Pinho, J. (2008). Investigando portais de governo eletrônico de estados no Brasil: muita tecnologia, pouca democracia. Revista de Administração Pública (RAP), Rio de Janeiro, 42 (3), 471-493. Recuperado de http:// www.scielo.br/pdf/rap/v42n3/a03v42n3.
Pinho, J. A. G. (2006). Accountability em portais estaduais e municipais no Brasil: realidades distantes das promessas. Anais do EnAPG-Encontro Nacional de Administração Pública e Governo. São Paulo, SP, Brasil.
Prado, O., Ribeiro, M. M., & Diniz, E. (2012). Governo eletrônico e transparência: olhar crítico sobre os portais do governo federal brasileiro. In J. A. G. Pinho (Ed.). Estado, sociedade e interações digitais: expectativas democráticas (pp. 13-39). Salvador: Editora EDUFBA.
Ritter, J. M. (2000). Know thine enemy: information and democracy foreign policy. In B. I. Finel & K. M. Lord (Eds.). Power and conlit in the age of transparency (pp. 83-113). New York: Pelgrave.
Santana Junior, J. J. (2008). Transparência iscal eletrônica: uma análise dos níveis de transparência apresentados nos sites dos poderes e órgãos dos Estados e do Distrito Federal no Brasil. Brasília: Universidade de Brasília.
Sartori, G. (1994). A teoria democrática revisitada. São Paulo: Editora Ática. Schultz, K. A. (1999). Do democratic institutions constrain or inform?
Contrasting two institutional perspectives on democracy and war.
International Organization, 53 (2), 233-266.
Shi, M., & Svensson, J. (2006). Political budget cycles: do they difer across countries and why? Journal of Public Economics, 90 (8-9), 1367-1389. doi:10.1016/j.jpubeco.2005.09.009.
Styles, A. K., & Tennyson, M. (2007). he accessibility of inancial reporting of U.S. municipalities and the internet. Journal of Public Budgeting, Accounting & Financial Management., 19 (1), 56-92. Weber, M. (2012). Economia e sociedade: fundamentos da sociologia
compreensiva (4 ed.). Brasília, DF: UnB.