Early detection of metabolic and energy
disorders by thermal time series
stochastic complexity analysis
N.A. Lutaif
1, R. Palazzo Jr.
2and J.A.R. Gontijo
1 1Departamento de Clı´nica Me´dica, Faculdade de Cieˆncias Me´dicas, Universidade Estadual de Campinas, Campinas, SP, Brasil 2
Departamento de Telema´tica, Faculdade de Engenharia Ele´trica e Computac¸a˜o, Universidade Estadual de Campinas, Campinas, SP, Brasil
Abstract
Maintenance of thermal homeostasis in rats fed a high-fat diet (HFD) is associated with changes in their thermal balance. The thermodynamic relationship between heat dissipation and energy storage is altered by the ingestion of high-energy diet content. Observation of thermal registers of core temperature behavior, in humans and rodents, permits identification of some characteristics of time series, such as autoreference and stationarity that fit adequately to a stochastic analysis. To identify this change, we used, for the first time, a stochastic autoregressive model, the concepts of which match those associated with physiological systems involved and applied in male HFD rats compared with their appropriate standard food intake age-matched male controls (n=7 per group). By analyzing a recorded temperature time series, we were able to identify when thermal homeostasis would be affected by a new diet. The autoregressive time series model (AR model) was used to predict the occurrence of thermal homeostasis, and this model proved to be very effective in distinguishing such a physiological disorder. Thus, we infer from the results of our study that maximum entropy distribution as a means for stochastic characterization of temperature time series registers may be established as an important and early tool to aid in the diagnosis and prevention of metabolic diseases due to their ability to detect small variations in thermal profile.
Key words: Time series temperature; Thermal homeostasis; High-fat diet; Metabolic disorder predictor; Autoregressive models
Introduction
A study performed at least 50 years ago demonstrated that reduced variability and linear responses of biological signals, by the statistical and mathematical analysis of intrauterus heart rate variability, would be a predictive value for future underlying disease manifestation (1). Since then, chaos theory has described elements manifesting behavior that is extremely sensitive to initial conditions, does not repeat itself, and yet is deterministic; a sequential series register of several biological para-meters such as blood pressure measurements, brain electrical activity, and renal ion transport, and possibly temperature, presents nonlinear unpredictable chaotic behavior, a kind of order without periodicity, and several investigators have implemented studies trying to define and distinguish normal variability from pathological behavior profiles (2). Simultaneously, in the past few years, along with the development of descriptive statistics and computer tools, new models of variance analysis were proposed, and studies which were analyzed by
interpretation of averages and deviations began to include new mathematical concepts such as geometric models, stochastic time series, chaos theory, and spectral analysis (3-6).
Observation of the thermal registers of core tempera-ture behavior, in humans and rodents, permits identifica-tion of some characteristics of time series such as autoreference and immobility that fit adequately into a stochastic analysis. These characteristics are associated with the physiological nature of an internal thermal series, which is modulated by a complex superstructure that acts at the behavioral level up to molecular signaling (7,8). In this case, this regulatory superstructure reflects the importance of central thermal homeostasis for keeping temperature within a narrow variation range in mamma-lian species. In fact, among all the biological signals measured in humans, temperature is the one that has the smallest relative deviation (±0.56C around the mean value of 36.76C) (9). The hierarchical relevance of the
Correspondence: J.A.R. Gontijo, Departamento de Clı´nica Me´dica, Faculdade de Cieˆncias Me´dicas, Universidade Estadual de Campinas, 13083-887 Campinas, SP, Brasil. Fax: ++55-19-3521-8925. E-mail: [email protected]
central nervous system (CNS) to thermal control activities is explained by fine adjustments of maximum enzyme reaction activities to a given temperature in homeothermic animals.
In homeothermic animals, the inability to cope with the excess energy absorbed by a hypercaloric diet leads to the phenomenon known as lipotoxicity, a concept inter-preted as the cost of keeping the temperature at a maximum but stable level, in order to promote increased fatty acid oxidation and heat release. To maintain thermal stability, animals develop obesity and impaired glucose tolerance, responses associated with reduced thermo-genesis (10). Thus, we may hypothesize that the energy imbalance may reflect, at an earlier stage, a subtle change in the variability of the thermal series of these animals. However, from what we know so far, no studies have been performed using complexity stochastic analy-sis to define the temperature behavior in normal and pathological models. To identify this change, we have used, for the first time, a stochastic autoregressive model, the concepts of which match those associated with physiological systems involved (11,12) and applied in high-fat intake diet (HFD) rats compared with their appropriate standard food intake controls. The HFD model is extremely efficient for creating pathophysiologi-cal conditions such as hyperleptinemia, peripheral insulin resistance, diabetes mellitus, and obesity that lead to long-term metabolic and energy disorders. Blocking insulin and leptin pathways at the level of the hypotha-lamic nuclei promotes increased thermogenic activity in the body, leading to adjustments in the CNS to maintain temperature stability. Therefore, the purpose of the present study was two-fold: a) to identify a stochastic process associated with thermal time series involved with the HFD procedure, and b) from characterization of this stochastic process, to propose a model of an algebraic system as a tool for early and efficient detection of changes in physiological signals.
Material and Methods
Animals
General guidelines established by the Brazilian College of Animal Experimentation (COBEA) and approved by the Institutional Ethics Committee (CEEA/UNICAMP 1697-1) were followed throughout the investigation. Our local colonies originated from a breeding stock supplied by CEMIB/UNICAMP, Campinas, SP, Brazil. Experiments were conducted on age-matched, male offspring of sibling-mated Sprague Dawley rats (n=7 for each group). At 6 weeks of age (180.5±11.7 g body weight), the animals were housed in individual cages and maintained under controlled temperature (226C) and lighting conditions (7:00 am to 7:00 pm), with free access to tap water, and were randomly distributed into two dietary groups: a control group fed with pelleted standard rodent laboratory chow (standard
diet, SD; Nuvital, Brazil) or a high-fat diet group (HFD) fed a high-fat diet for 4 weeks, up to 10 weeks of age. The standard chow diet contained 11.9% kcal as fat and a total of 2.9 kcal/g, and the high-fat diet contained 58.3% kcal as fat and a total of 5.44 kcal/g. All male rats were weighed weekly and had food and water intake measured daily throughout the experiment. After an adjustment Subcue period of 48 h, the 10-week-old rats were anesthetized with a mixture of ketamine (75 mg/kg body weight, ip) and xylazine (10 mg/kg body weight,ip), and a thermal probe (Data Logger, USA) was placed inside the abdominal cavity. The recording of internal temperature was sched-uled to start at 1 week after the surgical proceedings, and data were recorded for 6 h in both the SD and HFD groups, with a 1-min period between recordings. During the experiments, the animals were kept isolated in an environ-ment of low external stimuli and monitored with respect to the acceptance of diet and vitality. At the end of the assay, a lethal dose of thiopental was administered and data were transferred to the program Subcue-Data Logger Mathematica 7.0 (Wolfram Research, Inc., USA).
Assumptions
The chosen time interval for the recorded temperature of each pair of animals submitted to analysis was between 0:00 and 6:00 am, in SD rats and HFD animals. For mammals, although internal temperature is considered to be an inherently stationary time series with variability fixed at about 0.56C, we reinforced this physiological condition by subtracting the mean value of the entire series from each individual measurement (13), to neutralize the action of hormonal circadian rhythms, which could lead to a certain degree of seasonality in the series (averaging). According to regulatory dynamic characteristics of the thermal control, the mechanisms of heat production and heat dissipation have to work in synergy (7).
Based on this thermal profile, we consider animal temperature as a source of information. The characteriza-tion of a source of informacharacteriza-tion comes from establishment of the stochastic process. On the other hand, from the information theory point of view, every source has an associated measure quantifying its output. In our case, the associated measure is the entropy (rate). As a conse-quence, one of the goals in source coding is to maximize the source entropy under an appropriate set of constraints. In this article, we focus on the characterization of the stochastic process associated with animal temperature, which will maximize a statistical measure (the entropy rate) under some constraints (the autocorrelation function) (14). In this direction, we assume a stationary stochastic process represents animal temperaturex~fX(k)g. A source is said to be stationary if given: X(1),X(2),:::,X(n), and
X(1zl),X(2zl),:::,X(nzl) t h e n ,P X½ (1)~x1,X(2)~x2,:::,
X(n)~xn~P X½ (1zl)~x1,P(2zl)~x2,:::,P(nzl)~xn f o r any integern,l>1, thereforexhas a constant variance and
For stationary processes, it is possible to determine the entropy rate of the source {X(k)} (14). The entropy rate of an information source is defined as
H(x)~limn?$
H(X(1),X(2),:::,X(n))
n ~
limn?$H(X(1),X(2),:::,X(n{1),
when the limit exists. On the other hand, we also assume the source is ergodic, that is, the time average exhibited by only one realization of the source output is equal to the ensemble average with probability one. Under these conditions, the Shannon-McMillan-Breiman theorem (15) guarantees convergence of the entropy rate.
From these facts, the problem we have to solve may be stated as that of determining maximum entropy distributions, as follows.
Problem : max p[PfH(p)g
~max p[P
X
x[X
{p(x) logp(x)
( )
,
Subject : X x[X
p(x)ri(x)~ai, for 1ƒiƒm,
wherePis the set of all probabilities or probability density functionsaiare known constants,ri(x)~xitheithmoment of the random variable X, and p(x) denotes either the probability of the discrete random variable X or the probability density function of the continuous random variableX. The summation symbol is used either whenX
is a discrete random variable or whenXis a continuous random variable. In this latter case, identification with the integral symbol should be clear. As a consequence, differential entropyh(x) is used instead of entropy rateH(x).
Autoregressive model
From the previous subsection, taking the earlier problem, we are faced with finding the stochastic process
fX(i)g associated with animal temperature, which max-imizes the entropy rate under the constraint of the autocorrelation function, that is
max p[PfH(p)g
~max p[P
X
x[X
{p(x) logp(x)
( )
subject to
R(k)~E Xf (izk)X(i)g~E Xf (i)X(izk)g~R({k)~wk (1)
fork~1,2,:::,kand alli.
The solution to this problem is the kth order Gauss-Markov process (14) of the form
X ið Þ~X k
k~1
akX(i{k)zZ(i) (2)
where Z(i)’s are independent, identically distributed normal random variables with zero mean and variance
s2, denoted by N(0,s2), a1,a2,...,ak, s2 are unknown
coefficients chosen to satisfy the autocorrelation function, andkis the order of the Markov process.
In a practical problem, we usually know a sample sequenceX(1),X(2),:::,X(n) from which the autocorrelation
R(0),R(1),:::,R(k) may be calculated. Therefore, the question is: knowing the process has the form in Equation 2, is it possible to choose ak values to satisfy
the constraints (Equation 1)? The answer to this question is yes. The procedure to achieve this goal, after some algebraic manipulations (in Equation 2), is given by
R(0)~X k
k~1
akR({k)zEfZ2(i)g~{ Xk
k~1
akR({k)zs2 (3)
R(l)~X k
k~1
akR(l{k),l~1,2, . . . (4)
Equations 3 and 4 are known as Yule-Walker equations. This set of equations has a unique solution, and from them it is possible to determine the ak values from the known R(k). The next question is, how many correlation lags should we consider? That is, what is the optimum value of k? The answer to this question is to make use of the Levinson-Durbin algorithm (16,17). Formally, from the Yule-Walker equations, a system of recurrent linear equations, the aforementioned algorithm may find the coefficients. In addition to this, an adjustment is needed between the set of experimental data and the algorithm (model) used to represent it. Hence, this adjustment is achieved by use of the selection method based on the information criteria (18,19). The idea is to select memory orders smaller or larger than the true memory order in order to balance them. For instance, if we consider Equation 5, the term ln ^ss2may be interpreted
as a penalty for selecting memory orders smaller, and the term klnn
n can be interpreted as a penalty for selecting memory orders larger than the true value. Therefore, minimizing these two quantities leads to the true memory order. One of these information criteria is known as the Bayesian Information Criterion (BIC). In the case of thermal time series, the memory order is determined for the model satisfying
min ln ^ss2{klnn
n
(5)
where kis the memory order of the AR model,n is the sample length, and ^ss2 is the maximum likelihood
estimator of the noise variance given by ^ss2~
Pj
j~1
X(j){XX^(j) ð Þ2
System theory
One could ask if a system theory approach may be employed to provide the same information as that obtained from rat temperature sample sequences. In this direction, consider a discrete time system with inputZ(n), impulse responseH(n) and outputX(n). LetZ(z),H(z) and
X(z) be the corresponding z-transform, that is, Z(z)~ P
nZ(n)z
{n,H(z)~P nH(n)z
{n, and X(z)~P nX(n)z
{n. From the previous subsection, we know that the stochas-tic process is a kth order Gauss-Markov process and, consequently, an autoregressive process. Under a sys-tem theory point of view, an autoregressive process is such that the system has only poles, that is,
H(z)~ 1 1{Pjj~1ajz{j
~X(z)
Z(z): (6)
Equivalently,
Z(z)~X(z) 1{X k
j~1
ajz{j
" #
,
X
n
Z(n)z{n~X n
X(n){n{X n
Xk
j~1
ajX(n)z{(nzj):
(7)
The next step is to determine thekthcoefficient of the previous polynomial equality, Equation 7. Letnzj~kin the second term on the right-hand side of Equation 7. This implies thatn{j~k. As a consequence, thekthcoefficient in Equation 7 is given by Z(k)~X(k){Pk
j~1
ajX(k{j). Therefore,
X(k)~Z(k)zX k
j~1
ajX(k{j) (8)
Note that this is an autoregressive system with orderk, denoted byAR(k).
Spectral analysis
The spectral density function of an autoregressive process as described in Equation 8 may be obtained as follows: From Equation 8 we have
X(k)~a1X(k{1)z:::zakX(k{k)zZ(k), (9)
multiplying both sides by z{k, and summing both sides over k and noticing that the left-hand side is the z -transform of X, we have X(z)~Pka1X(k{1)z{kz::: zPkakX(k{k)z{kzPkZ(k)z
{k. Changing variables leads t o X(z)~Pm(a1z{k)X(m){mz:::z Pmakz{kX(m)z{m zPkZ(k)z{k: Notice that the termsa
jz{j, for 1ƒjƒ1, are constants, yieldingX(z)~(a1z{k)(PmX(m)z
{mz:::
z(akz{k)(PmX(m)z
{k)zP kZ(k)z
{k:
The left-hand side is thez-transform ofX(.) and also of the terms in parenthesis on the right-hand side. Hence,
X(z) 1{a1z{1{a2{2{:::{akz{k
~Z(z).
SinceE Zj (i)Z(j)j~s2di
,j, it follows that
X(z)
j j2~ s
2
1{a1z{1{a2z{2{:::akz{k
j j2,
where z~ejw. Since jX(z)j2 is just half the power
spectrum, then the spectral density function is given by
S(w)~ 2s 2
1{Pkk~1ake{jwk
2: (10)
Hence, Equation 10 is the maximum entropy spectral density subject to the constraintsR(0),R(1),:::,R(k).
Blood pressure measurement
Systolic blood pressure (SBP) was measured in conscious rats at 5 and 8 weeks of treatment (SD or HFD), employing an indirect tail-cuff method using an electrosphygmomanometer combined with a pneumatic pulse transducer/amplifier (BpMonWin Monitor Version 1.33, IITC Life Science, USA). This indirect approach allowed repeated measurements with a close correlation (correlation coefficient=0.975), compared to direct intra-arterial recordings (20,21). The mean of three consecutive readings represented the blood pressure.
Glucose tolerance test (GTT)
GTTs were performed in 10-week-old SD and HFD rats, after 12 h of fasting in order to determine changes in insulin sensitivity. Eleven rats from independent litters were tested. To establish basal values of glucose and insulin, blood samples were taken by lancing the tail vein before a glucose challenge (time 0). They then received a single bolus of 1 g/kg glucoseip. Blood samples were taken from the tail vein at 0, 15, 30, 60, 90, and 120 min. Glucose from whole blood was measured with a glucometer (MediSense/ Optium, Abbott, USA). Serum was separated (50mL) and
kept at ––206C for measurement of insulin levels by radioimmunoassay. The incremental area under the glucose tolerance curve (AUC) was calculated as the integrated AUC above the basal value (time 0) over the 120-min sampling period using Prism 4 for Windows.
Biochemical analysis
immunoassay kits with a Modular Analytic P Biochemistry Analyzer (Roche Diagnostics, Germany). Enzyme-linked immunosorbent assays for plasma insulin were used to determine rat/mouse insulin (EZRMI-13K; Linco Research, Millipore, USA), according to the manufac-turer’s protocols.
Data presentation and statistics
All numerical results are reported as means±SD of the indicated number of experiments. Diagnostic checking was performed by analysis of the correlation of residues between the model and the samples (19,22). As shown in the Results section, the correlation of residues falls inside the boundary ±1.95/ ffiffiffi
n
p
(23). The AUC of the spectral density function was considered as the index of variability, and we have used it to establish the statistical difference between SD and HFD values. The calculi of these areas respected the same interval defined along the axis of frequency (w). Comparisons involving only two means within or between groups were carried out using the Student t-test. The level of significance was set at P#0.05.
Results
Experimental model data
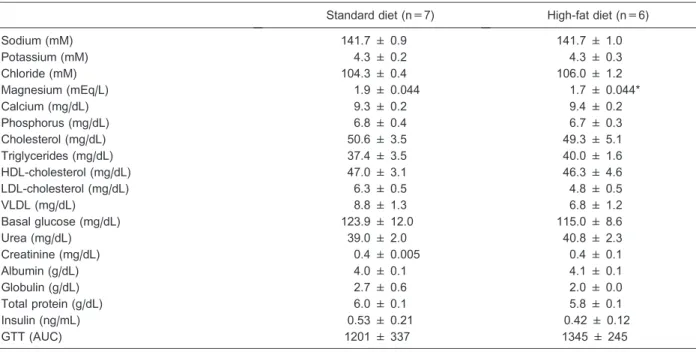
Table 1 shows the serum parameter analysis for animals from age-matched SD and HFD groups. There were no significant differences among serum biochemical
parameters in SD rats compared with the age-matched HFD group, except for magnesium plasma levels, which were significantly lower in HFD compared to SD rats (P=0.0086). Arterial blood pressure (in mmHg) levels were similar in both experimental groups (SD: 137±4.24
vs131.75±5.8 mmHg in HFD, P.0.05).
GTT
GTTs were performed to verify the effect of a high-fat diet on glucose tolerance, compared with the normal-diet group. Our study shows that, on the 4th week, the HFD group showed similar basal glycemia after overnight fasting, when compared to the SD group. Otherwise, after glucose intraperitoneal loading, the SD and HFD groups achieved similar plasma glucose concentrations at 30, 60, 90, and 120 min expressed by the incremental AUC. The measurements of plasma insulin levels during the same period (expressed in ng/mL) were also similar in SD and HFD animals.
Stochastic complexity analysis
From the previous subsections, the autoregressive model (19,22,23) may be seen as the best model to characterize temperature as the biological parameter. This model takes into consideration the inherent memory (past data) of the biological system to generate or predict future data. In mammals, adjustments in temperature are made in accordance with information observed previously. Through self-regulating mechanisms, animals are capable
Table 1. Serum biochemistry data for 10-week old age-matched rats receiving a standard diet or a high-fat diet for 4 weeks.
Standard diet (n=7) High-fat diet (n=6)
Sodium (mM) 141.7 ± 0.9 141.7 ± 1.0
Potassium (mM) 4.3 ± 0.2 4.3 ± 0.3
Chloride (mM) 104.3 ± 0.4 106.0 ± 1.2
Magnesium (mEq/L) 1.9 ± 0.044 1.7 ± 0.044*
Calcium (mg/dL) 9.3 ± 0.2 9.4 ± 0.2
Phosphorus (mg/dL) 6.8 ± 0.4 6.7 ± 0.3
Cholesterol (mg/dL) 50.6 ± 3.5 49.3 ± 5.1
Triglycerides (mg/dL) 37.4 ± 3.5 40.0 ± 1.6
HDL-cholesterol (mg/dL) 47.0 ± 3.1 46.3 ± 4.6
LDL-cholesterol (mg/dL) 6.3 ± 0.5 4.8 ± 0.5
VLDL (mg/dL) 8.8 ± 1.3 6.8 ± 1.2
Basal glucose (mg/dL) 123.9 ± 12.0 115.0 ± 8.6
Urea (mg/dL) 39.0 ± 2.0 40.8 ± 2.3
Creatinine (mg/dL) 0.4 ± 0.005 0.4 ± 0.1
Albumin (g/dL) 4.0 ± 0.1 4.1 ± 0.1
Globulin (g/dL) 2.7 ± 0.6 2.0 ± 0.0
Total protein (g/dL) 6.0 ± 0.1 5.8 ± 0.1
Insulin (ng/mL) 0.53 ± 0.21 0.42 ± 0.12
GTT (AUC) 1201 ± 337 1345 ± 245
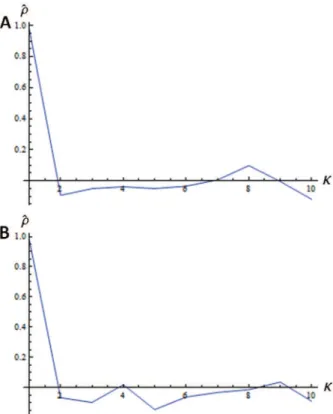
of avoiding significant thermal fluctuations. Estimation of the order of equations was performed via a partial autocorrelation function, ^pp~rr^~wk~kP(k)k=kP(k)k, where
P(k) is the autocorrelation matrix andP(k) is the matrix
P(k) with the last column being substituted by the autocorrelation vector; k k: denotes the determinant and theak’s denote coefficients of the AR model, by use of the Levinson-Durbin algorithm. For an autoregressive process with memory k, denoted by AR (k), wk=0, fork k, and wk~0, fork k. Note in both panels of Figure 1 that the greatest value of the partial autocorrelation function ^rr is achieved whenk=1. Best-fit equations were also chosen according to the minimum value obtained by BIC. All steps were performed with use of the software Mathematica 7.0 (16-18).
The total number of samples was the same for all animals and achieved 361 consecutive valid measure-ments, covering a 6-h period from 0:00 to 6:00 am (Figure 2). These measurements were organized as follows: SD : TSD~ft1,t2,:::,t361g,XSDt ~(X(t1),:::,X(t361))~
(X1,:::,X361), HFD :THFD~ft’1,:::,t’361g, andXHFDt ~(X(t’1)
,:::,X(t’361))~(X’1,:::,X’361):
Figure 2 exemplifies the time averaging series, which were the sources used for derivation of the
process for the autoregressive model. The best-fit model is achieved with the first order AR model, AR (Equation 1), given by
X(t)~a1X(t{1)zs2 (11)
where a1 denotes the first order autoregressive
coeffi-cient, and s2 denotes the variance of white noise. AR
models derived from experimental data, Equations 12 and 13, originated from the Levinson-Durbin method from temperature samples collected from SD rats at
TSD:
X(t)SD~0:98:X(t{1)z0:006 (12)
andX(t)SD~0:98:X(t{1)z0:0068; (13)
and from HFD rats atTHFD:
X(t)HFD~0:97:X(t{1)z0:096 (14)
andX(t)HFD~0:96:X’(t{1)z0:006: (15)
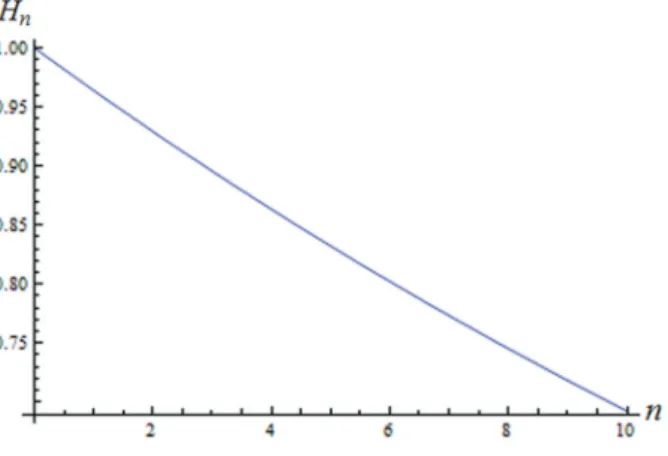
Figure 3 shows the cross-correlation of residues, denoted by ^rrð Þk (the difference between correlation of the original and AR series) of the temperature sample data with those of Equation 8, up tok= 30. As can be seen, corresponding cross-correlation values of residueskas a function falls between the bounds: +1:96= ffiffiffiffiffiffiffiffi
361
p
, in agreement with the model and its data. Since the coefficients in AR (Equation 1) models are less than 1 (see Equations 4, 5, 12, and 13), it follows that the associated stochastic process is stationary.
Now, if the autoregressive process has k~1 and
a1~r, then from
X(n)~Z(n)zrX(n{1), (16)
by using recursively Equation 16, we arrive at
X(n)~Z(n)zX $
j~1
rjZ(n{j)~X $
j~1
rjZ(n{j): (17)
From Equation 6,X nð Þis the convolution ofH(n) byZ(n), that is,
X(n)~H(n)Z(n)~X j
H(j)Z(n{j): (18)
By comparing Equation 18 with Equation 19, it follows that the impulse responseH nð Þis given by
H(n)~ r n,n§0 0,nƒ0
: (19)
Consequently, the frequency response is Figure 1.Partial auto-correlation function ^rrfor the standard
H(n)~ 1
1{re{jw: (20)
Therefore, the previous two Equations, 19 and 20, specify the time and frequency responses, respectively (see Figures 4 and 5) of the corresponding system.
Note that the spectral density function under a system theory point of view may be obtained as jX(z)j2~
X(x):X(z), whereX denotes the complex conjugate ofX
leading to that of Equation 10. From the AR (1) model, the spectral density function is given by
S(w)~ 2s 2
1za2
1{2a1cosw
, (21)
where for SD ratsa1= 0.98 and ^ss2= 0.0068, and for HFD
a1= 0.96 and ^ss2= 0.006. The spectral density function
(Equation 21), for the SD and HFD groups, is depicted in Figure 6. As can be seen, the signal energy content is located at low frequencies (39.78610–4rad/min) after the
animals underwent the HFD for 4 weeks compared to appropriate controls. Thus, the mean AUC of this specific region to demonstrate the significant difference between the thermal profile of SD rats compared to HFD rats showed 0.04±0.0014 and 0.018±0.0028, respectively,
with P,0.001.
Discussion
In the present study, we evaluated, for the first time, stochastic complexity analysis as a tool to detect, early and efficiently, presumable alterations in thermal-series profile registers in a specific model of metabolic and energy disorder. As previously defined, the temperature register obeys a nonlinear and randomized model (24). Thus, by a chaotic solution to a deterministic equation, we mean a solution whose outcome is very sensitive to initial conditions and whose evolution through phase space appears to be quite random. Taking into account the time course series of core temperature measured in control (SD for rodents) and experimental groups of animals (HFD-treated rats), as a source of information, the characterization of thermal profile comes from establish-ment of the stochastic process. On the other hand, from the information theory point of view, every source has an associated measure quantifying its output. In this case study, the associated temperature time course registers were treated through maximum entropy distribution as a means for stochastic characterization of the thermal series. In this way, in the current study, we focus on the characterization of thermal series maximized by a specific stochastic process (autoregressive model) under appro-priate sets of constraints (the autocorrelation function) to produce the best variability analysis (spectral analysis).
The HFD model is extremely efficient for creating pathophysiological conditions such as hyperleptinemia, peripheral insulin resistance, diabetes mellitus, and obesity that lead to long-term metabolic and energy disorders. However, in this study no difference was observed in glycemic levels, blood pressure, and body mass measurement after 4 weeks of HFD intake compared to age-matched animals treated with standard chow (Table 1). On the other hand, the present study was able to establish, by autoregressive analysis, a consistent Figure 2.Temperature seriesXSD
t for the standard diet (panel
A) compared toXHFD
t for the high-fat diet (panel B).
and reliable analytical method that has permitted us to characterize temperature as a referential biological para-meter in homeothermic HFD-treated rats. Thus, the current temperature data analyzed by spectral density function has shown a distinct behavior when compared to the SD control and HFD-treated groups, respectively, as illustrated in Figure 6. Moreover, when statistical tests were conducted on the spectral analysis for these same series of temperature, we observed a significant decrease in the variability of values found, mainly, in the low frequency spectrum (Figure 6). This variability corre-sponded to one cycle every 4 h or, in the international system of notation,,39.78610-4rad/min or 0.25 cycle/h,
after the animal underwent the HFD for 4 weeks, with a different circhoral rhythm to maintain the core and peripheral temperatures on small-range control in mam-mals (25). This reduction was observed by parametric analysis of the autoregressive model.
The role of the CNS has been demonstrated in the control of thermal and metabolic homeostasis in mam-mals (9,24). It is well known that thermal control pathways involve central and peripheral afferent nerve stimuli arriving into the hypothalamic preoptic area and efferent neural and humoral signaling control on thermogenesis and heat loss. Thus, studies have demonstrated that, after only 1 day of HFD intake, it is already possible to observe in rats an attenuated activity of both the insulin and leptin pathways signaling at the level of the hypothalamic nucleus (26-28). These hormones, acting either through stimulation of uncoupling proteins or via increased sympathetic activity, promote a stimulated thermogenic activity in those major organs of metabolic activity (29). Conversely, this metabolic hyperactivity leads to adjustments in the CNS to maintain stability of body temperature, necessary for the proper functioning of enzyme activities of all the chemical reactions associated with basal metabolism (30). Since this occurs in home-othermic mammals, these adjustments of body tempera-ture are supposedly made in accordance with information
data already generated and memorized. We hypothesize that it takes into account the inherent memory of biological parameters that predict data or estimate generation of future behavior profiles. In the present study, through self-regulating mechanisms, HFD-treated animals were cap-able of avoiding significant thermal fluctuations when compared to the SD group. Here, we may suppose that there are effective and fine-driven response sensors that are modulated by neural thermal control centers located in the hypothalamus, with regard to maintaining in a stationary condition the body temperature time series (Figure 2).
As previously demonstrated by hemodynamic studies, when analyzing heart rate time registers, reduction in variability of physiological parameters could be a marker for a deleterious prognosis in the long run (31,32), although a few studies have demonstrated some relation-ship between thermal profile and mortality (1,32). In the specific case of heart rate, statistical analysis of varia-bility, by itself, was found to be very sensitive but less specific when applied in practice (1,31,32). In the current study, we accessed stochastic complexity analysis as being highly sensitive and specific for detecting discrete and subtle variations in thermal series in a specific metabolic-induced disorder. Data emerging from a sto-chastic analysis model of sequential temperature regis-ters seem to be highly relevant, since there is a hierarchical priority that keeps thermal homeostasis under a narrow range of control to reach an adequate internal milieu for cells and life survival, compared with other biological parameters. We may state that mathematical analysis is an efficient tool for early prediction of the expression of pathophysiological syndromes even before appraisal of metabolic and clinical disorders. Thus, we may infer from the results of our study that thermal series analysis by a stochastic model could be proposed as a sensitive technique for clinical and pathophysiological use to predict disorders in metabolic and energy homeostasis. Figure 4.System time response for the standard diet group. Figure 5.
Conclusion
In conclusion, maximum entropy distribution as a means for stochastic characterization of temperature time series registers may be established as an important and early tool to aid in diagnosis and prevention of metabolic diseases due to its high ability for detecting small variations in thermal profiles. Additional studies are being performed with other tools to establish the precise correlation between biological and mathematical concepts
that involve representation and more specific analysis of thermal series profiles in experimental models in normal or disease states.
Acknowledgments
Research supported by FAPESP (#2010/52696-0
and #2011/05997-8), CNPq (#500868/91-3) and
CAPES.
References
1. Task Force of the European Society of Cardiology and the North American Society of Pacing and Electrophysiology. Heart rate variability: standards of measurement, physiolo-gical interpretation and clinical use. Circulation1996; 93: 1043-1065, doi: 10.1161/01.CIR.93.5.1043.
2. Higgins JP. Nonlinear systems in medicine.Yale J Biol Med
2002; 75: 247-260.
3. Glass L, Kaplan D. Time series analysis of complex dynamics in physiology and medicine.Med Prog Technol
1993; 19: 115-128.
4. Silva GJ, Ushizima MR, Lessa PS, Cardoso L, Drager LF, Atala MM, et al. Critical analysis of autoregressive and fast Fourier transform markers of cardiovascular variability in rats and humans.Braz J Med Biol Res2009; 42: 386-396, doi: 10.1590/S0100-879X2009000400012.
5. Brown EN, Choe Y, Luithardt H, Czeisler CA. A statistical model of the human core-temperature circadian rhythm.Am
J Physiol Endocrinol Metab2000; 279: E669-E683. 6. Lombardi F. Chaos theory, heart rate variability, and
arrhythmic mortality. Circulation2000; 101: 8-10, doi: 10. 1161/01.CIR.101.1.8.
7. Webb P. The physiology of heat regulation.Am J Physiol
1995; 268: R838-R850.
8. Bicego KC, Barros RC, Branco LG. Physiology of tempera-ture regulation: comparative aspects. Comp Biochem Physiol A Mol Integr Physiol 2007; 147: 616-639, doi: 10.1016/j.cbpa.2006.06.032.
9. Guyton AC, Hall JE.Textbook of medical physiology. 11th edn. Cambridge: Elsevier; 2006.
10. Maskrey M, Wiggins PR, Frappell PB. Behavioral thermo-regulation in obese and lean Zucker rats in a thermal gradient. Am J Physiol Regul Integr Comp Physiol2001; 281: R1675-R1680.
11. Rezek IA, Roberts SJ. Stochastic complexity measures for
physiological signal analysis.IEEE Trans Biomed Eng1998; 45: 1186-1191, doi: 10.1109/10.709563.
12. Faes L, Chon KH, Nollo G. A method for the time-varying nonlinear prediction of complex nonstationary biomedical signals. IEEE Trans Biomed Eng2009; 56: 205-209, doi: 10.1109/TBME.2008.2008726.
13. Makivirta A, Koski E, Kari A, Sukuvaara T. The median filter as a preprocessor for a patient monitor limit alarm system in intensive care.Comput Methods Programs Biomed1991; 34: 139-144, doi: 10.1016/0169-2607(91)90039-V. 14. Burg JP. Maximum entropy spectral analysis. [PhD Thesis]:
Stanford University; 1975.
15. Cover TM, Thomas JA. Elements of information theory. River Street Hoboken: John Wiley & Sons; 1991.
16. Morettin PA. The Levinson algorithm and its applications in time series analysis. Int Stat Ver 1984; 52: 83-92, doi: 10.2307/1403247.
17. Morettin PA, Toloi CMC.Ana´lise de se´ries temporais. 2nd edn. (Portuguese). Sa˜o Paulo: Edgard Blu¨cher; 2006. 18. Haykin S. Nonlinear methods of spectral analysis. Berlin:
Springer Series Topic in Applied Physics; 1983.
19. Nazen SM. Applied time series analysis for business and economic forecasting. 1st edn. New York: Marcel Dekker; 2013. 20. Furlan FC, Marshall PS, Macedo RF, Carvalheira JB, Michelotto JB, Gontijo JA. Acute intracerebroventricular insulin microinjection after nitric oxide synthase inhibition of renal sodium handling in rats.Life Sci2003; 72: 2561-2569, doi: 10.1016/S0024-3205(03)00170-X.
21. Mesquita FF, Gontijo JA, Boer PA. Expression of renin-angiotensin system signalling compounds in maternal protein-restricted rats: effect on renal sodium excretion and blood pressure.Nephrol Dial Transplant2010; 25: 380-388, doi: 10.1093/ndt/gfp505.
22. Jones RH. Multivariate autoregression estimation using residuals, applied time series analysis. New York: Academic Press; 1978.
23. Brockweel PJ, Davis RA. Introduction to time series and
forecasting. 2nd edn. New York: Springer Science; 2002. 24. Lutaif NA, Rocha EM, Veloso LA, Bento LM, Gontijo JA.
Renal contribution to thermolability in rats: role of renal nerves.Nephrol Dial Transplant2008; 23: 3798-3805, doi: 10.1093/ndt/gfn368.
25. Lindsley G, Dowse HB, Burgoon PW, Kolka MA, Stephenson LA. A persistent circhoral ultradian rhythm is identified in human core temperature.Chronobiol Int1999; 16: 69-78, doi: 10.3109/07420529908998713.
26. Marshall S. Role of insulin, adipocyte hormones, and nutrient-sensing pathways in regulating fuel metabolism and energy homeostasis: a nutritional perspective of diabetes, obesity, and cancer.Sci STKE2006; 2006: re7, doi: 10.1126/stke.3462006re7.
27. Ono H, Pocai A, Wang Y, Sakoda H, Asano T, Backer JM, et al. Activation of hypothalamic S6 kinase mediates diet-induced hepatic insulin resistance in rats.J Clin Invest2008; 118: 2959-2968.
28. Xavier F, Magalhaes AM, Gontijo JA. Effect of inhibition of nitric oxide synthase on blood pressure and renal sodium handling in renal denervated rats.Braz J Med Biol Res2000; 33: 347-354, doi: 10.1590/S0100-879X2000000300014. 29. Kelesidis T, Kelesidis I, Chou S, Mantzoros CS. Narrative
review: the role of leptin in human physiology: emerging clinical applications.Ann Intern Med2010; 152: 93-100, doi: 10.7326/0003-4819-152-2-201001190-00008.
30. Conti B. Considerations on temperature, longevity and aging. Cell Mol Life Sci 2008; 65: 1626-1630, doi: 10.1007/s00018-008-7536-1.
31. Varela M, Churruca J, Gonzalez A, Martin A, Ode J, Galdos P. Temperature curve complexity predicts survival in critically ill patients.Am J Respir Crit Care Med2006; 174: 290-298, doi: 10.1164/rccm.200601-058OC.
32. Varela M, Jimenez L, Farina R. Complexity analysis of the temperature curve: new information from body temperature.