PLOT SIZE AND EXPERIMENTAL UNIT RELATIONSHIP
IN EXPLORATORY EXPERIMENTS
Sérgio José Ribeiro de Oliveira1; Lindolfo Storck2*; Sidinei José Lopes2; Alessandro Dal’Col Lúcio2; Sandra Feijó2; Henrique Perin Damo2
1
UESC - Depto. de Ciências Exatas e Tecnológicas, Rod. Ilheús/Itabuna, km 16 - 45650-000 - Ilhéus, BA - Brasil.
2
UFSM Depto. de Fitotecnia, Faixa de Camobi, km 9 Campus Universitário 97105900 Santa Maria, RS Brasil.
*Corresponding author <[email protected]>
ABSTRACT: Quality of field experiments data dependent upon adequate experimental design. This study investigated the relationship between the size of the basic unit for exploratory experiments and the optimum plot size, and the experiment precision with potato crop. Tuber yield of 24 rows, 144 mounds, were used to arrange experimental units of one, two, three, four, six, eight and 12 mounds. Tuber yield data of different mounds were used to arrange plot sizes with different numbers of basic units. The model CV(x)=A/XB was adjusted, in which CV(x) was the coefficient of variation among plots with different numbers of basic units. Optimum plot size was estimated with the modified maximum curvature method of the function CV(x)=A/XB, allowing completely random design. Experimental precision was estimated though the Hatheway method for different experimental arrangements. Based upon the modification of the maximum curvature method, for a fixed total experimental area, experimental unit size of potato initial experiments affects optimum plot size estimations with the same experimental precision and variable number of treatments.
Key words: Solanum tuberosum L., experiment arrangements, quality control, experimental precision
RELAÇÃO DO TAMANHO ÓTIMO DE PARCELA COM O
TAMANHO DA UNIDADE BÁSICA NOS ENSAIOS EM BRANCO
RESUMO: A qualificação dos dados de experimentos de campo é obtida, em grande parte, pela escolha adequada do delineamento experimental. Este estudo foi realizado com o objetivo de investigar a relação do tamanho da unidade básica de ensaios em branco com o tamanho de parcela e com a precisão de experimentos com a cultura de batata. Os dados da produção de tubérculos de batata, obtidos de 24 linhas com 144 covas, foram usados para planejar unidades básicas (UB) de 1, 2, 3, 4, 6, 8 e 12 covas. Com os valores da produção das UB de diferentes tamanhos foram planejadas parcelas de diferentes números de UB. Foi ajustado o modelo CV(x)=A/XB, em que CV(x) é o coeficiente de variação entre as parcelas com X UB de tamanho. A estimativa do tamanho ótimo de parcela foi procedida pelo método da máxima curvatura modificada da função CV(x)=A/XB, considerando o delineamento inteiramente ao acaso, e a precisão foi estimada pelo método de Hatheway para diferentes configurações do delineamento experimental. Concluiu-se que o tamanho da unidade básica, usada nos ensaios em branco com batata, afeta a estimativa do tamanho ótimo de parcela pelo método da máxima curvatura modificada, sem alterar a precisão experimental, independente do número de tratamentos, mantendo fixa a área total do experimento.
Palavras-chave: Solanum tuberosum L., planejamento experimental, controle de qualidade, precisão experimental
INTRODUCTION
The search for more suitable, productive geno-types demands additional effort from researchers, mainly in the areas of genetic improvement and experimental techniques. With the use of information about features of the experimental area and the planted crop, it is possible to reduce the experimental error. The magnitude of the experimental error, can be affected by several sources of error, such as: type of treatment; presence of pests, dis-eases and weeds; interplot and intraplot competition; the
heterogeneity of the experimental material, and the het-erogeneity of the experimental units (Storck et al., 2000; Ramalho et al., 2000).
The establishment of experimental plot size and shape could be achieved on an empirical basis, from the experience of researchers who have already worked with the crop to be studied, and their knowledge on the ex-perimental plot. Nevertheless, there are several methods that provide such information in a more objective way, by optimizing costs, arranging the number of replications and also making use of data from field experiments (Kock & Rigney, 1951; Pimentel Gomes, 1988) or by using ex-ploratory or uniformity experiments (Smith, 1938; Keller, 1949; Hatheway & Williams, 1958, Hatheway, 1961; Lessman & Atkins, 1963; Meier & Lessman, 1971; Tho-mas, 1974; Hach & Morales, 1976; Lugo, 1977; Vallejo & Mendoza, 1992; Oliveira & Estefanel, 1995; Simplicio et al., 1996; Muniz et al., 1999; Viana et al., 2002a; 2002b; Silva et al., 2003; Mello et al., 2004). The aim of this study is investigating the relationship between the size of the basic unit for exploratory experiments and the optimum plot size, and the experiment precision with po-tato crop.
MATERIAL AND METHODS
Potato crop data were collected during the agri-cultural year of 2003, in Júlio de Castilhos RS, Brasil (29°12’S, 53º41’W; altitude 490 m). The soil in the area is a Dystrophic Dark Red Latosol Soil.
Tubers of 3,456 mounds were harvested on 28/ 11/2003 and 01/12/2003 from one area of three hectares, cultivated with potato cultivar macaca for the multipli-cation of seeds, planted on August 10, 2003, and weighed with a portable, digital balance. The exploratory experi-ments were set on an area of 0.0691 ha, in which the mounds were identified according to the number of rows (1 to 24) and columns (1 to 144). Rows were spaced 0.8 m, with about four mounds per linear meter or 0.2 m2
per mound, a density of 50,000 mounds ha-1. The area was fertilized, provided with recommended cultivar and phytosanitary treatment, and irrigated three times during the cycle. Twelve days before the harvest the desiccant Gramoxone was applied.
Considering the potato tuber yield results from each mound, different plot sizes and shapes were arranged by adding the results of neighboring mound towards the (L) row and the (C) column. Different Basic Unit (BU) sizes were then arranged by adding one, two, three, four, six, eight and 12 mounds in the (P) row. Later, with each BU size (P), different plot types were arranged. The num-ber of replications (N) for the plots arranged with an L (ranging from 1, 2, 3, 4, 6) and C (ranging from 1, 2, 3, 4, 6, 8, 12), with L≤C restriction, was given by the for-mula N=3456 / PLC; X=LC is the number of BU per plot. Statistics were calculated for each P value: M(x) = the average of plots with X BU; VU(x) = the variance per BU, calculated between plots with X BU, given by the
expression VU(x) = V(x)/X2
, where V(x) is a variance be-tween the plots of X BU size; CV(x) = the variance co-efficient between the plots of X BU size.
The Smith (1938) soil heterogeneity index “b” was estimated as being the linear regression coefficient of the function VU(x) = V
1/X b
, transformed to a logarithm with weighted estimate by the degrees of freedom asso-ciated with the types of planned plots (Steel et al., 1997). To estimate the optimum plot size, the modified maximum curvature method was used (Meier & Lessman, 1971). This method uses the function CV(x) = A/XB
, in which the A parameter estimates the value of the plot variation coefficient of an BU of size and B estimates the curva-ture between CV(x) and the plot size. Similarly, in the function of Smith (1938), A and B values are estimated by the least squares method using the logarithm transfor-mation, and the weighting as degrees of freedom. The maximum curvature point of the function CV(x) = A/XB is the optimum plot size (X0), thus:
(
)
+ + + = 2 1 2 ln 2 2 1 exp 2 2 0 B B B A B XTo study the relation between the optimum plot size transformed in area (m2=0.2*P*Xo) and the respective BU sizes, in number of mounds (P), several pre-established functions were tested in the statistical SAEG package (Ribeiro Jr., 2001). The selection criterion of the function was applied by the significance of parameters estimates (t test) and by the value of determination coefficient.
The true difference between two treatments (measured as percent of the mean) (d) was estimated us-ing the method of Hatheway (1961), formula
b o JX A t t
d= 2(1+ 2)2 2/ , where “J” is the number of replications for different plot sizes (X0) in numbers of BU; “A” and “b”, respectively, are estimates from the coeffi-cient of variation between the plots of an BU and soil het-erogeneity index; t1 is the significant value of t in the test of significance (bilateral to 5%); t
2 is the value of t in table corresponding to 2(1-Pr), where Pr is the probabil-ity of obtaining a significant result (0.80). The t distri-bution values were obtained using DF degrees of free-dom taking into account the completely ranfree-domized de-sign, i.e. DF=I(J-1), where I is the number of treatments and J the number of replications. The number of treat-ments was arbitrated in nine, 12, 18 and 24, and the num-ber of replications was calculated by J=3456/(PXoI).
RESULTS AND DISCUSSION
The average tuber yield was 0.8464 kg mound-1 , with standard deviation (SD) = 0.30158 kg mound-1
, and coefficient of variation (CV) = 35.63%. From these val-ues, it was estimated an yield of 42,32 t ha-1, a very high value in comparison to the average Brazilian crop yield of potato for consumption (15 t ha-1
), and to the average crop yield in Rio Grande do Sul (8 t ha-1
) (Pereira & Daniels, 2003). In Brazil, top potato farm-ers harvest between 30 and 35 t ha-1, and in European countries, the average crop yield nears 40 t ha-1 (Filgueira, 2002). Despite the existing variability be-tween mounds (CV=35.63%), the area presented clear homogeneity of horizontal spacing between plants re-garding attack of insects, diseases and weeds, which could adversely affect the use of data for the proposed objective.
There were no variations in the estimates of the function CV(x) = A/XB
parameters, and in the determi-nation coefficient (r2
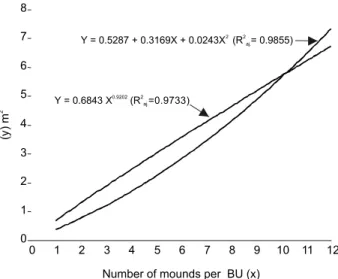
), possibly related to the number of mounds per BU (Table 1). The increase in the number of mounds per BU up to four caused a reduction in the X0 value, oscillating in the larger values. Taking into account the amplitude X0 equal to 1.25 BU, and the average equal to 3.09 BU, no dependency of X0 seems to be evident with the number of mounds per BU. The question is if the use of a greater number of mounds per BU alters, al-most linearly (quadratic and potential), the area of the optimum size of the estimated plot using the maximum curvature method (Figure 1). The relation between the number of mounds per BU and the area of the optimum plot size is almost perfect, as the determination coeffi-cient for both models of Figure 1 is close to one, and it is therefore evident the relationship between the area of the optimum plot size estimated by the method of
maxi-mum curvature modified, and the BU size in the unifor-mity tests. Therefore, the estimate methods of the opti-mum plot size that use experimental data with treatment effects, usually with plots greater than a mound can over-estimate the optimum plot size.
The average of the optimum plot size (3.09 BU) is contained in the diversity of results with the potato crop obtained by Oliveira & Estefanel (1995). However, to compare the obtained results, the optimum plot size should be transformed in number of mounds. In this case, Oliveira & Estefanel (1995) obtained a four to 90 varia-tion of mounds for different methods and times, since they used a three mound BU.
Some studies conducted with potato crops, such as those of Brown (1987) and Bearzoti & Pinto (1996), discussed the plot size based on the stage of the improve-ment program carried out with that crop, since initial phases, when there are too many genotypes to be tested and few tubers available, smaller plots should be priori-tized, whereas in the following stages, with fewer geno-types to be tested and the need for detecting little mean-ingful differences between averages of clones, one should use larger plots, which could be associated with the method to be used, and also with the BU size.
Considering that the soil heterogeneity index (b) of the function VU(x) = V1/X b
is equal to 2B, B of the function CV(x) = A/XB
(Thomas, 1974), it is verified that the b values with average equal to 0.36 (b=2B=2*0.18) vary slightly in relation to the number of mounds per BU and is regarded as low, which indicates the need for small plots. The low value of b is likely due to the size reduc-tion of stolons, obtained from the culture development, whose phenotypic selection is made during the harvest of the first generation of clones (Bisognin, 2003), in which the tuber yield is very concentrated around the seed-potato, along with the fertilizer applied in the row.
BU A B r2 *X
0
1 mound 31.0870 0.1966 0.8101 3.7529
2 mounds 27.9914 0.1809 0.7910 3.2356
3 mounds 27.0575 0.1816 0.7991 3.1530
4 mounds 24.3511 0.1517 0.7616 2.5017
6 mounds 25.5379 0.1856 0.8247 3.0520
8 mounds 23.9731 0.1666 0.9238 2.6615
12 mounds 24.5506 0.2162 0.8823 3.2971
Average 26.3641 0.1827 0.8275 3.0934 Table 1 - Estimates of the function CV(x) = A/XB parameters,
determination coefficient (r2) and the optimum plot
size (X0), obtained by the modified maximum curvature method, to the variable potato tuber yield, using basic units (BU) with different number of mounds.
* X
0 = exp{[1/(2 B+2)] ln{[A
2 B2 (2 B+1)]/(B+2)}}
Figure 1 - Relationship between the area, estimated by the modified maximum curvature method, and the number of mounds per basic unit.
0 1 2 3 4 5 6 7 8
0 1 2 3 4 5 6 7 8 9 10 11 12
Number of mounds per BU (x) Y = 0.6843 X0.9202(R =0.9733)2
aj.
Y = 0.5287 + 0.3169X + 0.0243X (R = 0.9855)2 2 aj.
(y
)
m
Therefore, it is very likely that, in the case of potato crops, the heterogeneity of the production is mainly due to the heterogeneity in the fertilization (of rows) and the seed-potato size, and in less intensity, due to the variation in the original conditions of the soil, such as fertility, mois-ture, planting depth, among others.
To facilitate planting depth, fertilization process and consequent culture treatments, potatoes are cultivated in mounds arranged in lines, in which the latter is more homogeneous. Therefore, when experimental blocks are inserted, the blocking should be constituted in the line itself, and the plots formed would be narrow (one line), forming narrow blocks (one line) with the length based on the number of treatments.
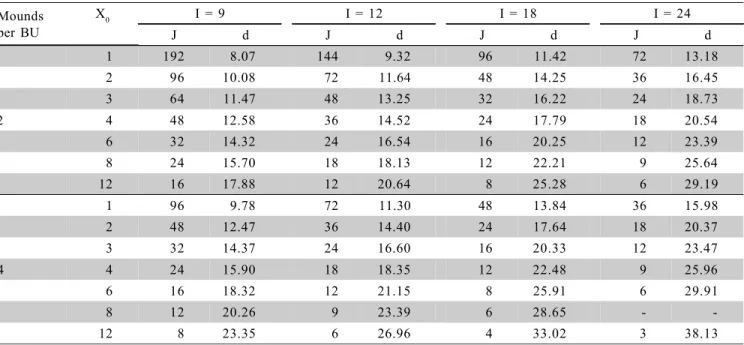
When applying the Hatheway (1961) method us-ing BU of two and four mounds with variation in the number of replications (J), in the optimum plot size (Xo), and in the number of treatments (I), in a way to plan ex-periments so as to occupy the entire area evaluated, for the same number of mounds per parcel (number of BU multiplied by the number of mounds per BU), and the same number of replications, the precision (d) is similar, regardless of the number of treatments (Table 2). There-fore, the determination of the optimum plot size in ex-periments should be seen in the set, by combining J and I, and the area available for a pre-established precision. Smaller plots with a greater number of repetitions in the same total area result in greater precision, but with a greater number of studies (evaluations), whose capacity for executing operations should be well evaluated before the experiment installation.
In general, with basic units of four mounds, in order to obtain d around 20%, it should work with, for example, I=18, J=16 and Xo=3 (Table 2). Yet, the same precision can be obtained with basic units comprised of two mounds, by choosing I=18, J=16 and Xo=6. There-fore, when reducing the number of mounds per basic unit by half, the plot size estimate is doubled in number of basic units in order to achieve compensation and main-tain the accuracy. Therefore, it is concluded that the BU size, used in the exploratory experiments with potato, af-fects the estimate of the optimum plot size by the maxi-mum modified curvature method, without altering the ex-perimental accuracy, regardless of the number of treat-ments and maintaining total area of the experiment fixed.
REFERENCES
BEARZOTI, E.; PINTO, C.A.B.P. Dimensionamento de parcela em experimentos de seleção em batata (Solanum tuberosum L.). Ciência e
Agrotecnologia, v.20, p.151-159, 1996.
BISOGNIN, D.A. Melhoramento da batata para resistência às doenças. In: PEREIRA, A. da S.; DANIELS, J. O cultivo da batata na região sul
do Brasil. Brasília: Embrapa Clima Temperado; Embrapa Informação
Tecnológica, 2003. p.125-142.
BROWN, J. A comparison between single plant plots and five plots for the initial selection stage of a potato breeding programme. Euphytica, v.36, p.711-718, 1987.
CRUZ, C.D. Programa GENES; versão windows; aplicativo computacional em genética e estatística. Viçosa: UFV, 2001. 648p.
EMPRESA BRASILEIRA DE PESQUISA AGROPECUÁRIA. Ambiente
de software NTIA, versão 4.2.2: manual do usuário - ferramental
estatístico. Campinas: EMBRAPA, Centro Nacional de Pesquisa Tecnológica em Informática para a Agricultura, 1997. 258p.
FILGUEIRA, F.A.R. Novo manual de olericultura: agrotecnologia moderna na produção e comercialização de hortaliças. Viçosa: UFV, 2002. 402p.
Mounds per BU
X0 I = 9 I = 12 I = 18 I = 24
J d J d J d J d
1 192 8.07 144 9.32 96 11.42 72 13.18
2 96 10.08 72 11.64 48 14.25 36 16.45
3 64 11.47 48 13.25 32 16.22 24 18.73
2 4 48 12.58 36 14.52 24 17.79 18 20.54
6 32 14.32 24 16.54 16 20.25 12 23.39
8 24 15.70 18 18.13 12 22.21 9 25.64
12 16 17.88 12 20.64 8 25.28 6 29.19
1 96 9.78 72 11.30 48 13.84 36 15.98
2 48 12.47 36 14.40 24 17.64 18 20.37
3 32 14.37 24 16.60 16 20.33 12 23.47
4 4 24 15.90 18 18.35 12 22.48 9 25.96
6 16 18.32 12 21.15 8 25.91 6 29.91
8 12 20.26 9 23.39 6 28.65 -
12 8 23.35 6 26.96 4 33.02 3 38.13
GOMEZ, K.A.; GOMEZ, A.A. Statistical procedures for agricultural
research. 2.ed. New York: John Wiley, 1984. 680p.
HACH, J.L.P.; MORALES, A.C. Determinacion del tamaño de parcela experimental optimo mediante la forma canônica. Agrociência, v.23, p.39-48, 1976.
HATHEWAY, W.H. Convenient plot size. Agronomy Journal, v.53, p.279-280, 1961.
HATHWAY, W.H.; WILLIAMS, E. J. Efficient estimation of the relationship between plot size and the variability of crop yields. Biometrics, v.14, p.207-222, 1958.
KELLER, K. Uniformity trials on hops, Humulus lupulus L., for increasing the precision of field experiments. Agronomy Journal, v.41, p.389-392, 1949.
KOCH, E.J.; RIGNEY, H.J. A method of estimating optimum plot size from experimental data. Agronomy Journal, v.43, p.17-21, 1951. LESSMAN, K.J.; ATKINS, R.E. Optimum plot size and relative efficiency
of lattice designs for grain sorghum yield tests. Crop Science, v.3, p.477-481, 1963.
LUGO, F.C. Tamaño de parcela experimental y su forma. Revista Faculdad
de Agronomía, v.9, p.55-74, 1977.
MEIER, V.D.; LESSMAN, K.J. Estimation of optimum field plot shape and size for testing yield in Crambe abyssinica Hochst. Crop Science, v.11, p.648-650, 1971.
MELO, R.M; LÚCIO, A.D.; STORCK, L.; LORENTZ, L.H.; CARPES, HC.; BOLIGON, A.A. Size and form of plots for the culture of the Italian pumpkin in plastic greenhouse. Scientia Agricola, v.61, p.457-461, 2004. MUNIZ, J.A.; SIMPLICIO, E.; AQUINO, L.H.; SOARES, A.R. Determinação do tamanho de parcelas experimentais em povoamentos de Eucalyptus grandis Hill. II – Parcelas quadradas. Ciência e
Agrotecnologia, v.23, p.446-453, 1999.
OLIVEIRA, P.H.; ESTEFANEL,V. Tamanho e forma ótimo s da parcela para avaliação do rendimento em experimentos com batata. Ciência
Rural, v.25, p.205-208, 1995.
PEREIRA, A.S.; DANIELS, J. O Cultivo da batata na região sul do Brasil. Brasília: Embrapa Clima Temperado; Embrapa Informação Tecnológica, 2003. 567p.
PIMENTEL GOMES, F. Novos aspectos do problema do tamanho ótimo das parcelas em experimentos com plantas arbóreas. Pesquisa
Agropecuária Brasileira, v.23, p.59-62, 1988.
RAMALHO, M.A.P.; FERREIRA, D.F.; OLIVEIRA, A.C. de. A
experimentação em genética e melhoramento de plantas. Lavras:
UFLA, 2000. 326p.
RIBEIRO JR., J.I. Análises estatísticas no SAEG. Viçosa: UFV, 2001. 301p.
SILVA, R.L.; XAVIER, A.; LEITE, H.G.; PIRES, I.E. Determinação do tamanho ótimo da parcela experimental pelos métodos da máxima curvatura modificado, do coeficiente de correlação intraclasse e da análise visual em testes clonais de eucalipto. Revista Árvore, v.27, p.669-676, 2003.
SIMPLICIO, E.; MUNIZ, J.A.; AQUINO, L.H.; SOARES, A.R. Determinação do tamanho de parcelas experimentais em povoamentos de Eucalyptus grandis Hill. I – Parcelas retangulares. Cerne, v.2, p.53-65, 1996.
SMITH, H.F. An empirical law describing heterogeneity in the yields of agricultural crops. Journal of Agricultural Science, v.28, p.1-23, 1938. STEEL, R.G.D.; TORRIE, J.H.; DICKEY, D. Principles and procedures
of statistics: a biometrical approach. 3.ed. New York: McGraw-Hill,
1997. 666p.
STORCK, L.; GARCIA, D.C.; LOPES, S.J.; ESTEFANEL, V.
Experimentação vegetal. Santa Maria: UFSM, 2000. 198p.
THOMAS, E.J. Relationship between plot size and plot variance.
Agricultural Research Journal of Kerala, v.12, p.178-189, 1974.
VALLEJO, R.L.; MENDOZA, H.A. Plot technique studies on sweetpotato yield trials. Journal of the American Society for Horticultural Science, v.117, p.508-511, 1992.
VIANA, A.E.S.; JOSÉ, A.R.S.; MATSUMOTO, S.N.; SALES-JR, S.G. Estimation of optimum plot sizes in field experiments with annatto.
Bragantia, v.61, p.181-185, 2002a.
VIANA, A.E.S.; SEDIYAMA, T.; CECON, P.R.; LOPES, S.C.; SEDIYAMA, M.A.N. Estimativas de tamanho de parcela em experimentos com mandioca. Horticultura Brasileira, v.20, p.58-63, 2002b.