ISSN 0104-6632 Printed in Brazil
www.abeq.org.br/bjche
Vol. 28, No. 01, pp. 137 - 150, January - March, 2011
Brazilian Journal
of Chemical
Engineering
PROCESS ANALYSIS AND OPTIMIZATION
MAPPING THROUGH DESIGN OF
EXPERIMENTS AND ITS APPLICATION
TO A POLYMERIZATION PROCESS
K. V. Pontes
1,2*, M. R. Wolf Maciel
2, R. Maciel
2and M. Embiruçu
11
Industrial Engineering Program, Polytechnique School, Bahia Federal University, Phone: + (55) (71) 3283-9507, Rua Prof. Aristides Novis 2, Federação, Salvador - BA, Brazil.
E-mail: [email protected],[email protected]
2
Chemical Engineering Department, Campinas State University, Cidade Universitária Zeferino Vaz, Campinas - SP, Brazil.
E-mail: [email protected], [email protected]
(Submitted: February 26, 2010 ; Revised: September 9, 2010 ; Accepted: November 16, 2010)
Abstract - The technique of experimental design is used on an ethylene polymerization process model in order to map the feasible optimal region as preliminary information for process optimization. Through the use of this statistical tool, together with a detailed deterministic model validated with industrial data, it is possible to identify the most relevant variables to be considered as degrees of freedom for the optimization and also to acquire significant process knowledge, which is valuable not only for future explicit optimization but also for current operational practice. The responses evaluated by the experimental design approach include the objective function and the constraints of the optimization, which also consider the polymer properties. A Plackett-Burman design with 16 trials is first carried out in order to identify the most important inlet variables. This reduces the number of decision variables, hence the complexity of the optimization model. In order to carry out a deeper investigation of the process, complete factorial designs are further implemented. They provide valuable process knowledge because interaction effects, including highly non-linear interactions between the variables, are treated methodically and are easily observed.
Keywords: Polyethylene (PE); Design of Experiments; Polymerization; Modeling and Simulation; Optimization.
INTRODUCTION
Polyethylene (PE) is a synthetic polymer of widespread global production that is applied in a variety of different fields from food packing and toys to pipelines. Depending upon the reactor type, the kinetic mechanism and the operating conditions, several types of PE resins can be produced with properties tailored to satisfy the requirements of the various final products and consumer quality specifications. Understanding and suitably defining the process conditions are critical aspects in the production of tailored polymers. Mathematical
modeling is a helpful tool towards the development of such an understanding and affords opportunities for optimization.
variables may present significant interactions, which should be accounted for when making decisions on variable selection procedure. When optimizing such systems, the determination of the degrees of freedom is usually based on previous process knowledge or one-at-a-time experiments. This may bring unnecessary complexity to the optimization problem because non-significant variables may be accounted for as degrees of freedom. Therefore, the use of Design of Experiments (DOE) has increased in popularity because it evaluates all process variables at the same time, determining which factors really exert a significant effect on the final response.
The use of DOE is a common practice for the investigation and optimization of chemical and other processes. In the field of polymerization, much effort has been made in experimental pilot-plants. Scott et al. (1994, 1997) applied DOE to investigate an ethylene-vinyl acetate semi-batch emulsion copolymerization for further optimization of the process conditions. Skourlis et al. (1997) performed a 25 full factorial design to investigate the injection molding conditions of advanced styrenic resins prior
to an optimization study. Forte et al. (2003)
investigated the ethylene/1-butene copolymerization catalyzed by a Ziegler-Natta/metalocene hybrid catalyst through a full 23 factorial design. Silvares et al. (2006) applied DOE to investigate the batch polymerization of methyl methacrylate in a tubular photochemical reactor and a response surface analysis enabled the optimization of response variables (e.g., polydispersity and conversion). Calumby et al. (2007) implemented a 24 full factorial design to investigate the effect of different processing variables on the mechanical and physical properties of compression-molded ultra-high molecular weight polyethylene (UHMWPE). Kauffmann and Eyerer (2007) used DOE for the adjustment and parameter optimization of a polypropylene particle foam molding process. When dealing with computer-based models, DOE is a well established practice in biotechnology. Kalil et al. (2000) used screening design followed by response surfaces to optimize an alcohol fermentation process. Costa et al. (2000) obtained empirical correlations for some mechanical properties of polypropylene wood fiber composites through a 22-31 factorial design. Some attempts to optimize chemical process based on computer simulations have also been made.
Hasan et al. (2005) optimized an industrial
hydrogenation process by means of factorial design and response surface analysis. A Plackett-Burman screening design was performed prior to the optimization so as to identify the most relevant variables for the evaluated response, reducing the
degrees of freedom from 10 to 2. However, the number of contributions using DOE applied to polymer process models is still limited compared to other applications including industrial process analysis.
Model-based DOE’s usually optimize the process conditions by means of the DOE itself. The present paper, however, presents a comprehensive approach that subdivides the optimization problem into two levels: objective function mapping through DOE followed by a rigorous optimization (Pontes et al., 2008, 2010). The paper shows that the DOE can be successfully used prior to a rigorous optimization not only to map the feasible optimal region, but also to ascertain more precisely the degrees of freedom of the problem, reducing its complexity. Therefore, this sequential and more comprehensive approach is the novelty in the present paper.
In view of the great potential of DOE and the few works that use this method for the modeling of polymerization processes, it is applied here to an industrial scale ethylene continuous polymerization process. The main goals of this investigation are to ascertain the most relevant variables to be considered as degrees of freedom for further optimization and to map the feasible optimal region, acquiring significant process knowledge that is valuable not only for future detailed optimization but also for the current operational practice. First, the process, as well as the main aspects of the optimization problem, are described. Then some fundamentals of the design of experiments are described and the results obtained are illustrated. Finally, the findings are summarized in the Concluding Remarks.
PROCESS DESCRIPTION AND MATHEMATICAL MODELING
tubular reactor in order to control the molecular weight distribution. When operating the stirred configuration, the main feed can be divided into a side feed, which is fed to the top of the reactor. A detailed description of the process model is beyond the scope of this paper. For further details see Pontes
et al. (2008) and Embiruçu et al. (2000).
Optimization Model
The optimization model developed by Pontes et al. (2008)determines the optimal operating policies to produce a tailored polymer described by properties such as Melt Index (MI) and Stress Exponent (SE), which are assured through constraints on the optimization model. The objective function is profit (Φ), given by
M M H H CAT CAT
PE
CC CC S S
b W b W b W
a W
b W b W
⋅ + ⋅ + ⋅ +
⎛ ⎞
⎜ ⎟
Φ = ⋅ −⎜ ⎟
⋅ + ⋅
⎝ ⎠
, (1)
where a is the polyethylene market price (€/kg), b represents the cost (€/kg) of raw materials, W are mass flow rates and the subscripts PE, M, H, CAT, CC and S denote polyethylene, monomer, hydrogen, catalyst, co-catalyst and solvent, respectively.
In order to tailor polyethylene resins, polymer properties (MI and SE) are assured by constraints on
the reactor outlet (PFRb). Certain additional
constraints should be considered to ensure safe operation. The outlet pressure (Pout) and temperature
(Tout) should be kept within bounds in order to avoid
phase separation.
When investigating the process through a factorial design, the outlet variables to be monitored may include the objective function (Φ) and the constraints (MI, SE, Pout, Tout). Additionally, the
global conversion (Q) and the polymer production rate (WPE) may be monitored in order to obtain more
valuable information about the process. All these variables are evaluated at the outlet of PFRb.
Therefore, the vector of responses to be evaluated by the factorial design is given by
[
]
Tout out PE
MI SE P T Q W ,
= Φ
y (2)
At first glance, the input variables that may be considered to be degrees of freedom for optimization for both tubular and stirred configurations are the inlet concentrations of the monomer (M), the hydrogen (H2,0) and the catalyst (CAT), the
co-catalyst/catalyst mass ratio (CC), the inlet
temperature (Tin), the inlet pressure (Pin) and the total
mass flow rate (Wt). In the stirred configuration, the
side feed (Ws) to the CSTR and the agitator speed
(Rot) may constitute additional decision variables. Some peculiarities also apply for the tubular configuration. As hydrogen can be injected along the tubular reactor at different points, the location (zj)
and the hydrogen concentration (H2,j) with
j 1,..., J 1= − may be additional decision variables. Only one injection point along the PFR is considered in the optimization problem; therefore the location and the hydrogen concentration at that point are represented, respectively, by z1 and H2,1. Hence, the
vectors of potential decision variables for the stirred and tubular configurations are given, respectively, by ups and upt:
T s= ⎣⎡M H2,0 CAT CC Tin Pin W W Rott s ⎤⎦ ,
up (3)
T t= ⎣⎡M H2,0 CAT CC Tin Pin W z Ht 1 2,1⎤⎦ .
up (4)
DESIGN OF EXPERIMENTS
The number of factors to be evaluated is 9 for both stirred and tubular configurations. If a complete factorial design were chosen, 512 trials would be necessary for each configuration, i.e., a total of 1024 runs. Due to the high number of trials, even for simulation-based experiments, a Plackett-Burman design for each configuration is initially chosen in order to screen the main variables and to estimate the effects of input variables on process performance. The Plackett-Burman design with 16 trials is selected because it is advisable to use at least four trials more than the number of factors, leaving thereby some degrees of freedom for error prediction (Plackett and Burman, 1946). A complete factorial design can then be limited to the main factors when attempting to obtain more precise effect estimates and response surfaces, which are helpful to gain a deeper understanding of the process.
Figure 1: Typical reactor configuration: tubular (left) and stirred (right).
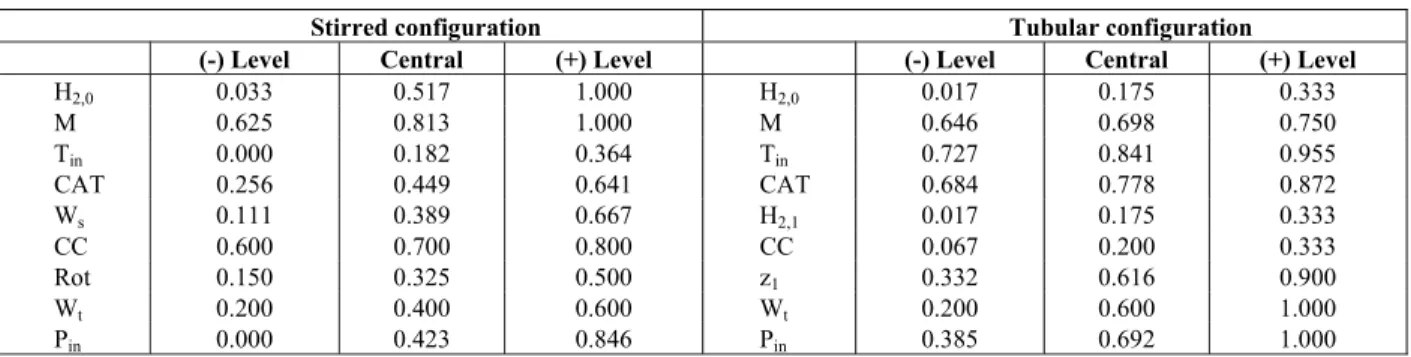
Table 1: Range of variables used in the Plackett-Burman design
Stirred configuration Tubular configuration
(-) Level Central (+) Level (-) Level Central (+) Level H2,0 0.033 0.517 1.000 H2,0 0.017 0.175 0.333
M 0.625 0.813 1.000 M 0.646 0.698 0.750 Tin 0.000 0.182 0.364 Tin 0.727 0.841 0.955
CAT 0.256 0.449 0.641 CAT 0.684 0.778 0.872 Ws 0.111 0.389 0.667 H2,1 0.017 0.175 0.333
CC 0.600 0.700 0.800 CC 0.067 0.200 0.333 Rot 0.150 0.325 0.500 z1 0.332 0.616 0.900
Wt 0.200 0.400 0.600 Wt 0.200 0.600 1.000
Pin 0.000 0.423 0.846 Pin 0.385 0.692 1.000
RESULTS AND DISCUSSION
As stated earlier, initially a Plackett-Burman design with 16 trials was carried out according to the matrix in Table 2 and the responses obtained by model simulation for each reactor configuration are shown in Table 3. One trial at the central point was carried out as it
provides an additional degree of freedom for estimating the uncertainty of the effects, which is important when testing the significance of effects. More than one trial at the central point is frequently used to estimate the inherent experimental uncertainty, but computer simulations do not have a reproducibility error and only one trial at the central point is necessary here.
Table 2: Plackett-Burman design matrix with 16 trials
Trial (1) (2) (3) (4) (5) (6) (7) (8) (9)
1 +1 -1 -1 -1 +1 -1 -1 +1 +1 2 +1 +1 -1 -1 -1 1 -1 -1 +1 3 +1 +1 +1 -1 -1 -1 +1 -1 -1 4 +1 +1 +1 +1 -1 -1 -1 +1 -1 5 -1 +1 +1 +1 +1 -1 -1 -1 +1 6 +1 -1 +1 +1 +1 +1 -1 -1 -1 7 -1 +1 -1 +1 +1 +1 +1 -1 -1 8 +1 -1 +1 -1 +1 +1 +1 +1 -1 9 +1 +1 -1 +1 -1 +1 +1 +1 +1 10 -1 +1 +1 -1 +1 -1 +1 +1 +1 11 -1 -1 +1 +1 -1 +1 -1 +1 +1 12 +1 -1 -1 +1 +1 -1 +1 -1 +1 13 -1 +1 -1 -1 +1 +1 -1 +1 -1 14 -1 -1 +1 -1 -1 +1 +1 -1 +1 15 -1 -1 -1 +1 -1 -1 +1 +1 -1 16 -1 -1 -1 -1 -1 -1 -1 -1 -1 17 0 0 0 0 0 0 0 0 0 Stirred: (1) H2,0; (2) M; (3) Tin; (4) CAT; (5) Ws; (6) CC; (7) Rot; (8) Wt; (9) Pin
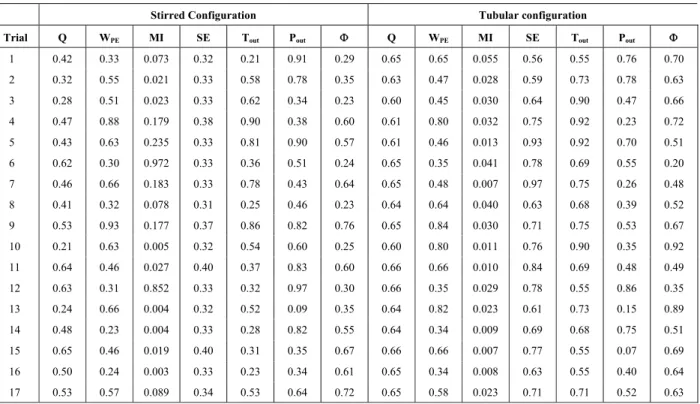
Table 3: Simulation results for the Plackett-Burman design
Stirred Configuration Tubular configuration
Trial Q WPE MI SE Tout Pout Φ Q WPE MI SE Tout Pout Φ
1 0.42 0.33 0.073 0.32 0.21 0.91 0.29 0.65 0.65 0.055 0.56 0.55 0.76 0.70
2 0.32 0.55 0.021 0.33 0.58 0.78 0.35 0.63 0.47 0.028 0.59 0.73 0.78 0.63
3 0.28 0.51 0.023 0.33 0.62 0.34 0.23 0.60 0.45 0.030 0.64 0.90 0.47 0.66
4 0.47 0.88 0.179 0.38 0.90 0.38 0.60 0.61 0.80 0.032 0.75 0.92 0.23 0.72
5 0.43 0.63 0.235 0.33 0.81 0.90 0.57 0.61 0.46 0.013 0.93 0.92 0.70 0.51
6 0.62 0.30 0.972 0.33 0.36 0.51 0.24 0.65 0.35 0.041 0.78 0.69 0.55 0.20
7 0.46 0.66 0.183 0.33 0.78 0.43 0.64 0.65 0.48 0.007 0.97 0.75 0.26 0.48
8 0.41 0.32 0.078 0.31 0.25 0.46 0.23 0.64 0.64 0.040 0.63 0.68 0.39 0.52
9 0.53 0.93 0.177 0.37 0.86 0.82 0.76 0.65 0.84 0.030 0.71 0.75 0.53 0.67
10 0.21 0.63 0.005 0.32 0.54 0.60 0.25 0.60 0.80 0.011 0.76 0.90 0.35 0.92
11 0.64 0.46 0.027 0.40 0.37 0.83 0.60 0.66 0.66 0.010 0.84 0.69 0.48 0.49
12 0.63 0.31 0.852 0.33 0.32 0.97 0.30 0.66 0.35 0.029 0.78 0.55 0.86 0.35
13 0.24 0.66 0.004 0.32 0.52 0.09 0.35 0.64 0.82 0.023 0.61 0.73 0.15 0.89
14 0.48 0.23 0.004 0.33 0.28 0.82 0.55 0.64 0.34 0.009 0.69 0.68 0.75 0.51
15 0.65 0.46 0.019 0.40 0.31 0.35 0.67 0.66 0.66 0.007 0.77 0.55 0.07 0.69
16 0.50 0.24 0.003 0.33 0.23 0.34 0.61 0.65 0.34 0.008 0.63 0.55 0.40 0.64
17 0.53 0.57 0.089 0.34 0.53 0.64 0.72 0.65 0.58 0.023 0.71 0.71 0.52 0.63
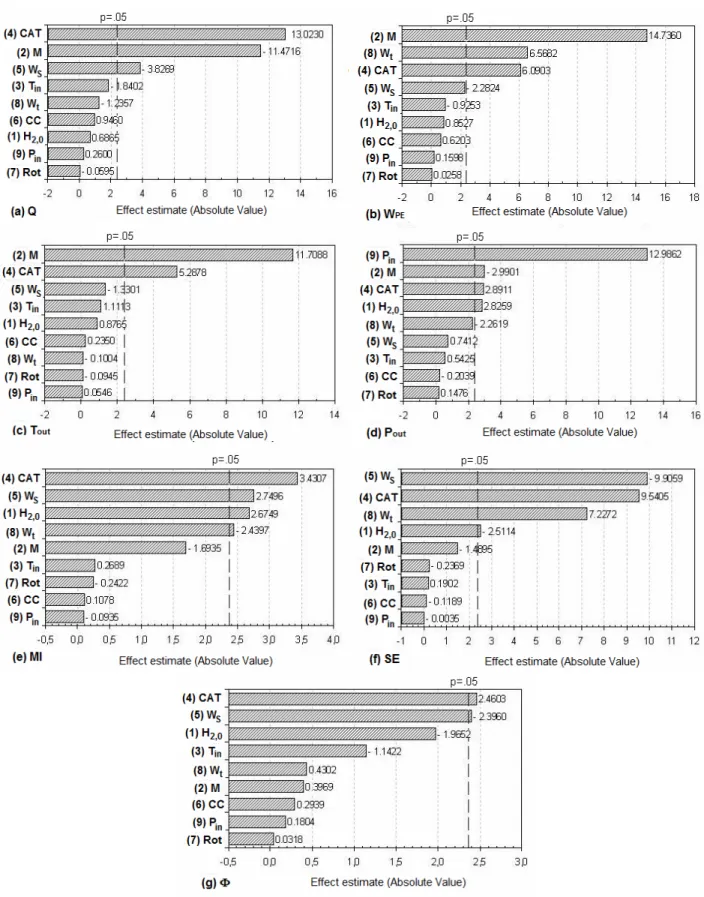
Pareto charts, depicted in Figure 2 and Figure 3, show the standardized effects, i.e., the effects divided by their respective standard deviation, enabling the identification of the statistically significant effects as well as the most relevant factors. The vertical line (p = 0.05) indicates the minimum magnitude of statistically significant effects, considering the statistical significance of 95%.
Because the present investigation is based on a phenomenological mathematical model, the simulation results do not contain the random errors usually found in industrial practice. In order to reproduce those random effects, typical errors were added to some outputs generated by the model. Figure 4 illustrates Pareto charts for Tout and MI
(stirred configuration) when adding random noise and 5% and 10% of measurement uncertainty, respectively. The same conclusion obtained from Figure 2 is observed here.
For the stirred configuration, the inlet temperature (Tin), the agitator rotation (Rot) and the
co-catalyst/catalyst mass ratio (CC) do not present any statistically significant effect on any response evaluated. Decoded values of CC are greater than one, indicating that co-catalyst is in excess, i. e., an increase/decrease in co-catalyst mass ratio plays no major role in the monitored responses. Therefore, these
three variables should not be included among the degrees of freedom of an optimization problem. Results for the tubular configuration in Figure 3 show that all variables have a statistically significant effect on at least one response. Unlike the stirred configuration, the co-catalyst shows a significant effect on the outlet temperature (Tout) and thus on conversion
(Q). This result was unexpected as the co-catalyst is also in excess here. Therefore, in order to further investigate this variable, a complete design was carried out to calculate the effects more precisely. This new design includes the inlet temperature (Tin), the
monomer concentration (M), the catalyst concentration (CAT) and the co-catalyst/catalyst mass ratio (CC), i.e., the factors that presented a statistically significant effect on the outlet temperature and on the conversion in the Plackett-Burman design. Figure 5 shows the Pareto chart of the 24 complete design, confirming that the co-catalyst/catalyst mass ratio has no statistically significant effect on both responses evaluated. Hence, the degrees of freedom for the stirred (us) and tubular
(ut) configuration can be defined as:
T s = ⎣⎡M H2,0 CAT Pin W Wt s⎤⎦ ,
u (5)
T t = ⎣⎡M H2,0 CAT Tin Pin W z Ht 1 2,1⎤⎦ ,
Figure 2: Pareto charts of standardized effects for (a) Q; (b) WPE; (c) Tout; (d) Pout; (e) MI; (f) SE and
Figure 3: Pareto charts of standardized effects for (a) Q; (b) WPE; (c) Tout; (d) Pout; (e) MI; (f) SE and
(a) (b) Figure 4: Pareto charts of standardized effects for (a) Tout; (b) MI when adding process noise – stirred
configuration.
(a) (b) Figure 5: Pareto charts of standardized effects for (a) Tout and (b) Q for the 24 complete design –
tubular configuration.
The analysis of the Pareto charts provides a way both to ascertain the main effects and to obtain a better understanding of the process. Higher inlet concentrations of monomer (M) and catalyst (CAT) enhance the propagation reactions and the outlet temperature (Tout) then increases. Both variables
therefore have positive and statistically significant effects on the outlet temperature (Figure 2 (c)). It is worth observing, however, that a higher monomer inlet concentration reduces conversion (Figure 2 (a)) because the resulting higher temperatures enhance catalytic deactivation (Pontes et al., 2008). This phenomenon occurs because the deactivation reaction has a higher activation energy than the propagation reaction (Pontes et al., 2008). Hydrogen enhances transfer reactions, reducing polymer molecular weight and therefore increasing MI. Hence, a statistically significant and positive effect of hydrogen concentration is observed on MI (Figure 2 (e)). The positive effect of the hydrogen on the outlet pressure (Figure 2 (d)) is associated with the lower pressure drop of the smaller polymeric chains. From Figure 2 (f), it is possible to observe the considerable (negative) effect of the side feed on the SE. The side feed enhances mixing
inside the reactor, making the polymer produced more homogeneous, i.e., with a lower SE.
The Pareto charts from the tubular configuration illustrated in Figure 3 express the same behavior of the catalyst and monomer inlet concentration on the outlet temperature and conversion. Nevertheless, unlike the stirred configuration, the inlet temperature is statistically significant in some evaluated responses. This may be associated with the fact that, in the stirred configuration, the inlet temperature is much lower than the bottom CSTR temperature. A variation of inlet temperature between the operational limits therefore plays no major role in the evaluated responses for the stirred configuration. On the other hand, the temperature of the first PFR compartment of the tubular configuration is only slightly higher than the inlet temperature; hence, this input variable can exert a significant influence on process output variables.
enable the identification of the interaction between variables, whether synergic or antagonistic. Although a greater number of experiments would provide more valuable information, it may be too time-consuming in some situations and imply higher cost. However, the present study is based on a process model, making it possible to handle a greater number of trials and to further explore the potential of the design of experiments. Therefore, the complete design and the response surfaces are used in order to investigate the polymerization process more thoroughly. It is important to highlight that optimization is in fact not accomplished by the complete factorial design, but by specific dynamic optimization techniques (Pontes et al., 2008).
Complete Design
Instead of investigating each response separately, one complete design for each reactor configuration may be carried out in order to reduce the total number of experiments. Furthermore, the number of trials can be reduced by half if one observes in Figure 2 and Figure 3 that the effect of the inlet pressure is statistically significant only for the outlet pressure. Bearing this in mind, the inlet pressure is fixed at its central point. Hence, the variables to be analyzed by the complete design for the stirred (ucs)
and tubular (uct) configurations are given by:
T s 2,0 t s
c = ⎣⎡M H CAT W W⎤⎦ ,
u (7)
T t 2,0 in t 1 2,1
c = ⎣⎡M H CAT T W z H ⎤⎦ .
u (8)
Two complete factorial designs are carried out: 25 and 27 for the stirred and the tubular configurations, respectively. The limits for the variables in Equations (7) and (8) are the same as presented in Table 1 and the statistically non-significant factors are kept at their central levels, as well as the inlet pressure value. The following responses are considered:
[
]
Tout out PE
MI SE T P Q W .
= Φ
y (9)
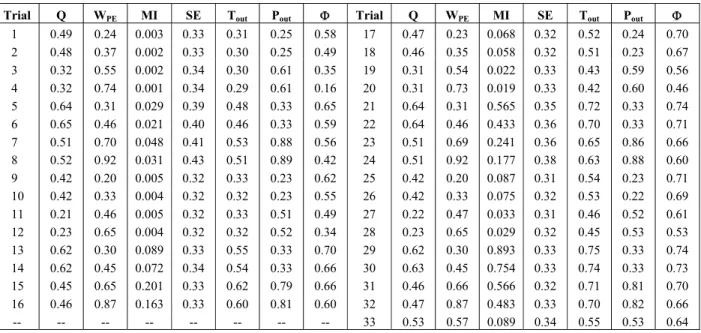
For the stirred configuration, the design results are shown in Table 4. Because of the great amount of data, the design matrix and the results for the tubular configuration are not shown here. One trial at the central point is carried out, according to previous discussions.
The statistically significant effects at a confidence level of 95% (p-value lower than 0.05) for all evaluated responses are illustrated in Table 5 and Table 6 for the stirred and tubular configurations, respectively (second and third level interaction effects are omitted to save space). The main effects corroborate the previous Plackett-Burman designs. Therefore, as mentioned previously, screening designs are of great value at an early stage of the investigation in order to provide estimates of the main effects and, consequently, identify the most important variables more readly.
Table 4: Results for the 25 complete design – stirred configuration
Trial Q WPE MI SE Tout Pout Φ Trial Q WPE MI SE Tout Pout Φ
Table 5: Statistically significant effects (95% confidence) of the 25 complete design1 – stirred configuration
Q WPE MI SE Tout Pout Profit
Mean 87.64 20.26 25.98 1.272 548.67 101.03 2294.4 (1)Wt --- 3.42 -5.27 0.005 --- -8.80 426.2
(2)M -9.66 7.20 -11.28 0.004 84.02 -16.15 --- (3)CAT 12.02 2.86 43.33 0.027 37.52 13.91 828.4 (4)Ws -3.28 -0.82 17.38 -0.027 -8.35 8.04 -739.0
(5)H2,0 --- --- 38.08 -0.013 --- 15.37 -1070.3 1
second and third order interaction effects are omitted
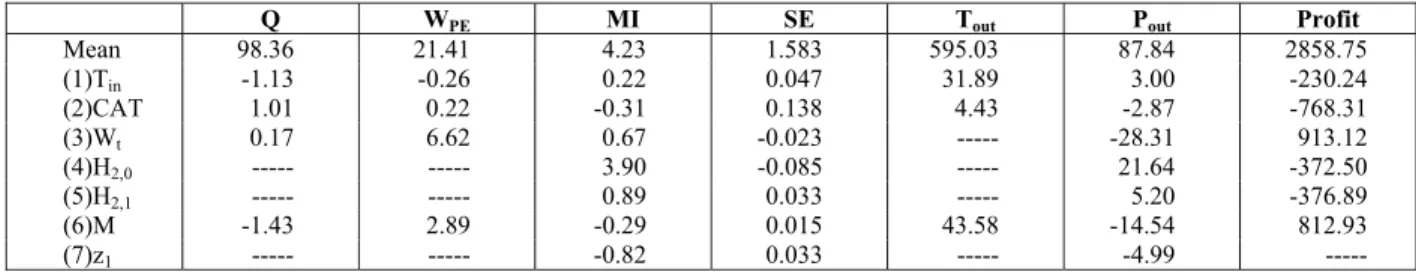
Table 6: Statistically significant effects (95% confidence) of the 27 complete design – tubular configuration1
Q WPE MI SE Tout Pout Profit
Mean 98.36 21.41 4.23 1.583 595.03 87.84 2858.75 (1)Tin -1.13 -0.26 0.22 0.047 31.89 3.00 -230.24
(2)CAT 1.01 0.22 -0.31 0.138 4.43 -2.87 -768.31 (3)Wt 0.17 6.62 0.67 -0.023 --- -28.31 913.12
(4)H2,0 --- --- 3.90 -0.085 --- 21.64 -372.50
(5)H2,1 --- --- 0.89 0.033 --- 5.20 -376.89
(6)M -1.43 2.89 -0.29 0.015 43.58 -14.54 812.93 (7)z1 --- --- -0.82 0.033 --- -4.99 --- 1
second and third order interaction effects are omitted
For the description of the individual responses yn,
a polynomial model can be obtained by least square regression, which is given by the general expression:
k k 1 k
n 0 i i i, j i j i 1 i 1 j i 1
k 2 k 1 k
i, j,l i j l i 1 j i 1l j 1
y b b x b x x
b x x x ,
n 1,..., nr,
−
= = = +
− −
= = + = +
= + ⋅ + ⋅ ⋅ +
⋅ ⋅ ⋅
=
∑
∑ ∑
∑ ∑ ∑
(10)where xi is each studied factor, bi is its respective
effect, bi,j and bi,j,l are two- and three-order interaction
effects, respectively, b0 is the mean effect, k is the
number of factors and nr is the number of monitored responses. Coefficients bi, bi,j and bi,j,l correspond to
half of the statistically significant effects presented in Tables 5 and 6 (Box et al., 1978; Box and Hunter, 2005) considering the 95% confidence level.
A commonly used method for evaluating the model adjustment is Analysis of Variance (ANOVA) as it provides some statistical parameters such as the coefficient of determination R2 and the F-value, which compares regression and residual variances (Box et al., 1978; Box and Hunter, 2005). Table 7 shows these statistical tests based on ANOVA for stirred and tubular configurations. The F-values are much higher than the tabulated ones, indicating model reliability at the 95% level of confidence. Observing the listed F-values for 99% confidence, it can be concluded that the model is still reliable at this higher confidence level. Additionally, the fact that the determination coefficients R2 approach one (1) reinforces the good fit of the models. It is therefore possible to obtain response surfaces in order to investigate the behavior of the process better. It is worth highlighting that it is not necessary to carry out a central composite design to obtain second order models due to the excellent adjustment of the linear models obtained by the two-level complete factorial design.
Table 7: Statistical tests based on ANOVA for model analysis
25: stirred configuration 27: tubular configuration
F-value (95%) F-value (95%)
R2 DF (R,r)
calculated tabulated R
2 DF (R,r)
calculated tabulated Q 0.9762 (3, 29) 395.64 2.93 0.9272 (8, 120) 191.13 2.02 RA 0.9950 (7, 25) 711.74 2.40 0.9995 (9, 119) 26868.68 2.75 MI 0.9896 (13, 19) 139.28 2.29 0.9993 (37, 91) 3399.82 1.54 SE 0.9963 (15, 17) 300.99 2.31 0.9959 (34, 94) 666.77 1.56 Tout 0.9981 (5, 27) 2820.70 2.57 0.9897 (8, 120) 1437.89 2.02
Pout 0.9831 (13, 19) 85.08 2.29 0.9989 (37, 91) 2141.88 1.54
Φ 0.8996 (6, 26) 38.82 2.47 0.9926 (14, 114) 1096.60 1.84 Listed F-values at 99%: F3,29=4.54; F7,25=3.46; F13,19=3.30; F15,17=3.31; F5,27=3.78; F6,26=3.59.
Figure 6 demonstrates that a higher catalyst concentration leads to a polymer with higher SE and MI when operating in the stirred configuration. A higher catalyst inlet concentration makes more active centers for polymer growth available. This means there is a higher probability of forming different polymer chains, producing more heterogeneous polymer resins, i.e., with higher SE values. The availability of more active centers also contributes to the formation of shorter polymeric chains, increasing MI as observed. The higher outlet temperatures observed when more catalyst is fed into reactor (see catalyst effect on Tout in Figure 2 (c)) might also be
associated with the formation of shorter polymer chains. Higher temperatures enhance transfer and termination reaction rates, yielding polymer chains with a lower molecular weight, i.e. with a higher MI.
The catalyst interaction effect with the side feed (Ws) must also be considered when controlling MI
and SE, as can be seen in Figure 6. Higher side feed values lead to a better mixing inside the reactor, producing a polymer with lower SE, i.e., a more homogeneous resin. On the other hand, higher side feeds yield a polymer with higher MI or lower molecular weight because, at the top of the CSTR,
the residence time is lower and the temperature is higher.
Hydrogen is a chain transfer agent used to control the molecular weight distribution. Higher hydrogen concentrations enhance transfer reactions, reducing polymer molecular weight and therefore increasing MI (Figure 7 (a)). It is also worth highlighting the non-linear behavior of hydrogen and ethylene concentrations on MI (Figure 7). At low chain transfer agent concentration, an increase in monomer concentration leads to a higher MI, but the opposite effect is observed at higher hydrogen concentrations. This behavior can be associated with the combined effects of transfer and propagation reactions. In the absence of hydrogen, a greater amount of monomer may be consumed in transfer reactions, yielding a polymer with higher MI (lower molecular weight) for increasing monomer concentrations. On the other hand, at higher hydrogen concentrations, the additional monomer is preferentially consumed in propagation reactions, whereas the hydrogen is consumed in transfer reactions. Such non-linear behavior cannot be identified solely through effects analysis or one-at-a-time simulations, indicating the usefulness of the response surfaces and the proposed approach.
(a) (b) Figure 6: Influence of the catalyst inlet concentration and the side feed on (a) SE and (b) MI – stirred
configuration. The other variables are at the central point.
(a) (b) Figure 7: Melt index (MI) versus hydrogen and monomer inlet concentrations – stirred configuration:
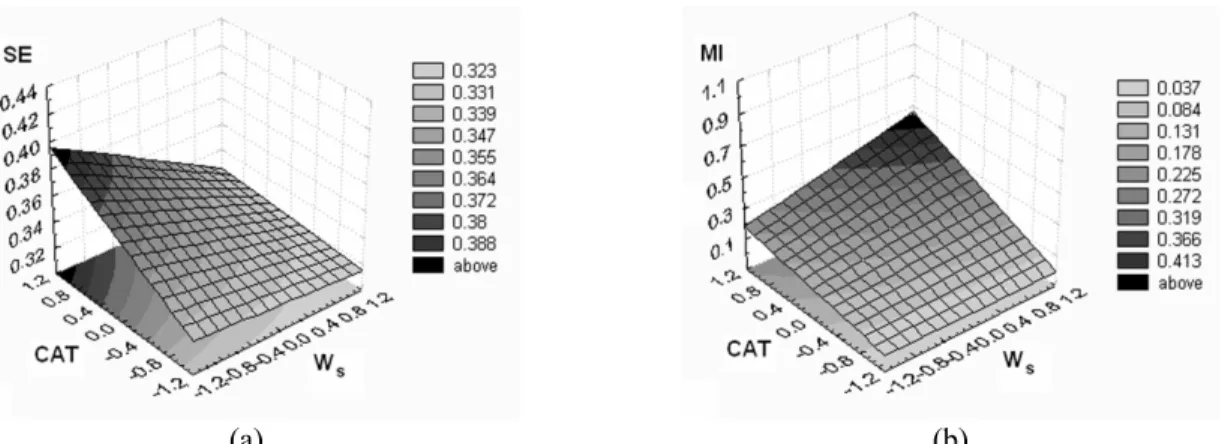
(a) (b) Figure 8: Influence of the hydrogen lateral point and the concentration at that point on (a) MI and
(b) SE – tubular configuration. The other variables are at the central point.
Figure 8 depicts the influence of the hydrogen lateral injection point (z1) and its concentration (H2,1)
on MI (inverse measurement of molecular weight) and SE (direct measurement of polydispersity) when using the tubular configuration. As stated above, higher hydrogen inlet concentrations increase MI (Figure 8 (a)). Moreover, when hydrogen is injected closer to the reactor inlet (lower z1), it contributes
more to transfer reactions due to the longer residence time, thus decreasing molecular weight or increasing MI (Figure 8 (a)). At higher z1, a considerable
amount of dead polymer already exists and hydrogen can no longer contribute to molecular weight. Therefore, if hydrogen is injected very far from the reactor inlet, an increase in its concentration has no major effect on MI (Figure 8 (a)). On the other hand, it has a considerable effect on SE (polydispersity), as illustrated in Figure 8 (b). The chain transfer agent triggers a discontinuity in the reactor profile at the injection point and the polymer tends to be more heterogeneous downstream because the final resin is a mixture of polymers produced in each reactor region. The greater the distance between the reactor inlet and the first hydrogen injection point (z1), the
more heterogeneous or polydisperse (higher SE) the polymer produced (Figure 8 (b)) because a considerable amount of dead polymer already exists at z1.
Obviously, higher hydrogen concentrations at that point enhance this effect (Figure 8 (b)). Such effects are more easily understood when assisted by response surfaces.
CONCLUDING REMARKS
This paper presents the use of the design of experiments as a preliminary stage for an optimization problem applied to a polymerization
process. In this process, the chemical reaction takes place in a series of CSTR and PFR reactors arranged in two different configurations, stirred and tubular. A screening design is first carried out in order to identify the process variables that should be considered as decision variables. The Plackett-Burman design with 16 trials reduces the number of decision variables and, therefore, the complexity of the optimization problem. Because this work deals with model-based experiments, it is possible to handle a greater number of trials and to further explore the potential of the design of experiments using a complete factorial design. For the stirred configuration, 5 variables are investigated, while for the tubular configuration 7 variables are considered. Two complete designs are therefore carried out: 25 and 27. Polynomial models for several monitored responses are obtained and the respective analyses of variance demonstrate a satisfactory fit. The investigation of the process with the aid of response surfaces reveals interaction effects which otherwise would be much more time consuming or difficult to understand by varying one factor at a time. Highly non-linear interaction effects can be easily observed, for example, between ethylene and hydrogen inlet concentrations on MI. The results show that the approach presented in this paper is able not only to reduce the number of decision variables of a future optimization problem, but also to map the feasible optimal region as preliminary information for process optimization, providing insights and a valuable understanding of the process behavior itself.
ACKNOWLEDGMENT
FAPESP (Fundação de Amparo à Pesquisa do Estado de São Paulo), FAPESB (Fundação de Amparo à Pesquisa do Estado da Bahia) and CNPq (Conselho Nacional de Desenvolvimento Científico e Tecnológico) for financial support.
NOMENCLATURE
a polyethylene market price (€/kg)
b unitary costs (€/kg); empirical
model coefficients CAT catalyst CC co-catalyst DFR, DFr regression and residual
degrees of freedom
H2,0 hydrogen concentration
at main feed
H2 hydrogen
H2,j, H2,1 hydrogen concentration at lateral
injection point
J number of PFR compartments
M monomer
MI polymer Melt Index
nr number of monitored responses
Pin inlet pressure
Pout outlet pressure
Q conversion
Rot agitator rotation
SE polymer Stress Exponent
Tin inlet temperature
Tout outlet temperature
W mass flow rate (kg/s)
WPE polymer production rate
Ws side feed
Wt total mass flow rate
zj,z1 lateral hydrogen injection point
Subscript
CAT catalyst CC co-catalyst H hydrogen
j PFR compartment
M monomer PE polyethylene
s reactor stirred configuration
S solvent
t reactor tubular configuration
Greek Letters
Φ objective function (profit)
REFERENCES
Box, G. E. P. and Hunter, W. B., Design for Experimenters: Design, Innovation and Discovery. 2nd ed. John Wiley and Sons, New York (2005).
Box, G. E. P., Hunter, W. G. and Hunter, J. S., Statistics for Experiments – An Introduction to Design Data Analysis and Model Building. John Wiley & Sons, New York (1978).
Calumby, R., Cardinalli, D., Roxo, G., Rocha, E. and Porto, J., UHMWPE – Effect of Compression Molding Processing Parameters on Sheet Properties. In: The Polymer Processing Society 23rd Annual Meeting (PPS-23), Salvador - Brazil (2007).
Chan, W.-M., Gloor, P. E. and Hamielec, A. E., A Kinetic Model for Olefin Polymerization in High-Pressure Autoclave Reactors. AIChE Journal, 39, 111 (1993).
Costa, T. H. S., Carvalho, D. L., Souza, D. C. S., Coutinho, F. M. B., Pinto, J. C. and Koktad, B. V., Statistical experimental design and modeling of polypropylene–wood fiber composites. Polymer Testing, 19, 419 (2000).
Embiruçu, M., Lima, E. L. and Pinto, J. C., Continuous Soluble Ziegler-Natta Ethylene Polymerizations in Reactor Trains. I. Mathematical Modeling. Journal of Applied Polymer Science, 77, 1574 (2000).
Embiruçu, M., Prata, D. M., Lima, E. L. and Pinto, J. C., Continuous Soluble Ziegler-Natta Ethylene Polymerizations in Reactor Trains – II. Estimation of Kinetic Parameters from Industrial Data. Macromolecuar Reaction Engineering, 2, 142 (2008). Forte, M. M. C., Cunha, F. O. V., Santos, J. H. Z. and
Zacca, J. J., Ethylene and 1-butene Copolymerization Catalyzed by Ziegler-Natta/Metallocene Hybrid Catalyst through a 23 Factorial Experimental Design. Polymer, 44, 1377 (2003).
Hasan, S. D. M., Melo, D. N. C. and Maciel, R., Simulation and Response Surface Analysis for the Optimization of a Three-Phase Catalytic Slurry Reactor. Chemical Engineering Science, 44, 335 (2005).
Kalil, S. J., Maugeri, F. and Rodrigues, M. I., Response Surface Analysis and Simulation as a Tool for Bioprocess Design and Optimization. Process Biochemistry, 35, 539 (2000).
Meeting (PPS-23), Salvador – Brazil, (2007). McAuley, K. B., Macgregor, J. F. and Hamielec, A.
E., A Kinetic Model for Industrial Gas-Phase Polyethylene Copolymerization. AIChE Journal, 36, 837 (1990).
Plackett, R. L. and Burman, J. P., The Design of Optimum Multifactorial Experiments. Biometrika., 33, 305 (1946).
Pontes, K. V., Maciel, R., Embiruçu, M., Hartwich, A. and Marquardt, W., Optimal Operating Policies for Tailored Linear Polyethylene Resins Production. AIChE Journal, 54, 2346 (2008). Pontes, K. V., Maciel, R., Embiruçu, M., Hartwich,
A. and Marquardt, W., Optimal process operation for the production of linear polyethylene resins with tailored molecular weight distribution. AIChE Journal, In Press (2010).
Scott, P. J., Penlidis, A. and Rempel, G. L., Ethylene-Vinyl Acetate Semi-Batch Emulsion Copolymerization: Use of Factorial Experiments for Improved Process Understanding, Journal of Polymer Science Part A: Polymer Chemistry, 31,
2205 (1993).
Scott, P. J., Penlidis, A.; Rempel, G. L. and Lawrence, A. D., Ethylene-Vinyl Acetate Semi-Batch Emulsion Copolymerization: Use of Factorial Experiments for Process Optimization, Journal of Polymer Science Part A: Polymer Chemistry, 32, 539 (1994).
Silvares, A. F. M., Nascimento, C. A. O., Oliveros, E., Bossmann, S. H. and Braun, A. M., Optimization of the Photochemically Initiated Polymerization of Methyl Methacrylate. Chemical Engineering Processing, 45, 1001 (2006).
Skourlis, T. P., Mohapatra, B., Chassapis, C. and Manoochehri, S., Evaluation of the Effect of Processing Parameters on the Properties of Advanced Styrenic Resins: A Design of Experiments Approach. Advances in Polymer Technology, 16, 117 (1997).