This is an Open Access article distributed under the terms of the Creative Commons Attribution Non-Commercial License
Received: Sept. 14, 2015 Accepted: June 07, 2016
E-mails: [email protected]. br (AFA), [email protected] (AMC), [email protected] (RGM)
Abstract: This paper aimed to study the correlation between Real Time Integrated Weld Analyzer measurements and peel test results. The experiment involved study of weld nuggets for different combinations of sheet thicknesses, welding time and current of mild steel samples. The intent was to assess the potential use of a real time integrated ultrasonic system in the industrial environment allowing nondestructive evaluation of 100% of the spot welds produced. The results showed high correlation between nugget penetration into the sheets and nugget size measured ultrasonically and destructively, for all evaluated parameters.
Key-words: Resistance Spot Welding (RSW); Real-Time Integrated Weld Analyzer; Peel test; Weld quality.
Correlação entre Teste de Destacamento e Teste Ultrassônico em Tempo
Real para Diagnóstico da Qualidade em Soldagem a Ponto
Resumo: Este trabalho teve como objetivo estudar a correlação entre medidas obtidas por Real Time Integrated Weld Analyzer e resultados de teste de destacamento. O experimento envolveu o estudo das lentilhas de solda para diferentes combinações de espessura de chapas, tempo de soldagem e corrente de soldagem, para amostras de aço de médio teor de carbono. A intenção foi avaliar o potencial uso do sistema ultrassônico integrado em tempo real no ambiente industrial permitindo a avaliação não destrutiva de 100% das juntas soldadas. Os resultados mostraram alta correlação entre penetração das lentilhas e diâmetro medidos ultrassônicamente e destrutivamente, para todos os parâmetros avaliados.
Palavras-chave: Soldagem a ponto por resistência (RSW); Real-Time Integrated Weld Analyzer; Teste de destacamento; Qualidade de solda.
1. Introduction
In resistance spot weld quality assessment, the main criteria evaluated are: diameter of the weld nugget and shear strength. The nugget weld size formed during the welding process can be evaluated by peel test, and there is a correlation between the diameter of the nugget and joint strength [1]. Due to its relative ease, peel test is used as a key criterion of quality in production especially in the automotive sector.
One of the disadvantages of using the peel test method is the need for the destruction of the component to be inspected [2], so the evaluation is done by selective sampling. Several non-destructive quality assessment methods for resistance spot welding have recently been proposed, including the Real Time Integrated Weld Analyzer (RIWA), by Tessonics. Such ultrasonic system can evaluate liquid metal penetration and weld nugget size automatically and in real time.
The RIWA system is a device capable of performing quality inspection of spot welds during the welding process. A high-frequency transducer is integrated into the welding gun electrode; this transducer generates ultrasonic waves that pass through the cooper electrode cap into the welded plates. These waves are reflected and received by the same transducer. The range of interest is the area between the two plates where the weld will be produced represented as wave reflection 2 and 4 in Figure 1. Several pulses are emitted during the welding process.
Correlation between Peel Test and Real Time Ultrasonic Test for Quality
Diagnosis in Resistance Spot Welding
Angelo F. Andreoli1, Andriy M. Chertov2, Roman Gr. Maev2
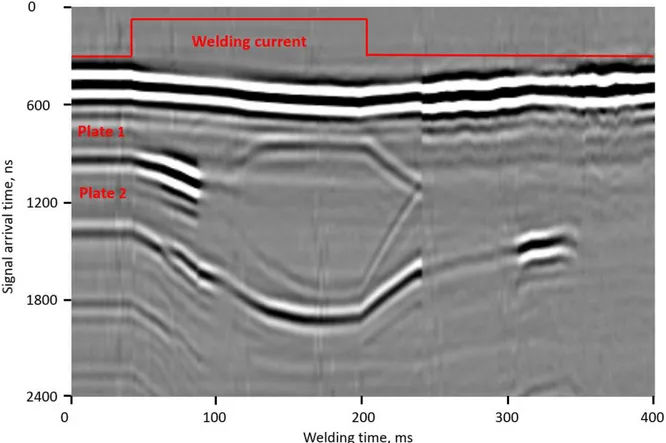
temperature. The more material is heated the bigger delay the back wall reflection will experience, a characteristic curve forming the melting process of the plates is shown in Figure 2. Here the top line is the dynamics of the front wall and the bottom line in the middle of the image is representing dynamics of the back wall. During welding, the heat generated in the plates reduces the speed of sound in metal and causes back wall reflections to arrive later. The process reverses when current is shut off.
Figure 1. Model of ultrasound setup for RIWA.
The union of all A-scans obtained during the process is treated by software and generates a B-scan that can be seen as a signature of the welding process. Each column in the B-scan represents an A-scan obtained at a certain time during welding. Figure 2 shows an example of a B-scan where the A-scans were taken every 2 milliseconds, in that the image is clear to see that the melting and solidification of the material between the plates. Thus, weld quality can be interpreted through its ultrasonic signature [4]. There was discovered strong correlation between some ultrasonic parameters and the nugget diameter. One of those parameters is time of flight of the ultrasound through the total stack. The more it is heated the higher TOF value is.
2. Experimental Procedures
Several specimens were welded using mild steel plates (carbon 0.15 to 0.30 wt. %) with thicknesses of 0.7, 1.35, 1.80 to 1.85 millimeters (mm), apart from using samples with two (2T) or three sheets (3T) joined, also with different thicknesses combination. In order to achieve different weld nugget sizes varying from stick welds to expulsion, representing the extremes in spot welding, the current flow (kilo-amperes) during the welding process varied as well the welding time, but the compression force (pounds) was kept the same, as shown in Table 1. For each test, approximately 20 specimens were welded. The purpose of intentionally produce welds with nugget sizes varying from stick weld to expulsion was to analyze if the ultrasonic system would be able to build confidence data even in situations where welds are not produced according to established standards.
Table 1. Experimental model.
Test Pla te thick ness 1 (mm) Pla te thick ness 2 (mm) Pla te thick ness 3
(mm) Time (60 Hz c
y cles) L o w est curr en t (kA ) H ighest curr en t (kA ) F or ce (lb )*
1 0.7 1.8 0 18 5.0 8.6 605
2 0.85 1.85 1.35 20 6.0 9.0 603
*Force in pounds’ unit.
The samples were welded using a resistance spot welder, Medweld 3000s model, Centerline Co., at the Dissimilar Materials Laboratory of the University of Windsor. The equipment is connected to a RIWA system, which uses a 10 MHz single-element transducer that produces B-scan readings for every weld produced and maintains the collected data in a database for further analysis.
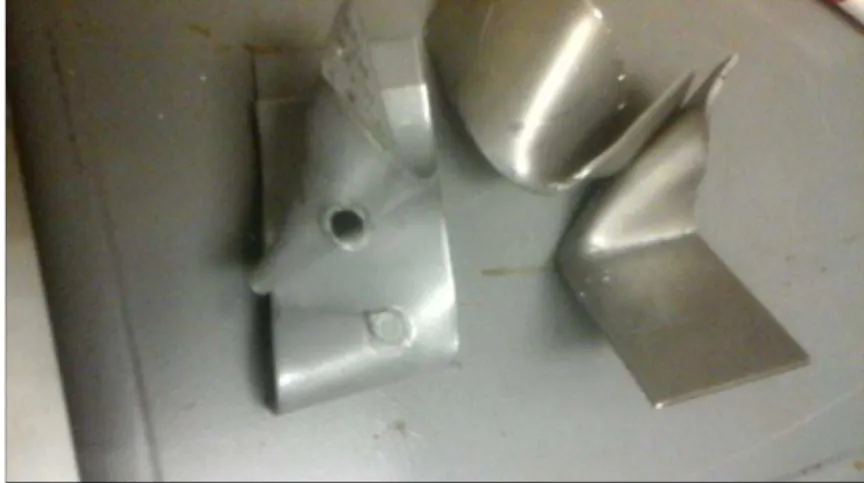
After welding, specimens were catalogued to their corresponding time and date (date/time stamp) with the data derived from the RIWA system for future statistical analysis between the peel test and the ultrasound test data. The specimens were peel tested according to ASTM D1876-08 [5], Figure 3, and established the nugget diameter for each individual nugget previously examined by ultrasound test during the welding process. The data provided by the RIWA system reports on nugget diameter and liquid penetration into the plates of the manufactured welds.
The results of the two different data collected were statistically processed using Excel to find the corresponding correlation and coefficient of determination between them.
3. Results and Discussion
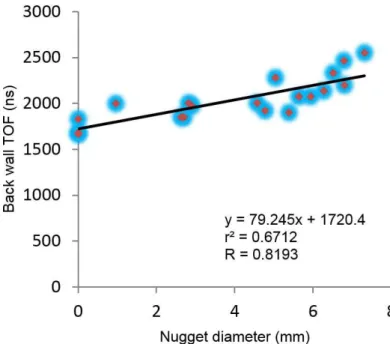
The correlation results for 3T samples are shown at Graphics 1 to 3 below. The correlation of the back wall TOF was obtained between the ultrasonic measurement and nugget diameter obtained by peel test and a value of R= 0.8193 was attained, (Graphic 1). A value considerably lower than the correlation of the front wall TOF ultrasonically obtained and nugget diameter obtained by peel test for the same experiment which values R= 0.9536 (Graphic 2). This difference in correlation coefficients comes from the fact that the front wall delay is determined exclusively by sound speed in cooper while for the back wall it is more complex. The back wall reflection arrival
Graphic 1. Correlation between back wall TOF and nugget diameter for 3T stacks.
time depends on both sound speed in the steel stack and stack thickness that becomes thinner as indentation forms. The TOF change in steel (back wall) is bigger than in cooper cap (front wall) because steel heats up more than cooper does. Nevertheless, the results demonstrate high correlation for TOF values and nugget diameters. The coefficient determinations are r2 = 0.6712 and r2 = 0.9093 for back wall TOF and front wall TOF respectively.
The correlation for liquid penetration into the plates obtained between ultrasonic penetration measuring and nugget diameters determined by peel test for 3T stack is shown in Graphic 3. The result R= 0.8452 demonstrates high correlation for the data studied. The coefficient determination is r2 = 0.7143. The liquid penetration into the
sheets is ultrasonically determined by the difference between the height of the stack and the nugget thickness determined ultrasonically.
Graphic 3. Correlation between liquid penetration and nugget diameter for 3T stacks.
Spot welding of 3T stacks produces two different nuggets for the same sample: one nugget for the interface between plates 1 and 2 and the second nugget between the interface of plates 2 and 3 as shown in Figure 4. For this, we can determine a relation on the final diameters between nuggets 1 and 2.
Figure 4. 3T stack nuggets formation.
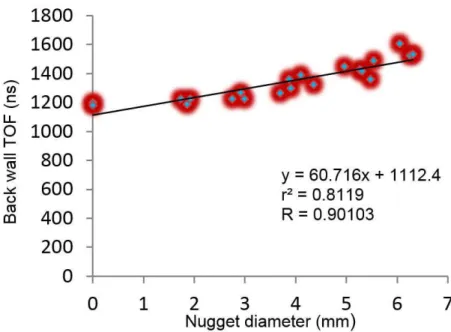
For 2T stacks, the correlation results are shown from graphics 5 to 7 below. As for the 3T stacks, correlation between front wall and back wall TOF values ultrasonically measured were compared to peel test results of the same destructed components. The correlation for the back wall TOF and nugget diameter attained was R = 0.90103 (Graphic 5), and for the front wall this correlation was R = 0.8617 (Graphic 6). The same pattern of correlation for the studied data of 3T stacks is noticed for 2T stacks where front wall TOF and nugget diameter have a greater value of correlation compared to the back wall TOF.
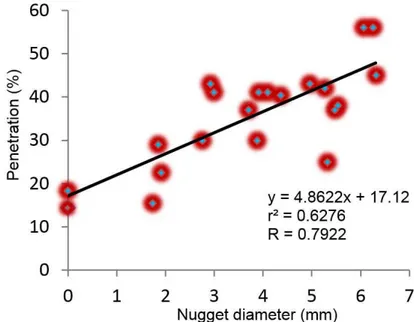
For liquid penetration of the nuggets into 2T stacks and the nugget diameter the result is R = 0.7922 and a coefficient of determination of r2 = 0.6276, also showing a high correlation value.
Graphic 4. Relation between the two nuggets in the 3T stack.
4. Conclusions
From the present work, we can conclude:
- There is high correlation for all the evaluated parameters tested in this work between real time ultrasonic test and peel test allowing to use this system with reliability for spot welding assessment for the all the parameters studied in this work.
- Real-time ultrasonic test compared to peel test has the advantage to allow the inspection of 100% of all spot weld joints produced in an industrial environment, with great reliability of data collected, not requiring stops for the inspection and the destruction the component assessed.
- Real-time ultrasonic testing is a promising nondestructive method for quality assessment of spot weld joints. Further work may be conducted for welding of dissimilar materials and different welding schedules as well the establishment of procedures and codes for this inspection method.
Acknowledgements
The author Angelo F. Andreoli greatly acknowledges the financial support provided by CNPq (National Council for Scientific and Technological Development), Brazil, as a scholarship of the Ciências sem Fronteiras (CSF) program and IDIR and the University of Windsor for the opportunity to be part of this work during his internship.
References
[1] Karloff AC. Real-time expulsion detection and characterization in ultrasound m-scans of the resistance spot welding process [doctor thesis]. Windsor: University of Windsor; 2013. [2] Stocco D. Caracterização de solda por resistência a ponto através
de avaliações não destrutivas [dissertação de mestrado). São Paulo: Universidade de São Paulo; 2010.
[3] Chertov A, Furlanetto V, Maev R, Regalado W. Integration of the ultrasonic real-time spot weld monitoring system. In: Imende,
A.C. Proceedings of the 5th Pan American Conference for NDT;
2011 October 2-6; Cancun, Mexico. Mexico, D.F., 2011. p. 102.
[4] Stocco D, Batalha G, Chertov A, Furlanetto V, Maev R, Comparison between in - line ultrasonic monitoring of the spot weld quality and conventional ndt methods applied in a real production
environment. In: Chinese Society for Non-destructive Testing. Proceedings of the 17th World Conference on Nondestructive
Testing; 2008 October 25-28, Shanghai, China. Shangai: Chinese
Society for Non-destructive Testing, 2008. p. 308.