*e-mail: [email protected]
1. Introduction
Hyperelastic materials such as rubber are widely used for diverse structural applications in variety of industries ranging from tire to aerospace. The most attractive property of rubbers is their ability to experience large deformation under small loads and to retain initial coniguration without considerable permanent deformation after load is removed1. Their stress-strain behaviour is highly non-linear and a simple modulus of elasticity is no longer suficient. Therefore, characterization of elastic behaviour of highly extensible, nonlinear materials is of great importance2.
The constitutive behaviour of hyperelastic material is derived from SEF ‘W’ based on three strain invariants I1, I2 and I3. It is the energy stored in material per unit of reference volume (volume in the initial coniguration) as a function of strain at that point in material3.
(
1, 2, 3)
W=f I I I (1)
where I1, I2 and I3are three invariants of Green deformation tensor deined in terms of principal stretch ratios λ1, λ2 and λ3 given by
4:
2 2 2
1 1 2 3
2 2 2 2 2 2 2 1 2 2 3 3 1
2 2 2 3 1 2 3
I
I
I
λ λ λ
λ λ λ λ λ λ
λ λ λ
= + +
= + +
=
(2)
Generally, hyperelastic materials are considered incompressible, i.e. I3 = 1; hence only two independent strain measures namely I1 and I2 remain. This implies that ‘W’ is a function of I1 and I2 only2;
(
1 , 2)
W=W I −3 I −3 (3)
The selection of suitable SEF depends on its application, corresponding variables and available data for material parameter identiication5. Chagnon et al.6 described four main qualities of an eficient hyperelastic material model as follows:
▪ It should have the ability to exactly reproduce the entire ‘S’ shaped response of rubber
▪ The change of deformation mode should not be problematic, i.e. if the model operates satisfactorily in uniaxial tension, it must also be satisfactory in simple shear or in equibiaxial extension
▪ The number of itting material parameters should be small, in order to decrease the number of experimental tests needed for their determination
▪ The mathematical formulation should be simple to render possible the numerical implementation of the model.
For a precise prediction of rubber behaviour, used in an assembly (e.g. lexible joint), by inite element simulation, it should be tested under same loading conditions to which original assembly will be subjected. The uniaxial tests are easy to perform and are well understood7 but uniaxial data alone does not produce reliable set of coeficients for material models8, especially if the original assembly experiences complex stress states. Therefore, biaxial, planar (pure shear) and volumetric tests need to be performed along with a uniaxial tension test to incorporate the effects of multiaxial stress states in the model.
For speciic applications, the tailoring of rubber mechanical properties is carried out by the addition of various chemicals.
Mechanical Characterization and FE Modelling of a Hyperelastic Material
Majid Shahzada*, Ali Kamranb, Muhammad Zeeshan Siddiquia, Muhammad Farhana
aAdvance Materials Research Directorate, Space and Upper Atmosphere Research Commission –
SUPARCO, Karachi, Sindh, Pakistan
bInstitute of Space Technology – IST, Islamabad Highway, Islamabad, Pakistan
Received: August 25, 2014; Revised: July 29, 2015
The aim of research work is to characterize hyperelastic material and to determine a suitable strain energy function (SEF) for an indigenously developed rubber to be used in lexible joint use for thrust vectoring of solid rocket motor. In order to evaluate appropriate SEF uniaxial and volumetric tests along with equi-biaxial and planar shear tests were conducted. Digital image correlation (DIC) technique was utilized to have strain measurements for biaxial and planar specimens to input stress-strain data in Abaqus. Yeoh model seems to be right choice, among the available material models, because of its ability to match experimental stress-strain data at small and large strain values. Quadlap specimen test was performed to validate material model itted from test data. FE simulations were carried out to verify the behavior as predicted by Yeoh model and results are found to be in good agreement with the experimental data.
Minor changes in chemical composition can alter mechanical properties signiicantly. Therefore, it is essential to test a particular rubber composition and simulate through FEA to have an apposite SEF. Once determined, this can be used for simulating the assembly in which particular rubber has been used. FE software packages like Abaqus offer a number of SEFs to accommodate the nonlinear behavior of rubber and other hyperelastic materials. This study shows that Yeoh model has an advantage over other available material models because of its good match with experimental data over large strain values for given rubber composition.
2. Hyperelastic Models in Abaqus
In Abaqus , two types of hyperelastic material models are available and each model deines the strain energy function in a different way9. One is the phenomenological models which treat the problem from the viewpoint of continuum mechanics and stress-strain behaviour is characterized without reference to the microscopic structure. Other one is physically motivated models which consider the material response from the viewpoint of microstructure. A brief review about the hyperelastic models available in Abaqus exploited during this study is given below.
2.1. Mooney-Rivlin model
Two parameters phenomenological model that works well for moderately large stains in uniaxial elongation and shear deformation10,11. But, it cannot capture the upturn (S-curvature) of the force-extension relation in uniaxial test and the force-shear displacement relation in shear test. For a compressible rubber, model has a form
(
)
(
)
(
)
210 1 01 2 el
1
1
W C I 3 C I 3 J 1
D
= − + − + − (4)
2.2. Neo-Hookean model
This model is a special case of Mooney-Rivlin form with C01= 0 and can be used when material data is insuficient. It is simple to use and can make good approximation at relatively small strains. But, it too cannot capture the upturn of stress strain curve.
(
)
(
)
210 1 el
1
1
W C I 3 J 1
D
= − + − (5)
2.3. Full Polynomial model
For isotropic and compressible rubber, polynomial model can be given as
(
) (
)
(
)
,
j 2i
N i N
ij 1 2 el
i j 0 i 1 i
1
W C I 3 I 3 J 1
D
= =
= ∑ − − +∑ − (6)
Where:
Cij= material constants that control the shear behaviour and can be determined from uniaxial, biaxial and planar tests. Di = material constant that control bulk compressibility and set to zero for fully incompressible rubber. It can be estimated from volumetric test.
Jel = Elastic volume ratio
N = Number of terms in strain energy function. Abaqus allows up-to 6 terms.
2.4. Reduced Polynomial model
This model does not include any dependency on I2. The sensitivity of strain energy function to variation in I2 is generally much smaller than the sensitivity to variation in I1. It appears that eliminating the terms containing I2from strain energy function improves the ability of the models to predict the behaviour of complex deformation states when limited test data is available12. The Neo-Hookean form is irst order reduced polynomial model.
2.5. Yeoh model
In 1993, Yeoh13 proposed a phenomenological model in the form of third-order polynomial based only on irst invariant I1. It can be used for the characterization of carbon-black illed rubber and can capture upturn of stress-strain curve. It has good it over a large strain range and can simulate various modes of deformation with limited data. This leads to reduced requirements for material testing14. The Yeoh model is also called the reduced polynomial model and for compressible rubber can be given as
(
)
i(
)
3 3 2i
i0 1 el
i 1 i 1 i
1
W C I 3 J 1
D
= =
=∑ − +∑ − (7)
2.6. Ogden model
Proposed in 1972 by Ogden15,16, this is also a phenomenological model and is based on principal stretches instead of invariants. The model is able to capture upturn (stiffening) of stress-strain curve and models rubber accurately for large ranges of deformation. Attention should be paid not to use this model with limited test (e.g. just uniaxial tension). A good agreement has been observed between Ogden model and Treloar’s17 experimental data for unilled rubber for extensions up to 700%.
(
i i i)
(
)
N N 2i
i
el
1 2 3
2
i 1 i i 1 i
2 1
W 3 J 1
D
α α α µ λ λ λ α
= =
=∑ + + − +∑ − (8)
i
λ
is the deviatoric principal stretch and μi, αiare temperature dependent material properties. Abaqus allows up to N = 6 terms in the above form.2.7. Arruda-Boyce model
Based on molecular chain network, it is also called Arruda-Boyce 8-chain model because it was developed based on representative volume (hexahedron) element where 8 chains emanate from the center to the corners of the volume18. This is two parameter shear model based only on I1 and works well with limited test data.
(
)
ln( )2 5 i i i el 1 el 2i 2 i 1 m
C 1 J 1
W I 3 J
D 2 µ λ − = − = − + −
∑ (9)
3. Experimental Details
3.1. Material
3.2. Mechanical testing
This section describes the standard tests performed to input stress-strain data into Abaqus to evaluate the material constants for different hyperelastic models. Since the models use a simple reversible stress strain input, one must input a stress strain function that is relevant to the loading condition expected in the application.In order to avoid variation of mechanical properties between rubber characterization results and speciic application, all rubber specimens were manufactured from the same batch with identical curing cycles. The curing cycle parameters were same as that of lexible joint.
3.2.1. Uniaxial test
The test was performed on dumbbell shaped specimens prepared according to Type IV ASTM D638[19]. Testing was carried out on Lloyd LR10K Material Testing Machine and load was measured using 5kN load-cell whereas displacement was measured using extensometer (Figure 1). Initially, rubber specimen was subjected to 20 load cycles in the strain range of 0–400% to get stabilized data. For an engineering analysis, it may be more worthwhile to have precise stress strain measurements in the range of interest rather than to study the strain at failure. Test was performed at ambient conditions and strain rate was selected to be100mm/min.
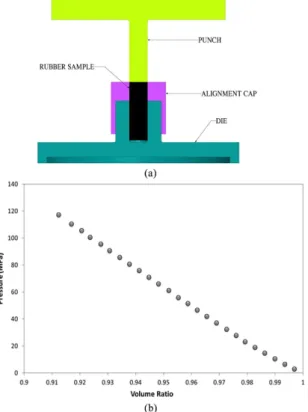
3.2.2. Volumetric test
Volumetric compression ixture consists of punch, die and alignment cap as shown in Figure 2a. The rubber sample was molded in the die which was designed to sit on bottom compression jig of machine. Alignment cap is fastened on the die to provide an initial envelop for the punch to align itself and also to ensure that mating surfaces of punch and rubber specimen are parallel to each other. Punch was manually inserted in the alignment cap and then pre-load of 50N was applied through machine to ix the assembly. Stabilization of rubber specimen was achieved through cyclic test which consists of 20 cycles in the extension range of 0–1.5mm. Then the specimen was compressed up-to a force of 9kN at test speed of 5mm/min and load-extension data was acquired from Nexygen software coupled with machine. From this data, pressure and volume ratio were calculated to input in Abaqus. An approximate linear relationship was observed between pressure and volume ratio up to 115MPa (Figure 2b) as observed by Bradely et al.20 for a carbon-black illed rubber used in elastomeric bearing.
Table 1. Chemical composition of rubber.
Natural Rubber (gms)
Carbon-Black (gms)
Stearic Acid (gms)
Zinc Oxide (gms)
MBT (gms)
Sulphur-80 (gms)
100 40 6 3 1 1
Table 2. Mechanical properties of rubber calculated by different tests.
Tensile Strength (MPa)
% Elongation
Shear Strength
(MPa)
Shear Modulus
(MPa)
12 610 4.6 0.36
Figure 1. Uniaxial tensile specimen mounted on machine.
Figure 2. (a) Volumetric test ixture CAD model; (b) Experimental
3.2.3. Planar shear test
The rubber specimen was cold bonded with metallic strips which are the primary connection. Nuts and bolts were used as secondary reinforcement for the ixture and a 15mm grip separation was maintained with an aspect ratio of 10. According to Duncan et al.7 stress-strain curves are not inluenced by grip separation at aspect ratios ranging from 4 to 10. As previous tests, rubber stabilization was achieved with 20 cycles in the extension range of 0 – 30mm at test speed of 100mm/min and then the specimen was stretched until fracture. The pull force was recorded using a 10kN load cell. The strain data was carefully checked through DIC for potential debonding or slippage at the rubber metal interfaces. The test setup is shown in Figure 3. A Nikon D90 high resolution CCD camera was placed in front of the specimen to record the test. The camera was carefully aligned such that the specimen surface was approximately parallel to the image plane. A ine speckle pattern was applied to the specimen surface prior to testing.
An indigenously developed DIC system was used to analyze the recorded video21. The system was developed in MATLAB under a separate study and used Levenberg Marquardt algorithm for image correlation. The optical methods for strain measurement are best suited for such applications because the measurement is done remotely without interfering with the lexible specimen geometry or any additional load application. Many researchers8,22,23 have used a similar technique to measure strains in hyperelastic rubber-like materials.
Upon inspection it was found that as long as the bond between metal and rubber remained intact, the total extension in rubber as measured from DIC was identical to the machine extension. In case the bond failed, the specimen geometry and aspect ratios were so varied, due to the arbitrary shape of bond failure, that the relation between initial specimen geometry and test data was no longer valid. Hence it was decided to observe each specimen during extension for any sign of slippage at the rubber metal interface. For specimens with no slippage or debond, the machine extension was directly used for strain measurement for total strain in the specimen.
3.2.4. Biaxial test
Biaxial scissor arm ixture was developed to be used with tensile testing machine. The idea of this ixture was taken from Duncan et al.7 Additionally this article establishes relationship of force per grip. If each arm has a force F, then the force transferred to the grip is 135% of force. Rubber specimen is coated with thin layer of spray paint then another color is used to make a random pattern. Arm-sat 45 degrees to the machine axis were stretched at a speed of 100mm/min, perpendicular directions, providing biaxial tension state, as shown in Figure 4.
4. Experimental Results and Curve Fitting
for SEF Selection
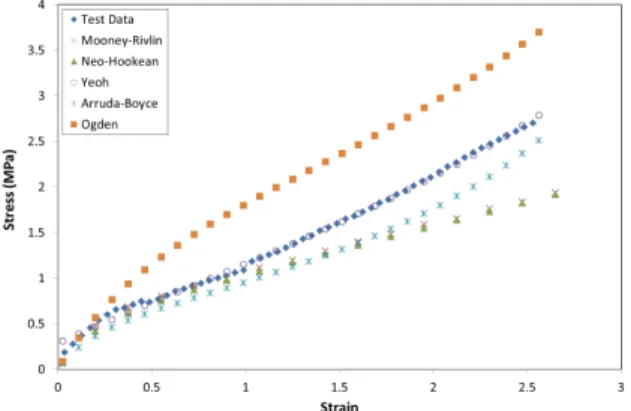
The hyperelastic material curve itting capability in Abaqus allows user to compare different hyperelastic material models with the test data. In Abaqus, the test data are speciied as nominal stress–nominal strain data pairs for uniaxial, planar and biaxial tests to determine the shear constants Cij and to determine the compressibility constants Dij, pressure-volume ratio data can be speciied for volumetric test data. For each stress-strain data pair Abaqus generates an equation for the stress in terms of the strain invariants or stretches and the unknown hyperelastic constants9. The test data, for different deformation modes, were speciied and hyperelastic material models were evaluated to it with experimental data as shown in Figures 5-8. The Yeoh model appeared to be most suitable choice for predicting the behavior of given rubber composition because of its ability to match experimental data points at small and large strain values. The coeficients of Mooney-Rivlin, Neo-Hookean, Yeoh model, Arruda-Boyce and Ogden models as calculated by Abaqus, are given in Tables 3-7 with their average R2 values for all deformation modes.
Figure 3. DIC setup for strain measurements in planar specimen. Figure 4. Test ixture to produce equibiaxial stresses in rubber specimen.
Table 3. Coeficients of Mooney-Rivlin material model.
C10 (MPa) C01(MPa) D1 R
2
Figure 5 . Fitting of different hyperelastic models with uniaxial data.
Figure 6. Fitting of different hyperelastic models with biaxial data.
Figure 7. Comparison of different hyperelastic modelswith test
data for planarspecimen.
Figure 8. Comparison of different hyperelastic modelswith test
data for volumetric experiment.
Table 4. Coeficients of Neo-Hookean material model.
C10 (MPa) D1 R2
0.2587 1.5828e–3 0.9710
5. FE Simulation Results and Discussions
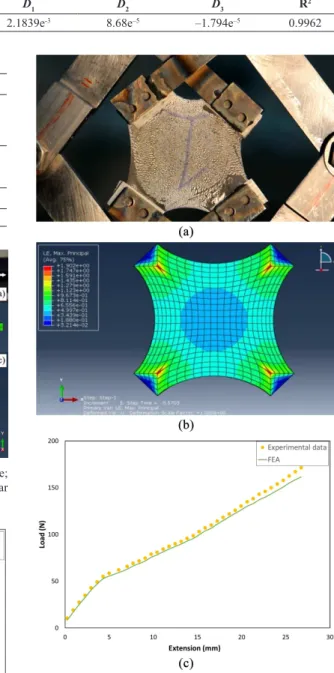
The validation of hyperelastic models with experimental data has been done by many researchers8,24-27 by modeling the test specimens in different FE softwares. As mentioned earlier that an eficient hyperelastic material model should be independent of mode of deformation. To validate the Yeoh model coeficients, inite element analysis was performed to predict the force and extension for quadlap (simple shear) and biaxial test specimen in Abaqus.To get experimental data, quadlap specimen was tested in which four rubber pads were sandwiched between steel plates with adhesive. Thickness of rubber specimen was signiicantly lower than its width and length in order to minimize bending effects24. The testing speed was kept same as that of other tests i.e.100mm/min. For FEA of quadlap test, quadratic hex elements with reduced integration (C3D20R) were used for the model in order to reduce mesh density without affecting solution accuracy. C3D20RH elements were used for rubber pads where H represents hybrid formulation. As the rubber is nearly incompressible, bulk modulus is much larger than shear modulus, FE solution will result in various errors with normal elements such as small change in displacements will cause extremely large changes in pressure, volume strain locking, etc. In order to overcome such issues, hybrid elements are used in which pressure stress is treated as an independently interpolated solution variable that is coupled with displacement solution through constitutive theory9. One end of specimen was constrained i.e. Ux= Uy = Uz = 0, whereas the opposite end was subjected to a displacement in the stretch direction i.e. Ux = 60mm in steps. Figure 9a illustrates the experimental setup while Figure 9b shows FE simulation of quadlap specimen and the stress ield in rubber pads is shown in Figure 9c. A comparison of experimental results with FE simulation of quadlap specimen has shown a good agreement for load-extension data as shown in Figure 10 with a slight deviation at large strain values.
Finally, the equi-biaxial specimen was also simulated via Abaqus. C3D20RH elements were used for biaxial rubber specimen and displacements were applied at four boundary edges. Figure 11a shows the rubber specimen during testing on machine while Figure 11b presents the simulation results of principal logarithmic strains for a total machine displacement of 22mm. Figure 11c graphically depicts the closeness of the FE approximations to the biaxial load-extension data.
The average RMS error was calculated, as per Equation 10, to compare experimental load with FE predicted load values and error was found to be 7.2% in case of quadlap test and 8.6% for biaxial specimen.
exp
exp
N FE
avg
i 1
F F
1
RMS Error
N = F
−
=
∑ (10)
6. Conclusions
In this work, experimental data from four deformation tests were obtained to input into Abaqus in order to calibrate hyperelastic model coeficients for given rubber behavior. DIC technique was employed for strain measurements in planar and biaxial specimen. Among the number of models available in literature and implemented into commercial FE codes, Yeoh model was found to be the most suitable
choice. For the two analyzed deformational states in Abaqus i.e. equi-biaxial and simple shear, the Yeoh model gives a stable analytical description of the material stress–strain response and a good agreement between numerical and experimental data, even at large values of strains.
Acknowledgements
The authors would like to acknowledge Chemical Division for preparation of rubber samples and Materials Research Testing Division for carrying out the testing of samples. The authors would also to thank SUPARCO for providing all the resources for this research purpose.
Table 5. Coeficients of Yeoh, Abaqus form, material model.
C10 (MPa) C20 (MPa) C30 (MPa) D1 D2 D3 R2
0.2019 4.43e–5 1.295e–4 2.1839e-3 8.68e–5 –1.794e–5 0.9962
Table 6. Coeficients of Ogden, N=3, material model.
Mu_I Alpha_I D_I R2
0.4451 –0.2241 1.824e–3 0.9896
3.2898 4.3753 4.596 e–5
2.8917 –2.783 –7.334 e–7
Table 7. Coeficients of Arruda-Boyce material model.
Mu Mu_0 Lamda_M D R2
0.4283 0.4462 3.9142 1.712 e–3 0.9902
Figure 11. (a) Stretching of biaxial specimen on machine, (b)
FEM simulation of same (c) Comparison between numerical and experimental data.
Figure 9. (a) Quadlap shear specimenduring test on machine;
(b) FE simulation of quadlap specimen using Abaqus; (c) Shear stress ield in rubber pads.
Figure 10. A comparison of FE prediction with experimental data
References
1. Brinson H and Brinson L. Polymer engineering science and viscoelasticity: an introduction. Evanston: Springer Verlag; 2008.
2. Gent AN. Engineering with rubber: how to design rubber components. 2nd ed. Munich: Hanser Gardener Publication; 2000.
3. Ali A, Hosseini M and Sahari B. A review of constitutive models for rubber-like materials. American Journal of Engineering and Applied Sciences. 2010; 3(1):232-239. http://dx.doi.org/10.3844/ ajeassp.2010.232.239.
4. Dolwichai P, Limtragool J, Inban S and Piyasin S. In: Hyperelastic Material Models for Finite Element Analysis with Commercial Rubber, Technology and Innovation for Sustainable Development Conference (TISD2006); 2006. Khon Kaen, Thailand. Khon
Kaen: Khon Kaen University; 2006. p.769-774.
5. Khajehsaeid H, Arghavani K and Naghdabadi R. A hyperelastic constitutive model for rubber-like materials. European Journal of Mechanics. A, Solids. 2013; 38:144-151. http://dx.doi. org/10.1016/j.euromechsol.2012.09.010.
6. Chagnon G, Marckmann G and Verron E. A comparison of the Hart-Smith model with Arruda-Boyce and Gent formulations for rubber elasticity. Rubber Chemistry and Technology. 2004; 77(4):724-735. http://dx.doi.org/10.5254/1.3547847. 7. Duncan BC, Maxwell AS, Crocker LE and Hunt R. Verification
of hyperelastic test methods. Teddington: NPL; 1999. NPL Report CMMT(A) 226.
8. Sasso M, Palmieri G, Chiappini G and Amodio D. Characterization of hyperelastic rubber-like materials by biaxial and uniaxial stretching tests based on optical methods. Polymer Testing. 2008; 27(8):995-1004. http://dx.doi.org/10.1016/j. polymertesting.2008.09.001.
9. Dassault Systèmes. Abaqus 6.12. Analysis user’s manual. V. III: materials. Providence: Dassault Systèmes; 2012.
10. Mooney MA. A theory of large elastic deformation. Journal of Applied Physics. 1940; 11(9):582-592. http://dx.doi. org/10.1063/1.1712836.
11. Rivlin RS. Large elastic deformations of isotropic materials I: fundamental concepts. Philosophical Transitions of the Royal Society of London A. 1948; 240(822):459-490.
12. Peeters FJH and Kussner M. Material law selection in finite element simulation of rubber-like materials and its practical application in the industrial design process. In: Dorfmann A and Muhr A, editors. Constitutive models for rubber. Rotterdam: A. A. Balkema Publishers; 1999. p. 29-36.
13. Yeoh OH. Some form of strain energy functions for rubber.
Rubber Chemistry and Technology. 1993; 66(5):754-771. http:// dx.doi.org/10.5254/1.3538343.
14. Renaud C, Cros JM, Feng ZQ and Yang B. The Yeoh model applied to the modeling of large deformation contact/impact problems. International Journal of Impact Engineering. 2009; 36(5):659-666. http://dx.doi.org/10.1016/j.ijimpeng.2008.09.008.
15. Ogden RW. Large deformation isotropic elasticity— on the correlation of theory and experiment for the incompressiblerubber-like solids. Proceedings of the Royal Society of London. Series A, Mathematical and Physical Sciences. 1972; 326(1567):565-584. http://dx.doi.org/10.1098/rspa.1972.0026.
16. Ogden RW. Large deformation isotropic elasticity—on the correlation of theory and experiment for the compressible rubberlike solids. Proceedings of the Royal Societyof London A. 1972; 328(1575):567-583. http://dx.doi.org/10.1098/ rspa.1972.0096.
17. Treloar LRG. The physics of rubber elasticity. 2nd ed. Glasgow: Oxford University Press; 1958.
18. Arruda EM and Boyce MC. A three-dimensional constitutive model for the large stretch behaviour of rubber elastic materials.
Journal of the Mechanics and Physics of Solids. 1993; 41(2):389-412. http://dx.doi.org/10.1016/0022-5096(93)90013-6.
19. American Society for Testing and Materials – ASTM. ASTM Standard D638. Standard test method for tensile properties of plastics. West Conshohocken: ASTM; 2010. Available from: <www.astm.org/Download-D638.pdf>.Access in: 08/14/2014. 20. Bradley GL, Chang PC and McKenna GB. Rubber modeling
using uniaxial test data. Journal of Applied Polymer Science. 2001; 81(4):837-848. http://dx.doi.org/10.1002/app.1503. 21. Siddiqui MZ, Tariq F and Naz N. Application of a two-step
digital image correlation algorithm in determining Poisson’s ratio of metals and composites. In: 62nd International Astronautical Congress; 2011; Cape Town, SA. Cape Town: Materials and
Structures Symposium; 2011.
22. Palmieri G, Chiappini G, Sasso M and Papalini S. Hyperelastic material characterization by planar tension tests and full-field strain measurement. In: Proceedings of the SEM Annual Conference, 2009; Albuquerque, Mexico. Albuquerque: Society
for Experimental Mechanics; 2009.
23. Chevalier L, Calloch S, Hild F and Marco Y. Digital image correlation used to analyze the multiaxial behavior of rubber-like materials. European Journal of Mechanics. A, Solids. 2001; 20(2):169-187. http://dx.doi.org/10.1016/S0997-7538(00)01135-9.
24. Charlton DJ, Yang J and Teh KK. A review of methods to characterize rubber elastic behaviour for use in finite element analysis. Rubber Chemistry and Technology. 1993; 67(3):481-502. http://dx.doi.org/10.5254/1.3538686.
25. Yeoh OH. Some benchmark problems for FEA from torsional behaviour of rubber. Rubber Chemistry and Technology. 2003; 76(5):1212-1217. http://dx.doi.org/10.5254/1.3547798. 26. Mohan CVR, Ramanathan J, Kumar S and Gupta AVSKS.
Characterisation of materials used in flex bearings of large solid rocket motors. Defence Science Journal. 2011; 61(3):264-269. http://dx.doi.org/10.14429/dsj.61.52.