*e-mail: [email protected]
1. Introduction
In2O3 is an important n- type semi- conductor with a wide direct band gap of about (3.5-3.8 eV) of potential use in optoelectronic devices and gas sensing applications1-3. According to the inorganic crystal structure data base, In2O3 is reported to exist on three different structures, two body- centered cubic (bcc) structure (Space group 199) and (Space group 206) as well as rhombohedral (rh) one (Space group 167). Besides the different Bravais lattice, (bcc) or (rh), these polymorphs posses different space groups: I 213 (space group 199), I a 3 (space group 206) and R 3 C (space group 167)4. Several routes such as chemical vapor deposition (CVD)5, Sol gel6, solution phase growth7, and solid state decomposition8,9 have been employed for preparation of In2O3 nanoparticles.
Radiation induced synthesis of nanostructured materials plays an important role in the investigation and production of well- shaped and mono-dispersed nanoparticles. Methods based on the interaction of high energy charged particles
and γ- ray are widely used in making ion- track membrane,
polymeric nanocomposite, and metal oxide nanoparticle10-12.
To the best of our knowledge, we are the irst research group deals with γ-irradiation induced synthesis of In2O3 nanoparticles13.
In our irst submission, we stated with un-irradiated and γ-irradiated indium acetate with 102 kGy γ- ray absorbed
dose as precursors for preparation of In2O3 nanoparticles by sol- gel methods. The results demonstrated different morphologies and particle sizes for the as- synthesized In2O3
nanoparticles as result of γ- irradiation14.
In the present study, we will continue our investigation into
using un-irradiated and γ-irradiated indium acetylacetonate
(InAcAc) as precursors for preparation of In2O3 nanoparticles in presence and absence of sodium dodecyl sulphate (SDS) surfactant by thermal decomposition process. The results
will discuss in view of the role of γ- irradiation and addition
of surfactant on the morphologies, sizes and shapes of as-synthesized In2O3 nanoparticles.
2. Experimental
2.1. Material
Indium (III) acetylacetonate (AcAc) (≥ 99.99% trace
metals basis, Sigma- Aldrich) and sodium dodecyl sulphate
(SDS) (Bioultra, ≥ 99.99% (GC), Sigma- Aldrich) were
used as received.
2.2. Synthesis of In
2O
3nanoparticles
Four samples were prepared for the experiment. The
irst sample contains 0.0024 mole of un-irradiated indium
acetylacetonate (sample A). The second sample contains 0.0024 mole of un-irradiated indium acetylacetonate and
Radiation Induced Synthesis of In
2O
3Nanoparticles - Part II: Synthesis of
In
2O
3Nanoparticles by Thermal Decomposition of Un-irradiated and
γ-irradiated Indium Acetylacetonate
Ajayb Saud Al-Resheedia, Norah Saad Alhokbanya, Refaat Mohammed Mahfouzb*
aDepartment of Chemistry, College of Science, King Saud University – KSU, Riyadh 11451,
P.O. Box 2455, Kingdom of Saudi Arabia
bChemistry Department, Faculty of Science, Assiut University – AUN, Assiut 71516, Egypt
Received: September 21, 2014; Revised: September 7, 2015
Pure cubic phase, In2O3 nanoparticles with porous structure were synthesized by solid state
thermal oxidation of un-irradiated and γ-irradiated indium acetyl acetonate in presence and absence
of sodium dodecyl sulphate as surfactant. The as- synthesized In2O3 nanoparticles were characterized by X-ray diffraction (XRD), fourier transformation infrared spectroscopy (FT-IR), scanning electron
microscopy (SEM), transition electron microscopy (TEM) and thermogravimetry (TG). The shapes and
morphologies of as- synthesized In2O3 nanoparticles were highly affected by γ-irradiation of indium acetyl acetonate precursor and by addition of sodium dodecyl sulphate as surfactant. Calcination of un-irradiated indium acetyl acetonate precursor to 4 hours of 600 °C leads to the formation of spherical- shaped accumulative and merged In2O3 nanoparticles with porous structure, whereas irregular porous architectures composed of pure In2O3 nanoparticles were obtained by using γ-irradiated indium acetylacetonate precursor. The as- prepared In2O3 nanoproducts exhibit photoluminescence emission (PL) property and display thermal stability in a wide range of temperature (25-800 °C) which suggest possible applications in nanoscale optoelectronic devices.
Keywords: indium acetylacetonate, thermal decomposition, γ-irradiation, indium oxide
Al-Resheedi et al.
932 Materials Research
1 mL of 0.1 M sodium dodecyl sulphate solution (sample
B). The third sample contains 0.0024 mole of γ-irradiated
indium acetylacetonate of 102 kGy absorbed dose (sample C).
The fourth sample contains 0.0024 mole of γ-irradiated
indium acetylacetonate of 102 kGy absorbed and 1 mL of 0.1 M sodium dodecyl sulphate solution (sample D). The four samples were encapsulated into four separate stainless steel
cells and allowed to stand in a mufle furnace. The temperature
was raised at a heating rate of 10 °C min−1 to 600 °C and
kept constant for four hours. The reaction took place under
the autogenic pressure of the encapsulated materials. At the end of the reaction, the containers were gradually cooled (5h) to room temperature, and after opening, yellow powders nanoparticles were collected in clean and dry containers and subjected to characterization.
2.3. Characterization
X-ray powder diffraction patterns (XRD) were recorded
on Siemens D 5000 X-ray diffract meter with CuKα radiation (λ=1.54 Å) and operating at 40 KV/ 40 mA.
The scan mode was continuous speed of 2.0 deg. / min.
TG measurements were recorded on Perkin-Elemer TG
A7 thermogravimetric analyzer in the temperature range of 30-1000 °C. The sample weight was 10.0 ± 0.1 mg with heating rate of 10 °C/min. FT-IR measurements were recorded as KBr pellets in the range of 200-4000 cm–1 on
Perkin- Elemer FT- IR spectrophotometer (spectrum 1000).
SEM and TEM images were captured using the models (SEM, JSM-6360 ASEM, JEOL, Japan) and (TEM, JEM-2100F, JEOL, Japan) electron microscopes. Photoluminescence spectra of as- synthesized In2O3 nanoparticles were recorded
using Perkin- Elmer Luminescence Spectrophotometer with
a 450 W Xenon lamp as the excitation source (550 B) at room temperature.
For irradiation, samples were encapsulated under vacuum in glass vials and exposed to successively increasing doses
of radiation at constant intensity. A Co-60 γ-ray source
model gamma cell 220 from MDS (Nordion, Canada) was used for irradiation of the samples. The source was
calibrated against a Fricke ferrous sulphate dosimeter and
the absorbed doses in the irradiated samples were calculated by applying appropriate corrections on the basis of photon
mass attenuation and the energy absorption coeficients
for the sample and the dosimeter solutions15. The dose rate
was 9.83 kGy h–1 and the transient dose was estimated to be
12.07 Gy. All of the irradiations were conducted at 25 °C.
After irradiation, the samples were stored at room temperature for 24 h before analysis.
3. Results and Discussion
Figure 1 shows typical TG/ DTG/DTA curves for the
thermal decomposition of un-irradiated and γ-irradiated
indium acetylacetonate in air atmosphere. The thermograms
collected for γ-irradiated InAcAc display some modiications
in their thermal behaviors compared to those obtained using un-irradiated sample. The major differences in the thermal
behavior between un-irradiated and γ-irradiated samples
are listed in Table 1.
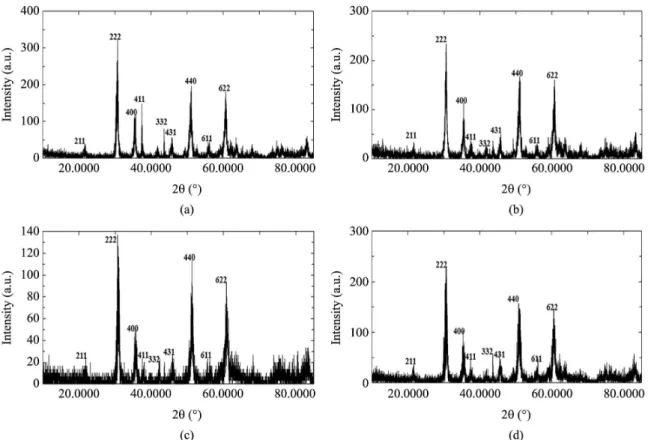
Figure 2 show XRD patterns of the as-synthesized In2O3 nanoparticles obtained under the different experimental
conditions mentioned in the experimental section. All the diffraction lines are indexed undisputedly to pure phase of bcc I a 3 (S G 206) In2O3 structure without indication of other crystalline by-products16. The peaks are quite broad, which demonstrates the nanometric grained nature of the products. The average crystallite size calculated by Debye-sherrer
formula from the (222) relections are listed in Table 2. The unit cell parameter (a) for cubic In2O3 was calculated
using the following Equation17.
2 2 2
a d
h k l
=
+ + (1)
Where d is the d-spacing, h, k, and l are miller indices. By selecting (222) plane, the values of unit cell parameter (a) of the obtained In2O3 nanoparticles under the given experimental conditions were calculated with standard deviation of ± 0.001 and the results are listed also in Table 2.
From Table 2, it could be seen that the In2O3 unit cell
obtained using γ-irradiated InAcAc precursor calcined in
presence of 1 mL SDS (sample D) gave the smallest value of the parameter (a) due to the radiation damage induced by
γ-irradiation in the host lattice of InAcAc as we will discuss
in the section “role of irradiation”.
Figure 3 shows SEM micrographs of In2O3 nanoparticles prepared by calcination of the four samples of InAcAc. All the micrographs display the nanocrystalline nature of the as-synthesized nanoparticles. However, different morphologies were obtained. In sample (a), the surface is composed of porous, nearly spherical-shaped accumulative and merged particles. In the case (b), the irregular porous architecture composed of pure In2O3 was observed. In the case (c), the SEM image display aggregates of irregular-shaped In2O3 porous microsphere. For case (d), the surface is covered by
porous layer of ill-deined In2O3 polyhedron.
TEM images of the as-prepared In2O3 nanoparticles are shown in Figure 4. For samples (a), (b) the TEM images display monodispersed In2O3 nanoparticles , with uniform size and shape. In case (c) the TEM image display porous structure of In2O3. For sample (d), the TEM image show
formation of dark spots of agglomerated crystallites (quantum
dots). There is a random distribution in the size and shape of these crystallites. The average particle size calculated by a simple computer algorithm for samples a, b and c were found to be around 48, 38 and 18.5 nm in good agreement with the values obtained from XRD measurements. The average diameter calculated by computer program in several grids is ~ 3.5 nm[18].
If we compare the morphology of In2O3 nanoparticles synthesized by sol-gel method in our previous publication with that reported in the present investigation using solid state thermal decomposition process, different morphology obtained. In case of sol-gel method the SEM and TEM images of In2O3 nanoparticles synthesized using un-irradiated
indium acetate precursor display agglomerated and ill-deined
spherical nanoparticles and nanocubes respectively. In the present investigation, the SEM and TEM images display
uniform structure of well- deined and monodispersed nanoparticles. In sol-gel method, γ-irradiation afforded coral-like structure (SEM image) and blocks of agglomerated
Figure 1. TG/DTG/DTA curves of. a) Un-irradiated InAcAc; b) γ-irradiated InAcAc (102 kGy).
Table 1. TG/DTG/DTA data of indium acetylacetonate (In2O3).
γ-irradiated InAcAc un-irradiated InAcAc
1
There is a minor weight loss (∼ 5%) in the temperature range of (120-160 °C). The corresponded DTA curve reveal broad and
small endothermic peak maximized at 138 °C attributed to the
loss of adsorbed water on the high surface area of InAcAc created by formation of points defects and lattice imperfections as result
as of γ- irradiation14.
No weight loss was detected up to 190 °C.
2
The main decomposition process for the release of acetylacetonate moieties show thermal event in the temperature range of
(180-260 °C) with small broad three endothermic peaks
centered at 188, 233, 250 °C attributed to step wise release of three coordinated acetyl acetone molecules. The experimentally calculated weight loss percentage (29.8%) was found to be in good agreement with that calculated theoretically (31.6%).
The corresponding decomposition behavior contains three thermal events. The DTA curve reveal two sharp endothermic
peaks maximized at 188 and 266 °C and one minor and broad endothermic peak centered at 222°C. There is also good
agreement between the experimental (29.9%) and theoretical values (31.6%) assuming the release of three acetyl acetone molecules.
3
The minor weight gain for the oxidation to In2O3 was detected in the temperature range of 280-320 °C with small exothermic
peak at 309 °C.
The TG curve shows the weight loss gain process to occur at a
higher and narrow region (310-320 °C). The DTA curve reveal
Al-Resheedi et al.
934 Materials Research
these blocks (TEM image). In the present investigation γ-irradiation afforded irregular porous architecture (SEM)
image and mesoporous structure of In2O3 nanoparticles. Further
discussion on the role of γ-irradiation on the morphology,
size and shape of the as-synthesized nanoparticles will be published in a separate review after complete publication of all series of this project.
Figure 5 shows FT-IR spectra of the as-synthesized In2O3 nanoparticles. Four main intensive bands centered at 416, 539, 566 and 604 cm–1 were observed and characteristic for the cubic In2O3 phase. The chemisorbed H2O and CO2 molecules on the surface of In2O3 could be easily detected by recording the bands appeared in the range of 3400-3500 cm–1 and 1700-1600 cm–1 attributed to attributed to ν
OH and νc=0 respectively19. As shown from Figure 5 no signiicant changes were recorded in the IR-spectra of the investigated samples
as a result of γ-irradiation and surfactant addition.
3.1. PL analysis
Photoluminescence (PL) is the spontaneous emission of light from a material under optical excitation. The excitation energy and intensity are chosen to probe different regions and excitation concentrations in the sample. PL investigations can be used to characterize a variety of materials parameters
and provides electrical characterization. It is a relective
and extremely sensitive probe of discrete electronic states.
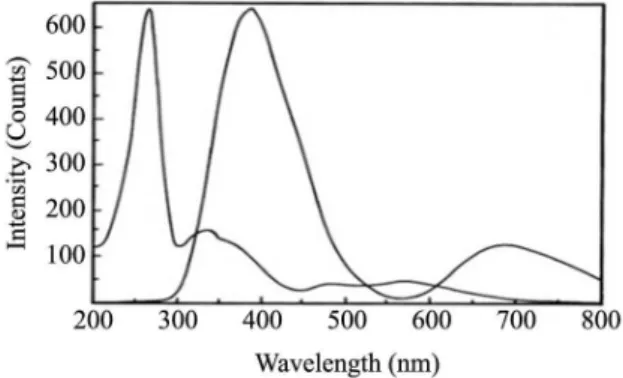
It is well known from literature that bulk In2O3 cannot emit light at room temperature. However, PL emissions of the nanocrystalline In2O3 samples are possible due to the effect of oxygen vacancies20 and recently to indium inertial and their associated complex defects21. Figure 6 shows the RT-PL spectra of the as-synthesized In2O3 nanoparticles. While exciting the sample with 266 nm, strong emission
at 383 nm and a weak emission at 650 nm were recorded.
In general, emission spectra can be divided into two broad Figure 2. XRD patterns of the as-synthesized In2O3 nanoparticles (a-d) samples. a) UN-irradiated AcAc; b) γ-irradiated AcAc (102 kGy); c) Un-irradiated AcAc and SDS; d) γ-irradiated AcAc (102 kGy) and SDS.
Table 2. Some of experimentally calculated parameters for the as-synthesized nanoparticles.
Precursor a, Å average diameter, nm 04-015-4061(reference)
Un-irradiated InAcAc (A) 10.086 50
10.114 Å
γ-irradiated InAcAc (B) 10.032 40
Un-irradiated InAcAc + SDS (C) 10.041 20
Figure 3. SEM micrographs of the as-synthesized In2O3 nanoparticles (a-d). a) Un-irradiated AcAc; b) γ-irradiated AcAc (102 kGy); c) Un-irradiated AcAc and SDS; d) γ-irradiated AcAc (102 kGy) and SDS.
Al-Resheedi et al.
936 Materials Research
categories, the near-band edge (NBE) emission and deep
level (DL) emission. The peak at 383 nm is due to near band
edge emission owing to excitionic transition. The PL peak
at 650 nm could be attributed to imperfections and defects due to oxygen vacancies. However, regarding the results of
FT-IR, the surface of nanoparticles is highly active as conined
by the presence of hydroxyl groups. In high active surface several types of defects are expected to give rise to oxygen vacancies and other point defects in the host lattice of cubic indium oxide. These oxygen vacancies induce the formation of new energy levels in the band gap which facilities the
electronic transitions between valence band and conduction band22. The as-obtained four samples of In
2O3 display the same PL spectra without any signiicant changes as a result
of γ-irradiation and surfactant free addition and only one
representative spectrum will be displayed.
Thermal stability of as-synthesized In2O3 nanoparticles
was tested by recording their TG/ TGA/ DTA curves in the
temperature range (25-400 °C) and the results are shown in Figure 7. The TG curve display thermal stability with minor weight loss (∼ 2%) in the temperature range of (50-350 °C).
The DTA curve shows multiple peaks maximized at 50,
180, 216, 281 and 311 °C. These thermal events are due to release of adsorbed water, organic and in-organic species from the active surface of the as-synthesized nanoparticles.
Broad exothermic peak was detected at 369 °C, probably
due the formation of non- stoichiometric composite In2O3[17].
3.2. Role of irradiation
In solid sample, the radiation effect is dominated by direct
ionization of the material, whereas for aqueous solutions
the reaction with radical species, such as OH• or solvated electrons is the dominant mechanism for damage to a solute.
Upon irradiation with Co-60 γ-ray source, the Compton scattering is the main mode of interaction of γ-ray with
indium and oxygen atoms and multiple ionization occurs. This event leads to the formation of electron-hole pairs, lattice imperfection and extended defects. From crystallographic
point of view, when unit cell is exposed to γ-irradiation, the atoms may be disturbed from the equilibrium positions.
Accordingly, the scattering action changes so that the structure factor becomes different and the lattice dimensions become smaller. Increasing of the dose absorbed by the precursor,
the radiation effect may be signiicantly remarkable and
contraction of the unit cell occurs. If the contraction is below a certain limit, broadening of the powder diffraction results. As a result of these effects, In2O3 nanoparticles
synthesized using γ-irradiated precursors are smaller in
size and displayed different morphology compared to the nanoparticles obtained from un-irradiated indium acetate. In the case (D), the trapped electrons in the host lattice of InAcAc may react with surfactant moiety to create another source of points and line defects in InAcAc due to the damage of SDS on the surface of the new phase formed by In2O3 nanoparticles as a result of γ-irradiation. This damage may increase the rate of nucleation of the nanoparticles to have another impact on morphologies and shapes of the as-synthesized nanoparticles.
It is worthy mentioned that the cell parameter, a of In2O3
calculated using γ-irradiated indium acetate (10.05 Å) by sol-gel method in our previous work was found to be higher than
the calculated value by solid state thermal decomposition of
indium acetylacetonate of the same adsorbed dose (10.03 Å).
This behavior could attribute to high concentration of the
trapped electrons and holes generated by γ-irradiation in the
solid state and leads to high degree of lattice imperfection, and extended defects13. Part of the trapped electrons in the case of sol-gel method reacts with benzyl alcohol and the gel leading to the formation of intermediate species of very short half -life.
Figure 5. FT-IR spectra of In2O3 nanoparticles (a-d). a) Un-irradiated AcAc; b) γ-irradiated AcAc (102 kGy); c) Un-irradiated AcAc and SDS; d) γ-irradiated AcAc (102 kGy) and SDS.
Figure 7. TG/DTG/DTA of as-synthesized In2O3 nanoparticles.
4. Conclusion
This study reports the synthesis of high purity porous In2O3 crystallites with different morphologies by thermal
decomposition of un-irradiated and γ-irradiated anhydrous
indium acetylacetonate (InAcAc) precursor in presence and absence of surfactant for 4 h at 600 °C. Thermal oxidation
of γ-irradiated indium acetylactonate precursor with
102 kGy in presence of sodium dodecyl sulphate leads to the formation of nanocrystalline of cubic In2O3 with porous structure and having average diameter in the range of 1-3 nm. The as-synthesized In2O3 nanoparticles show PL property
due to the presence of singly ionized oxygen vacancies. The as-synthesized In2O3 nanoparticles display thermal stability in the temperature range of (25- 400 °C). The porous nature of the as-synthesized In2O3 nanoparticles suggests the potential application of these particles as gas-sensing material.
Acknowledgements
This research project was supported by a grant from the
research center of the center for the female scientiic and medical colleges in King Saud University.
References
1. Murali A, Barve A, Leppert VJ, Risbud SH, Kennedy IM and Lee H. Synthesis and characterization of indium oxide nanoparticles. Nano Letters. 2001; 1(6):287-289. http://dx.doi.
org/10.1021/nl010013q.
2. Li C, Zhang D, Liu X, Han S, Tang T, Han J, et al. In2O3 nanowires as chemical sensors. Applied Physics Letters. 2003; 82(10):1613. http://dx.doi.org/10.1063/1.1559438.
3. Xu JQ, Wang XH, Wang GQ, Han J and Sun YA. Solvothermal
synthesis of In2O3 nanocrystal and its ethanol sensing mechanism.
Electrochemical and Solid-State Letters. 2006; 9(11):103-107.
http://dx.doi.org/10.1149/1.2335943.
4. Fuchs F and Bechstedt F. Indium-oxide polymorphs from first
principles: quasiparticle electronic states. Physical Review B: Condensed Matter and Materials Physics. 2008; 77(15):155107. http://dx.doi.org/10.1103/PhysRevB.77.155107.
5. Shen XP, Liu HJ, Fan X, Jiang Y, Hong JM and Xu Z. Construction
and photoluminescence of In2O3 nanotube array by CVD-template
method. Journal of Crystal Growth. 2005; 276(3-4):471-477. http://dx.doi.org/10.1016/j.jcrysgro.2004.11.394.
6. Du J, Yang M, Cha SN, Rhen D, Kang M and Kang DJ. Indium
Hydroxide and indium oxide nanospheres, nanoflowers, microcubes, and nanorods: synthesis and optical properties.
Crystal Growth & Design. 2008; 8(7):2312-2317. http://dx.doi. org/10.1021/cg701058v.
7. Zhu P, Wu W, Zhou J and Zhang W. Preparation of size-controlled In2O3 nanoparticles. Applied Organometallic Chemistry. 2007; 21(10):909-912. http://dx.doi.org/10.1002/aoc.1300.
8. Dodd A. Synthesis of indium oxide nanoparticles by solid state chemical reaction. Journal of Nanoparticle Research. 2009; 11(8):2171-2177. http://dx.doi.org/10.1007/s11051-009-9707-x.
9. Maensiri S, Laokul P, Klinkaewnarong J, Phokha S, Promarak
V and Seraphin S. Indium oxide nanoparticles using Aloe Vera plant extract : synthesis and optical properties. Optoelectronic
and Advanced Materials - Rapid Communication. 2008;
Al-Resheedi et al.
938 Materials Research
10. Gerasimov GY. Radiation methods in nanotechnology. Journal of Engineering Physics and Thermophysics. 2011; 84(4):947-963. http://dx.doi.org/10.1007/s10891-011-0554-0.
11. Chmielewski AB, editor. Emerging applications of radiation in nanotechnology. Vienna: IAEA; 2005. IAEA Tecdoc Series, 1438.
12. Chmielewski AB, Chmielewska DK, Michalik J and Sampa MH.
Prospects and challenges in application of gamma, electron and ion beams in processing of nanomaterials. Nuclear Instruments and Methods in Physics Research. 2007; B265(1):339-346. http://dx.doi.org/10.1016/j.nimb.2007.08.069.
13. Mahfouz RM, Al-Ahmari S, Al-Fawaz A, Al-Othman Z, Warad
IK and Siddiqui MRH. Kinetic analysis for non-isothermal decomposition of unirradiated and γ-irradiated indium acetyl
acetonate. Materials Research. 2011; 14(1):7-10. http://dx.doi. org/10.1590/S1516-14392011005000009.
14. Al-Resheedi A, Alhokbany NS and Mahfouz RM. Radiation
induced synthesis of In2O3 nanoparticles. Part 1: synthesis of In2O3 nanoparticles by sol-gel method using un-irradiated and
γ-irradiated indium acetate.. Materials Research. 2014; 17(2):364-351. http://dx.doi.org/10.1590/S1516-14392014005000019.
15. Spinks JWT and Woods RJ. An introduction to radiation chemistry. 3rd ed. New York: John Wiley & Sons; 1990.
16. Joint Committee on Powder Diffraction Standards - JCPDS.
File 6-416. Swarthmore: International Center for Data; 1992.
17. West AR. Basic solid state chemistry. 2nd ed. New York: John Wiely & Sons; 1999. Translated to Arabic by Mahfouz RM and
Al-Farhan KhA.
18. Gontard LC, Ozkaya D and Dunin-Borkowski RE. A simple
algorithm for measuring particle size distributions on an
uneven background from TEM images. Ultramicroscopy. 2011; 111(2):101-106. http://dx.doi.org/10.1016/j.ultramic.2010.10.011. PMid:21185453.
19. Nyquist RA and Kagel RO. Infrared spectra of inorganic compounds. New York: Academic Press; 1971. 208 p. http:// dx.doi.org/10.1016/B978-0-12-523450-4.50005-5.
20. Gfroerer TH. Photoluminescence in analysis of surfaces and interfaces. Chichester: Wiley & Sons; 2000. 9209 p.
21. Beena D, Lethy KJ, Vinodkumar R, Detty AP, Mahadevanpillai
VP and Ganesan V. Photoluminescence in laser ablated nanostructured indium oxide thin films. Optoelectronics and
Advanced Materials - Rapid Communications. 2011; 5(1):1-11.
22. Zheng MJ, Zhang LD, Li GH, Zhang XY and Wang XF. Ordered