1. Introduction
The Statistical Process Control (SPC) have been used in industrial processes since the 1920s, with an increase during the Second World War. The emergence of Six Sigma Program intensified the use because of the incorporation of the systematic use of the SPC in its methodology (Montgomery, 2014).
Although the use is relatively easy, studies describe steps for implementation and examples of SPC in specific processes (Hradesky, 1989; Kumar & Motwani, 1996; Antony & Taner, 2003). However, there is no information whether the results obtained in the process control were continued and the control chart was adopted as a working process.
The application of SPC demands organizational and behavioral changes and it is important the dialogue and integration between management and operators aiming exchange of information and learning for the successful use of control charts. It indicates the need for consideration of factors that transcend the technical aspects of implementation (Grigg & Walls, 2007a).
In the North American chemical industry in the 1980s, there was a renewed interest in the use of the SPC. The SPC was mainly used to replace the inspection of the quality of the final product, in order to reduce the variability of the product, generating increased productivity, reduce energy consumption and stock levels (Chowdhury, 1986).
There are difficulties in the use of SPC in continuous processes involving liquids and gases, common in chemical industries (Gallagher, 1990), although the SPC provide an effective means for this monitoring (Haslego, 2000). Process control engineers can use control charts to monitor the stability, capacity and process performance and at the same time, those responsible for quality may follow if the process is following the quality standards (Haslego, 2000).
Success factors in the implementation of statistical
process control: action research in a chemical plant
Jose Carlos de Toledoa*, Fabiane Letícia Lizarellia, Manoel Bispo Santana Juniora
aUniversidade Federal de São Carlos, São Carlos, SP, Brasil
Abstract
Despite the Statistical Process Control (SPC) be extensively explored in the literature, there are still difficulties in the implementation and maintenance, usually due to lack of attention to Critical Success Factors (CSF). This paper identified by literature review, critical factors that contribute to the success of the SPC and through an action research was implemented a control chart in a chemical plant using these factors. The attention to CSF during planning, implementation and the discussion with the process team resulted in the implementation and acceptance of control charts by the operational teams of the company, with continuing indications of use. The results enabled a framework to apply control charts based on CSF. Keywords
Control charts. Critical success factors. Implementation. Statistical process control.
How to cite this article: Toledo, J. C., Lizarelli, F. L., & Santana Junior, M. B. (2017). Success factors in the implementation
In publications on the subject, it is possible to observe the value of the SPC in different production processes and that there are several factors identified as important to the success of its implementation (Rohani et al., 2010). This paper aims, through action research in a chemical plant, implement SPC charts applying critical success factors and discussing the relevance for continuous use.
2. Success factors in the implementation of the SPC
The factors that affect the implementation of the SPC are complex and numerous (Rohani et al., 2010) and can be called Critical Success Factors (CSF). If there is a better control over these factors, the chance of success in the implementation of SPC is higher (Gordon et al., 1994; Elg et al., 2008; Rohani et al., 2010).
The implementation of the SPC involves technical factors and organizational factors, both are considered critical for successful implementation (Does et al., 1997; Elg et al., 2008). Xie & Goh (1999) emphasize an holistic approach to the implementation of SPC, based on three basis: the first, related to the SPC Management, which involves issues such as the role of senior management, focus on Continuous Improvement, training and teamwork; the second, related to the human factor, which presents resistance to change issues, difficulties with the use of computer technologies and the need for incentives; the third, focuses on the implementation of the SPC, including the use of appropriate tools for monitoring the process.
Although SPC is superficially a simple technique, the application is a more complex issue (Antony et al., 2000). The main reasons for failures in implementing are related to: organizational and social factors (Does et al., 1997); lack of senior management commitment (Antony et al., 2000); lack of training and understanding of SPC (Does et al., 1997; Antony et al., 2000); decreased attention after the introduction (Does et al., 1997) and the lack of understanding of the potential benefits of the SPC (Mason & Antony, 2000).
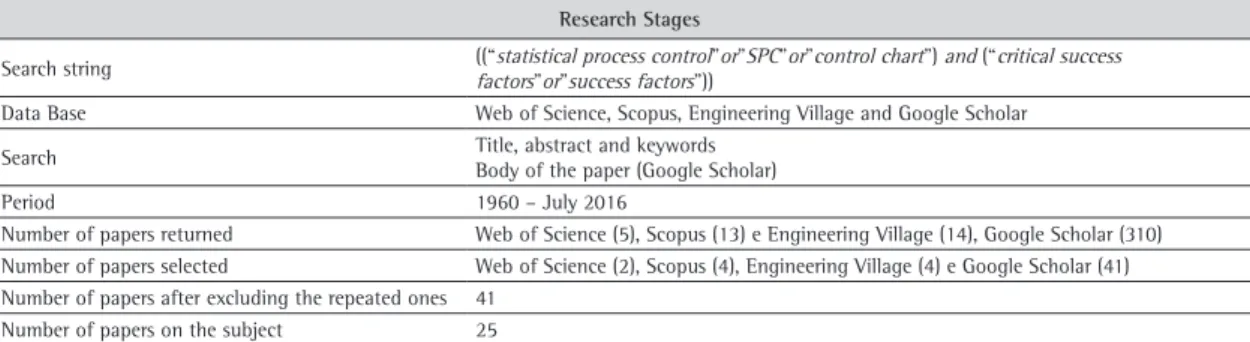
SPC implementation does not only refer to the sequence of actions to build the control charts and interpret the process is under control. The implementation is also related to social, environmental, technical and cultural factors that will make sure that the use of these charts is integrated into the routine process. For the analysis of critical success factors for SPC, a Systematic Literature Review (SLR) was held to identify the publications that address these factors (Table 1).
Considering the low number of returns in Web of Science, Scopus and Engineering Village, the same search was made in Google Scholar, but the search terms were found throughout the body of the paper, returning 310 publications. Results related to patents were excluded, leaving 298 publications, of which the titles and abstracts were read, 41 were selected, including those found in Web of Science, Scopus and Engineering Village. After a complete reading of the 41 papers, it was identified that 25 contributed to the subject.
A compilation and analysis of CSF present in these publications has been made, considering that different authors refer to the same content with different names and some factors are contained in others. After the compilation, 19 CSF were found with more than one citation.
The three most cited factors are related to SPC management, the first one is the “Commitment and senior management responsibility” (Gordon et al., 1994; Does et al., 1997; Rungtusanatham et al., 1999; Xie
& Goh, 1999; Antony et al., 2000; Rungasamy et al., 2002; Antony & Taner, 2003; Grigg & Walls, 2007b; Chen et al., 2008; Elg et al., 2008; Phyanthamilkumaran & Fernando, 2008; Putri & Yusof, 2008, 2009; Rohani et al., 2009a, b; 2010; Mahanti & Evans, 2012; Lim & Antony, 2013; 2014; Rantamäki et al., 2013; Lim et al., 2014; 2016; Sharma & Kharub, 2014), which is related to support the implementation with financial, human resources and training and is related to the second factor, “Education and training in SPC”, the training
Table 1. Stages of the systematic literature review.
Research Stages
Search string ((“statistical process control”or”SPC”or”control chart”) and (“critical success factors”or”success factors”))
Data Base Web of Science, Scopus, Engineering Village and Google Scholar
Search Title, abstract and keywords Body of the paper (Google Scholar)
Period 1960 – July 2016
Number of papers returned Web of Science (5), Scopus (13) e Engineering Village (14), Google Scholar (310) Number of papers selected Web of Science (2), Scopus (4), Engineering Village (4) e Google Scholar (41) Number of papers after excluding the repeated ones 41
in concepts and techniques needs resources and senior management support, and it was appointed as CSF by the same number of authors in the literature (Gordon et al., 1994; Rungtusanatham et al., 1999; Xie & Goh, 1999; Antony et al., 2000; Mason & Antony, 2000; Rungasamy et al., 2002; Antony & Taner, 2003; Grigg & Walls, 2007b; Chen et al., 2008; Elg et al., 2008; Phyanthamilkumaran & Fernando, 2008; Putri & Yusof, 2008; 2009; Rohani et al., 2009a, b; 2010; Mahanti & Evans, 2012; Lim & Antony, 2013; 2014; Rantamäki et al., 2013; Lim et al., 2014; 2016; Sharma & Kharub, 2014). The third CSF is “Team work”, for SPC implementation is important to have a specific working group with leaders, a board of directors committee and an operational team to lead, coordinate and carry out the implementation (Does et al., 1997; Rungtusanatham et al., 1999;
Xie & Goh, 1999; Mason & Antony, 2000; Antony et al., 2000; Rungasamy et al., 2002; Chen et al., 2008;
Elg et al., 2008; Phyanthamilkumaran & Fernando, 2008; Putri & Yusof, 2008; 2009; Rohani et al., 2009a, b; 2010; Mahanti & Evans, 2012; Lim & Antony, 2013; Rantamäki et al., 2013).
The fourth and fifth CSF are related to technical aspects of the SPC implementation; “Identification and measurement of critical product characteristics”, which involves identification and measurement of characteristics that impact the client and generate significant quality problems (Does et al., 1997; Rungtusanatham et al., 1999; Mason & Antony, 2000; Antony et al., 2000; Rungasamy et al., 2002; Antony & Taner, 2003; Grigg & Walls, 2007b; Chen et al., 2008; Elg et al., 2008; Rohani et al., 2009a, b; 2010; Mahanti & Evans, 2012; Lim
& Antony, 2013; Rantamäki et al., 2013; Sharma & Kharub, 2014); and “Definition and correct application
of control charts” (selection of appropriate control chart, sampling, etc), this factor points out that should be proper selection of the chart, which depends on the type of variable to be analyzed, the data to be collected and the process (Does et al., 1997; Rungtusanatham et al., 1999; Mason & Antony, 2000; Antony et al., 2000; Rungasamy et al., 2002; Antony & Taner, 2003; Grigg & Walls, 2007b; Chen et al., 2008; Elg et al., 2008; Phyanthamilkumaran & Fernando, 2008; Putri & Yusof, 2008; Rohani et al., 2009a; 2010; Mahanti & Evans, 2012; Lim & Antony, 2013).
The sixth CSF is “Cultural change and communication”, this factor considers that behavioral and resistance to change issues must be considered; operators, engineers and managers need to be aware of the benefits of the SPC for the continuous improvement of products and processes and to base its actions on facts and data (Xie & Goh, 1999; Antony et al., 2000; Rungasamy et al., 2002; Chen et al., 2008; Elg et al., 2008; Phyanthamilkumaran
& Fernando, 2008; Putri & Yusof, 2008; 2009; Rohani et al., 2009a, b; 2010; Mahanti & Evans, 2012; Lim & Antony, 2013; 2014; Lim et al., 2014; Sharma & Kharub, 2014).
The seventh and eighth factors are also technical: “Measurement system analysis in relation to its capability and applicability” (process of measuring the quality characteristics must be analyzed considering the effect of the inspector, the measuring instrument and the interactions between these factors) (Does et al., 1997; Rungtusanatham et al., 1999; Antony et al., 2000; Rungasamy et al., 2002; Antony &Taner, 2003; Grigg & Walls, 2007a, b; Chen et al., 2008; Rohani et al., 2009b; 2010; Mahanti & Evans, 2012; Lim & Antony, 2013; Rantamäki et al., 2013; Lim et al., 2016) and “Process definition and prioritization, focusing on waste, rework or variability problems” (Does et al., 1997; Xie & Goh, 1999; Antony et al., 2000; Rungasamy et al., 2002; Chen et al., 2008; Elg et al., 2008; Rohani et al., 2009a, b; 2010; Mahanti & Evans, 2012; Lim & Antony, 2013).
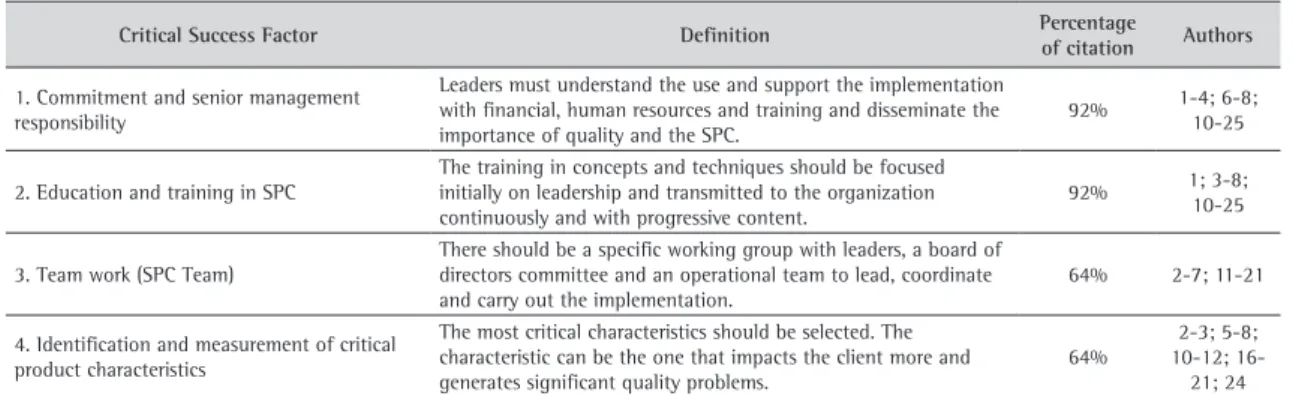
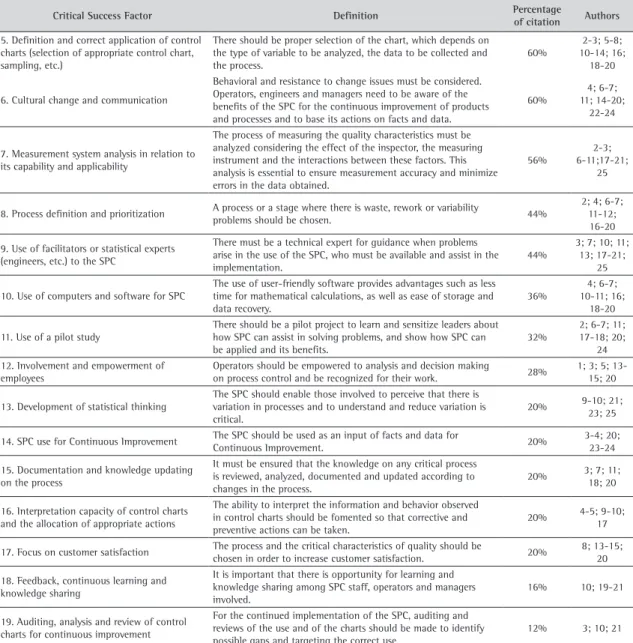
These and the others factors and the corresponding authors are listed in Table 2, following the highest to lowest number of citations, it is also presented a brief definition of these factors and the percentage of authors who cite.
Table 2. Compilation of the CSF found in SLR.
Critical Success Factor Definition Percentage
of citation Authors
1. Commitment and senior management responsibility
Leaders must understand the use and support the implementation with financial, human resources and training and disseminate the importance of quality and the SPC.
92% 1-4; 6-8; 10-25
2. Education and training in SPC
The training in concepts and techniques should be focused initially on leadership and transmitted to the organization continuously and with progressive content.
92% 1; 3-8; 10-25
3. Team work (SPC Team)
There should be a specific working group with leaders, a board of directors committee and an operational team to lead, coordinate and carry out the implementation.
64% 2-7; 11-21
4. Identification and measurement of critical product characteristics
The most critical characteristics should be selected. The characteristic can be the one that impacts the client more and generates significant quality problems.
64%
2-3; 5-8; 10-12; 16-21; 24
Critical Success Factor Definition Percentage
of citation Authors
5. Definition and correct application of control charts (selection of appropriate control chart, sampling, etc.)
There should be proper selection of the chart, which depends on the type of variable to be analyzed, the data to be collected and the process.
60%
2-3; 5-8; 10-14; 16; 18-20
6. Cultural change and communication
Behavioral and resistance to change issues must be considered. Operators, engineers and managers need to be aware of the benefits of the SPC for the continuous improvement of products and processes and to base its actions on facts and data.
60%
4; 6-7; 11; 14-20;
22-24
7. Measurement system analysis in relation to its capability and applicability
The process of measuring the quality characteristics must be analyzed considering the effect of the inspector, the measuring instrument and the interactions between these factors. This analysis is essential to ensure measurement accuracy and minimize errors in the data obtained.
56%
2-3; 6-11;17-21;
25
8. Process definition and prioritization A process or a stage where there is waste, rework or variability
problems should be chosen. 44%
2; 4; 6-7; 11-12; 16-20
9. Use of facilitators or statistical experts (engineers, etc.) to the SPC
There must be a technical expert for guidance when problems arise in the use of the SPC, who must be available and assist in the implementation.
44%
3; 7; 10; 11; 13; 17-21;
25
10. Use of computers and software for SPC
The use of user-friendly software provides advantages such as less time for mathematical calculations, as well as ease of storage and data recovery.
36%
4; 6-7; 10-11; 16;
18-20
11. Use of a pilot study
There should be a pilot project to learn and sensitize leaders about how SPC can assist in solving problems, and show how SPC can be applied and its benefits.
32%
2; 6-7; 11; 17-18; 20;
24 12. Involvement and empowerment of
employees
Operators should be empowered to analysis and decision making
on process control and be recognized for their work. 28%
1; 3; 5; 13-15; 20
13. Development of statistical thinking
The SPC should enable those involved to perceive that there is variation in processes and to understand and reduce variation is critical.
20% 9-10; 21; 23; 25
14. SPC use for Continuous Improvement The SPC should be used as an input of facts and data for
Continuous Improvement. 20%
3-4; 20; 23-24
15. Documentation and knowledge updating on the process
It must be ensured that the knowledge on any critical process is reviewed, analyzed, documented and updated according to changes in the process.
20% 3; 7; 11; 18; 20
16. Interpretation capacity of control charts and the allocation of appropriate actions
The ability to interpret the information and behavior observed in control charts should be fomented so that corrective and preventive actions can be taken.
20% 4-5; 9-10; 17
17. Focus on customer satisfaction The process and the critical characteristics of quality should be
chosen in order to increase customer satisfaction. 20%
8; 13-15; 20
18. Feedback, continuous learning and knowledge sharing
It is important that there is opportunity for learning and knowledge sharing among SPC staff, operators and managers involved.
16% 10; 19-21
19. Auditing, analysis and review of control charts for continuous improvement
For the continued implementation of the SPC, auditing and reviews of the use and of the charts should be made to identify possible gaps and targeting the correct use.
12% 3; 10; 21
(1) Gordon et al. (1994); (2) Does et al. (1997); (3) Rungtusanatham et al. (1999); (4) Xie & Goh (1999); (5) Mason & Antony (2000); (6) Antony et al. (2000); (7) Rungasamy et al. (2002); (8) Antony &Taner (2003); (9) Grigg & Walls (2007a); (10) Grigg & Walls (2007b); (11) Chen et al. (2008); (12) Elg et al. (2008); (13) Phyanthamilkumaran & Fernando (2008); (14) Putri & Yusof (2008); (15) Putri & Yusof (2009); (16) Rohani et al. (2009a); (17) Rohani et al. (2009b); (18) Rohani et al. (2010); (19) Mahanti & Evans (2012); (20) Lim & Antony (2013); (21) Rantamäki et al. (2013); (22) Lim & Antony (2014); (23) Lim et al. (2014); (24) Sharma & Kharub (2014); (25) Lim et al. (2016)
There is a convergent opinion on the importance of these CSF for the implementation of SPC, both in academy as in managers (Rohani et al., 2010). This list of factors summarizes the arguments of authors and will be the reference adopted in research reported in this paper.
Some authors propose methodologies for SPC Implementation. Krumwiede & Sheu (1996) present six steps for implementation: getting support from senior management, choosing a leader of the SPC, determination of the production process for the pilot study, process documentation preparation, training in SPC and the construction of control charts.
Kumar & Motwani (1996) suggest 16 steps to lead to the implementation, ranging from staff training for deployment to actions for process control. Does et al. (1997) present a model with four phases, involving awareness, pilot projects, full implementation and total quality. Mason & Antony (2000) and Antony & Taner (2003) propose a conceptual model for the implementation of the SPC, developed from the critical analysis of publications on the subject, which focuses on four key areas: management issues, engineering skills, statistical
knowledge and skills for group work. In general, these models for SPC implementation include some of the CSF mentioned.
The problems faced in implementation are also related to CSF: it needs to invest time, money and training in the implementation of the SPC (Does et al., 1997); it needs constant attention and Senior Management support (Antony & Taner, 2003; Does et al., 1997); it is important the effective use and correct interpretation of control charts; it must overcome the difficulties in the use of statistics to build the chart, understanding and identification of corrective actions; it is important to plan for the implementation of the SPC and the management after implementation (Antony & Taner, 2003). The identification of CSF for the implementation of the SPC is crucial, but only the consideration of factors is not enough, they must be connected in a coherent plan (Lim & Antony, 2014).
3. Research method
The method used for field research was the emancipatory action research, considering the company’s interest in conducting a learning experience and participation of operational staff and technical support in the implementation and consolidation of the SPC in a chemical processing unit. The method determines the researcher to share responsibilities with the other participants and enables organizational learning.
The company had already conducted an implementation of SPC in the past, which was not successful and decided to hold a new experience observing the CSF. This represented an opportunity to conduct a research on the implementation and verify in loco the theory of CSF for SPC.
Action research is a cyclical process with well-defined phases to plan the intervention, collect, analyze data, plan and perform the intervention. After the implementation of the actions there is the evaluation and returns to the beginning of the cycle with the planning. The research stages (Figure 1) were based on Coughlan & Coghlan (2002).
The Pre-Planning Step aimed the understanding of the research context and definition of purpose. It included the survey of the theoretical framework for the action research, the CSF, the understanding of the company’s history with the use of control charts and its organizational environment, the choice of the process to the action research application and identification of expectations of the involved team.
The data collection phase aimed to carry out visits and meetings with the action research team and observe the existence of the CSF in the unit. In the feedback stage, the objective was to discuss with the team the information and data collected. The data analysis enabled the interpretation of the collected data, assisted in the prioritization of selected actions for the next step, the action plan, in which the actions, deadline and responsible for the effective implementation of the SPC were defined. The fifth step was the implementation of actions and identification of the generated results, followed by the action evaluation step, which involves discussion of the effectiveness of actions implemented and whether they have met the expectations. At each step was performed a continuous monitoring, communicating to staff through formal presentations of the research, the actions performed and their evaluation.
It was conducted three cycles of all the six steps and the action research monitoring.
4. Action research
4.1. Pre-planning step
In pre-planning step, the researcher held meetings with the Production Manager, the Production Coordinator, who is responsible for the operational teams and the Process Manager, who is responsible for technical improvements in the plant.
Initially, it was explained to the researcher who in the past have already tried to adopt SPC charts, but unsuccessful in its continuity. Many operators at the time of these initiatives are still part of the current team and could generate resistance.
It has formed a monitoring group to support action research, with the participation of the researcher, Production Manager, Process Manager and Industrial Manager.
At this stage the expectations were identified: to understand the failures of past initiatives; involve all the plant workers; generate clear procedure for operational use of control charts and embed it to the ISO 9000 Quality System (International Organization for Standardization, 2015); the variables to be monitored should be important to the operation result (customer satisfaction) and the utilization of the software for using the chart should be easy.
The purpose of action research, set with the Monitoring Group, was the implementation of control charts with the use of the CSF and the assessment of their effective incorporation into the operators’ work routine. The aims of the action research and team expectations were released for the entire organization.
The Monitoring Group decided that the research was a pilot project focused on a specific process. Silica production was chosen by the potential improvements generated by the control. Only after the results of the research, with the actions implemented, it would start institutionalization of the SPC.
4.2. First cycle of action research
This cycle was performed in order to identify the expectations and barriers by operators and production leaders in relation to the charts and start the implementation.
4.2.1. Data collection and feedback
Data collection involved individual interviews with some members of the operating team and three formal meetings with shift leaders and operators separately. The purpose of separating the leadership was not inhibit operators in relation to providing information on past experiences in the use of control charts and on their expectations and difficulties. It sought to identify and understand, from the perspective of operators, the possible restraints, as in the opinion of the leaders, operators have the perception that the use of control charts is reserved for engineers and managers. The leaders warned that in previous experiments the operators had no control over the chosen variable, therefore, the choice of the process and the variable has been identified as important to success.
It was detected the concern of operators with the amount of data to be read, if the control chart would be done by hand (paper) or through some software, how often they should monitor the variable and the responsibility of operators to the variable behavior. It was perceived that the working procedure, in the case of the presence of special cause indication, was considered by operators as a critical factor.
In one of the meetings between researchers and operators, there was a brief presentation of the concepts of SPC and the opportunity was used to detect the interest of operators on training in SPC. It also was discussed the interest of teamwork for implementation of control charts and the use of facilitators. The proposals were accepted without restrictions by operators and are very important for the implementation.
Another important aspect was to report to operators and leaders that this project would be considered as a pilot, the results would be analyzed for replication in other plants and processes.
The data obtained after the meetings were organized in a document submitted to the Monitoring Group. This information was also communicated to other stakeholders, such as Production Managers from other plants.
4.2.2. Data analysis, action plans and execution
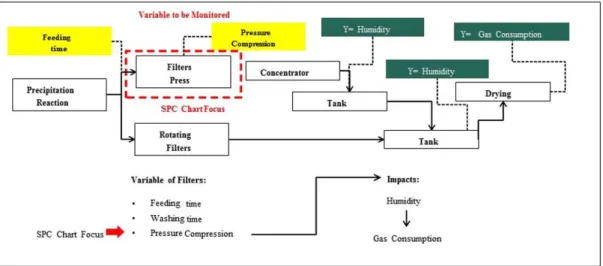
The chosen critical quality characteristic was a variable with direct impact on the natural gas consumption of the factory. In the silica process, there is a step where the suspension is filtered through a filter-press and then pass through a gas dryer. The humidity of the silica at the end of the filtration is important, as it impacts on gas consumption in the dryer and correlates with the pressure applied to the filter plates. It was defined as variable to be controlled, the pressure applied to the filtration plates. The control chart would have as an objective to monitor the filtration process to ensure low humidity level and lower gas consumption for drying. Figure 2 illustrates the focus process for the implementation of the control chart.
The motivation to have a statistically controlled variable is that, despite being a stable operation, if there are problems in the pressurization system of the plates, hardly, the operators will immediately detect because the pressure will gradually reduce until it is perceived that the humidity of the silica in the dryer entry is high.
4.2.3. Evaluation and monitoring after the first cycle of action research
The facilitator’s role proved to be essential to the connection between the Monitoring Group and the SPC team and to answer questions of the operators. There was a need for a clear definition of its functions, so that there was no conflict with other leaders. It was also noted the strong influence of the company culture
Table 3. Situation analysis and proposed actions.
CSF Situation Action
Commitment and senior management responsibility
The members of the Monitoring Group are supporting and there is no identified focus of resistance. In meetings with the leaders, it was revealed that those who experienced the frustrated initiatives, support the initiative, but with restrained enthusiasm.
The Group continues to demonstrate the support through meetings and interventions in the pilot project and it is awaiting the advance of the other phases of the implementation to verify the need for action with the leaders. Appointment of a facilitator, providing resources for the progress of actions.
Use of pilot project
Consider the experience as a pilot project has been worked in the planning and discussed in meetings with operators and leaders. Thus, expectations that were another top-down program, imposed on operators, did not materialize. The teams understand that this is a pilot for “a new way of working an old idea”.
The implementation of actions continued to be treated as a pilot.
Held the formal action release (kick-off) and pilot officialization, with all operational staff, the launch was well received by operators.
SPC implementation team
During the meetings, it was found strained relations between operators and leaders.
Apparently, there is a concentration of power in leaders who monopolize the decisions that are taken in the process control room. Some operators have complained that lack the autonomy to make changes in the process, knowing what has to be done. This situation could interfere when the establishment of plans for special causes, which should be done by control room operators.
A production engineer with training in Six Sigma Green Belt was hired, who will be responsible for leading, which would decrease the concentration of power.
The SPC team was defined as consisting of operators, leaders, process supervisor and Production Engineer.
Use of facilitator
The need to use a facilitator to assist in the execution of the project and on questions of implementation of the control chart has been verified.
At first, it was chosen as facilitator a supervisor with good knowledge of the industrial process, working routines and which is responsible for the factory quality system. However, the facilitator did not have enough knowledge on statistical methods. The facilitator appointed was the Production Engineer. Definition
and prioritization of the process
It was important to have been made in the planning stage, indicating the plant and process for the pilot implementation.
After discussion, the silica filtration process was set.
Identification and measurement of critical quality characteristics
Several meetings were needed to which variable consensus would bring value to the operation. It is important to choose a variable that operators can take action if the process gets out of control. It is also important that everyone training for taking corrective actions, as currently the action under the process depends on the experience of the operator.
For the choice of the variable, the Monitoring Group realized that important factors are: to be an independent variable, have strong impact with the process output, its correction is the domain of operators and have validated measurement.
After meetings with the process teams defined that filtration section, the controlled variable would be the final compression pressure applied on silica plates. This variable was unanimously accepted by the team. Education and training
in SPC Request by the operators, training in SPC concepts.
Training sessions in early concepts of SPC types of charts, importance and benefits of the implementation.
Cultural change management
Operators understand the concept of the project. Communication with all the employees was essential to realize that something different was being done to an “old issue.” However, there is an expectation for knowing how is done in practice.
and the plant’s own staff in the actions. The engagement of leaders proved essential in the first cycle, as there was between them the belief that research would bring benefits to all. In this first cycle it was observed the expectation created by the operators about what would happen in the coming months.
For the Monitoring Group, the first cycle of action research implantation helped strengthen the existing theoretical framework in the group, increasing the knowledge to the next steps.
4.3. Second cycle of action research
4.3.1. Data collection and feedback
For the pilot project, other implementation steps have been introduced by SPC team, for example, the measuring system validation. The team identified two aspects, one technical and other behavioral. As regards the technical side, the measurements must be validated statistically by means of a study of repeatability and reproducibility, compared to the inherent variability of the measurement in relation to process variability or tolerance (upper and lower specification limits) to be achieved by facilitator. The behavioral aspect concerns the perception of the reliability of measurements by operators. It is not enough to show through calculations and documents that the measuring system is suitable if, on a daily routine operators do not trust the measurement. To identify behavioral problems, it was asked if any measurement or measuring system was not trusted and had suggestions for improvement.
The next step was the definition and correct application of the control chart. It was decided along with the SPC team, from the simplest type, with the mean chart for the filtration cycle pressure control, which lasts 60 minutes. In two meetings with the process and production engineers, a proposal to monitor and plot the mean compression pressure in the last three minutes of the filtration cycle came up, because the most important to the process is the final pressure applied to silica plates. The need to conduct an analysis of autocorrelation has been raised, since according to Montgomery (2014) the most important premise for control charts is the independence of the observations.
Another problem associated with CSF was the software for the control chart. In interviews with operators, all of them dismissed to manually do the control chart. Data collection and calculations would be laborious. During group meetings operators suggested a spreadsheet in Excel® to be used, the lack of control indication rules were shown in the worksheet and, if possible, be alerted when the next phase could get out of control. Discussions were made with the computer technicians of the company to verify that there were options to meet these requirements.
In this phase were applied and analyzed the following CSF: “Measurement system analysis in relation to their capability and applicability”; “Definition and correct application of control charts” and “Use of computers and
software for SPC.” Two other factors continued to be used throughout the implementation project: “Education and training in SPC” and “Management of Cultural Change.”
It was presented to the Monitoring Group that for the factor “Measurement system analysis in relation to their capability and applicability” were necessary studies on the measurement system and the confidence improvement of operators in the data.
An oral presentation to the Monitoring Group on the factors “Definition and correct application of control charts” was made and “Use of computers and software for SPC,” discussing the suggestion of spreadsheet using Excel. On-site visits were also carried out to check where the monitor could be allocated, so the operators could accompany the control chart.
4.3.2. Data analysis, action plans and execution
Table 4 shows the results of the analysis and actions for CSF in the second cycle of Action Research.
4.3.3. Evaluation and monitoring after the second cycle
The action concerning the “Use of computers and software for SPC” was successful and started to impact on the behavior of operators. The control chart in Excel began to be viewed in the control room for all operators. All of them were aware of the pilot that was being done and has contributed, showing problems that occurred in the factory when the points came out of the control limits (± 3σ), although it is not yet mandatory to use the control chart and record the occurrences.
4.4. Third cycle of action research
4.4.1. Data collection and feedback
It was identified that the operating procedures of the filtering process did not include corrective actions in the case of a point outside the control limits. Therefore, it would be necessary to update the procedure. Some corrective actions can be done from within the control room, such as check other variables as flow and level. Other actions need the checking of the equipment for visual inspection and local action, these actions needed to be inserted in the instructions. Another finding was that operators no longer wanted to be trained in the concepts, but in the new procedures related to the chart, both in identifying special causes and the procedures for eliminating the causes.
Table 4. Data analysis and actions to the CSF of the second cycle.
CSF Situation Action
Measurement System Analysis
It has been observed the need for technical evaluation (analysis of repeatability and reproducibility) of the measurement and behavioral analysis related operators’ confidence in the data collected.
The repeatability and reproducibility study showed that the measurement system is reliable. It sought to show that the team itself is responsible for the measured data and its reliability, improving awareness.
Definition and correct application of control charts
The simplest type of chart, the X bar – R chart, is suggested. The average of the variable pressure applied to the end plates of silica in the last 3 minutes filtration cycle should be monitored for X bar and the dispersion inside the sample for R chart.
Need to perform autocorrelation analysis.
Creation by the facilitator (Production Engineer), availability for operators of the control chart and the verification that the chart is being used and the data is being properly collected. Operators began to include naturally in their routine the chart consultation. There was no identification of autocorrelation.
Use of computers and software for SPC
This factor is crucial for operators to “buy the idea” and change the culture related to the SPC. It should be used software for easy access and understanding. There must be a unique monitor to display the chart.
Carried out the installation of a unique new computer to the control chart. The chart was built in Excel and is updated every 60 minutes, with constant consultation of the chart on the specific monitor.
Education and training in SPC
It was identified the need for training in relation to analysis of the measurement system on the types of control charts and interpretation.
There was concise and simple training on the analysis of the measurement system.
SPC team was trained on the most widely used type of control chart: (X bar – R)
Cultural Change Management
Operators and leaders are more involved in the implementation of the control chart, but there are still barriers in relation to the tool to build the chart (they do not want to be manual) and data reliability.
It was proposed by the SPC team that morning meetings could help in monitoring and eliminating special causes identified by the control chart. It would be a formal meeting between the production team, process and maintenance engineers to check the previous day’s performance, analyzing some indicators and possible special causes.
In meetings with members of the process, it was questioned the need to review the control charts and change in control limits in the case of process changes.
In this action research cycle the following critical success factors for implementation of SPC charts were investigated, “Interpretation capacity of control charts and execution of appropriate actions in case of being out of control”; “Documentation and knowledge updating about the process,” which involves updating the operating procedures in the case of the process have special causes; “Auditing, analysis and review of control charts with a view to Continuous Improvement” and the review of control limits when the process changes.
The findings of the third cycle of research were exposed and discussed by the facilitator to the Monitoring Group.
4.4.2. Data analysis and action plan
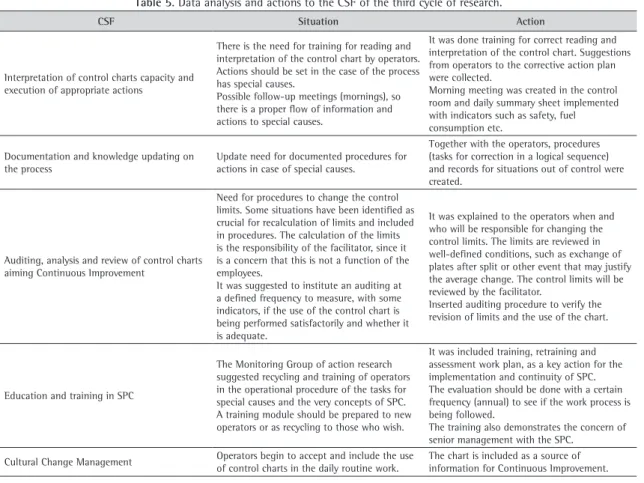
Table 5 shows the results of the analysis and actions to the CSF of the third cycle of research.
4.4.3. Evaluation and monitoring after third cycle
Finishing the third cycle operators included, naturally, the control chart in their work. The chart, in addition to help correct process deviations, also assisted in the identification of the moment of exchange of the filter plates. Over the course of time they will degrade and leak, no longer being able to achieve the necessary compression pressure.
Table 5. Data analysis and actions to the CSF of the third cycle of research.
CSF Situation Action
Interpretation of control charts capacity and execution of appropriate actions
There is the need for training for reading and interpretation of the control chart by operators. Actions should be set in the case of the process has special causes.
Possible follow-up meetings (mornings), so there is a proper flow of information and actions to special causes.
It was done training for correct reading and interpretation of the control chart. Suggestions from operators to the corrective action plan were collected.
Morning meeting was created in the control room and daily summary sheet implemented with indicators such as safety, fuel consumption etc.
Documentation and knowledge updating on the process
Update need for documented procedures for actions in case of special causes.
Together with the operators, procedures (tasks for correction in a logical sequence) and records for situations out of control were created.
Auditing, analysis and review of control charts aiming Continuous Improvement
Need for procedures to change the control limits. Some situations have been identified as crucial for recalculation of limits and included in procedures. The calculation of the limits is the responsibility of the facilitator, since it is a concern that this is not a function of the employees.
It was suggested to institute an auditing at a defined frequency to measure, with some indicators, if the use of the control chart is being performed satisfactorily and whether it is adequate.
It was explained to the operators when and who will be responsible for changing the control limits. The limits are reviewed in well-defined conditions, such as exchange of plates after split or other event that may justify the average change. The control limits will be reviewed by the facilitator.
Inserted auditing procedure to verify the revision of limits and the use of the chart.
Education and training in SPC
The Monitoring Group of action research suggested recycling and training of operators in the operational procedure of the tasks for special causes and the very concepts of SPC. A training module should be prepared to new operators or as recycling to those who wish.
It was included training, retraining and assessment work plan, as a key action for the implementation and continuity of SPC. The evaluation should be done with a certain frequency (annual) to see if the work process is being followed.
The training also demonstrates the concern of senior management with the SPC.
Cultural Change Management Operators begin to accept and include the use of control charts in the daily routine work.
After three cycles of research, there was an improvement in the stability of the process, which reflected in energy gain (natural gas consumption). The SPC becomes therefore, a tool to collect facts and data with a focus on continuous improvement.
4.5. Practical results
After three cycles of action research, the following practical results were found:
a) Stability of the filtration process, reducing the final filtration pressure variability using X-bar and R charts, resulting reduction in gas consumption in 4% with recurring gains of approximately 150 thousand dollars per year.
b) Standardization of the corrective actions in the case of instability, with review of the operational procedure. c) Implementation of morning meetings with discussion of operating performance indicators, including the control chart.
d) Implementation of computer apparatus for viewing and monitoring real time process data in control chart. The tool allows instant visualization of tendencies in the chart. It was also included in the application, the record of the alert of out of control points (special causes) and any corrective actions to be typed by operators. The data were to be available for further exploration and analysis with the purpose of improvement or innovation in the process.
e) A framework for the implementation of the SPC chart in other processes.
4.6. A framework proposal for the implementation of SPC charts
As a result of the action research, it was proposed a framework (Figure 3) to guide the implementation of SPC charts. The framework presents the main CSF to be executed in four stages, planning, definition, implementation and consolidation; involving three actors, senior management, the SPC team and the facilitator. The colored boxes indicate more than one actor responsibilities. After the consolidation phase, the SPC should be incorporated into the dynamics of Continuous Improvement of the company, providing facts and data to identify improvement opportunities.
The factor “Project Launch with the Team”, which was not foreseen in the literature, was included as a CSF’s to highlight the importance of a formal launch and effective communication to all involved. The framework should be applied, mainly, to the first implementation of the control chart and as a guide to evaluate existing implementations to verify if the CSFs were considered, which could contribute to their support. The factor “Commitment and Responsibility of senior management”, despite appearing explicitly in the planning stage is a necessary factor throughout the conduct of the implementation.
Comparing this model with the CSFs raised in the literature, four of them do not appear in the framework: “Involvement and empowerment of employees,” which is incorporated in the factor “Management of cultural change”; “Feedback, continuous learning and knowledge sharing,” translated into the ability of interpreting control charts, executing appropriate actions and also practicing morning meetings; “Development of statistical thinking”, which is distributed in all stages of implementation and consolidation of the SPC chart and “Focus on customer satisfaction”, which is inserted in the correct identification of critical quality characteristic.
This framework and CSFs can be used by other companies because they deal with needs and general objectives and not specific to the chemical industry where the action research was conducted.
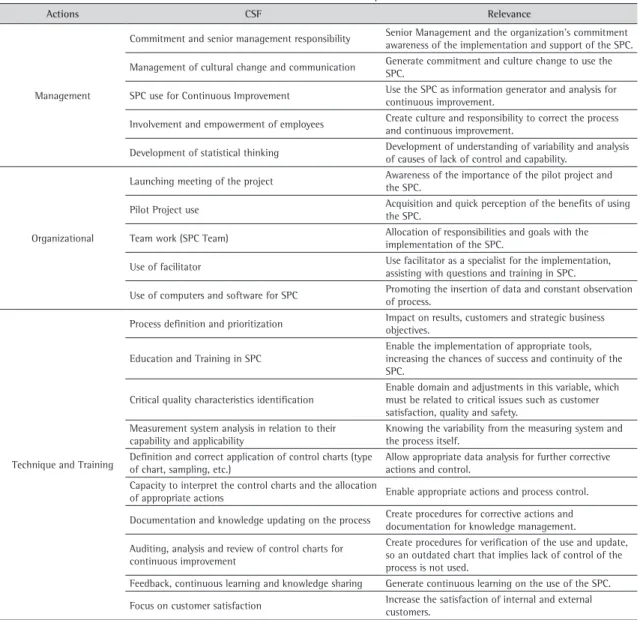
The CSFs for the implementation of the SPC can be related to three types of actions for implementation (Table 6): managerial actions, involving the support and establishment of appropriate infrastructure and culture,
Table 6. Actions and CSF for SPC implementation.
Actions CSF Relevance
Management
Commitment and senior management responsibility Senior Management and the organization’s commitment awareness of the implementation and support of the SPC.
Management of cultural change and communication Generate commitment and culture change to use the SPC.
SPC use for Continuous Improvement Use the SPC as information generator and analysis for continuous improvement.
Involvement and empowerment of employees Create culture and responsibility to correct the process and continuous improvement.
Development of statistical thinking Development of understanding of variability and analysis of causes of lack of control and capability.
Organizational
Launching meeting of the project Awareness of the importance of the pilot project and the SPC.
Pilot Project use Acquisition and quick perception of the benefits of using the SPC.
Team work (SPC Team) Allocation of responsibilities and goals with the implementation of the SPC.
Use of facilitator Use facilitator as a specialist for the implementation, assisting with questions and training in SPC.
Use of computers and software for SPC Promoting the insertion of data and constant observation of process.
Technique and Training
Process definition and prioritization Impact on results, customers and strategic business objectives.
Education and Training in SPC
Enable the implementation of appropriate tools, increasing the chances of success and continuity of the SPC.
Critical quality characteristics identification
Enable domain and adjustments in this variable, which must be related to critical issues such as customer satisfaction, quality and safety.
Measurement system analysis in relation to their capability and applicability
Knowing the variability from the measuring system and the process itself.
Definition and correct application of control charts (type of chart, sampling, etc.)
Allow appropriate data analysis for further corrective actions and control.
Capacity to interpret the control charts and the allocation
of appropriate actions Enable appropriate actions and process control.
Documentation and knowledge updating on the process Create procedures for corrective actions and documentation for knowledge management.
Auditing, analysis and review of control charts for continuous improvement
Create procedures for verification of the use and update, so an outdated chart that implies lack of control of the process is not used.
Feedback, continuous learning and knowledge sharing Generate continuous learning on the use of the SPC.
so that the implementation occurs and that the use of SPC can be sustained; organizational actions, involving the structuring of the project and the team to implementation activities; and technical actions and training, promoting the knowledge and dissemination of SPC tools, so that those involved feel safe for the implementation.
5. Conclusions
Through action research, it was implemented a control chart in a chemical plant. It was identified the need for the use of nineteen success factors (Table 2) considered critical, identified in the literature, for the effective implementation and sustained use of control charts. Each of the factors was tested in action research, isolated or combined, which helped in proposing a framework to guide the implementation and continued use.
An identified feature was the need for the chart to be physically next to the operator and displayed constantly. Regarding the use of computer monitors, if possible, it should be a unique monitor to the chart.
The framework, its steps and the recognition of its importance constitute a reference to guide control charts implementation in other chemical plants and other companies. The effort required for each factor in each step may differ depending on the history and site characteristics implementation.
The actions implemented during the research contributed to change the culture and behavior of the plant’s operators, to improve the studied object (silica process) and to deploy the initiative to other plants of the company. It was also possible to prove in practice the relevance of the success factors to support the technical traditional focus on SPC implementations.
References
Antony, J., & Taner, T. (2003). A conceptual framework for the effective implementation of statistical process control. Business Process Management Journal, 9(4), 473-489. http://dx.doi.org/10.1108/14637150310484526.
Antony, J., Balbontin, A., & Taner, T. (2000). Key ingredients for the effective implementation of statistical process control. International Journal of Productivity and Performance Management, 49(6), 242-247. http://dx.doi.org/10.1108/00438020010343417. Chen, S. H., Yang, C. C., Lin, W. T., & Yeh, T. M. (2008). Performance evaluation for introducing statistical process control to the liquid
crystal display industry. International Journal of Production Economics, 111(1), 80-92. http://dx.doi.org/10.1016/j.ijpe.2006.12.055. Chowdhury, J. (1986). Quality-Control moves upstream in CPI plants. Chemical Engineering (Albany, N.Y.), 93(8), 19-23.
Coughlan, P., & Coghlan, D. (2002). Action research for operations management. International Journal of Operations & Production Management, 22(2), 220-240. http://dx.doi.org/10.1108/01443570210417515.
Does, R. J. M. M., Trip, A., & Schippers, W. A. J. (1997). A framework for implementation of statistical process control. International Journal of Quality Science, 2(3), 181-198. http://dx.doi.org/10.1108/13598539710170821.
Elg, M., Olsson, J., & Dahlgaard, J. (2008). Implementing statistical process control: an organizational perspective. International Journal of Quality & Reliability Management, 25(6), 545-560. http://dx.doi.org/10.1108/02656710810881872.
Gallagher, W. M. (1990). SPC application in the chemical industry. In Proceedings of the IEE Colloquium on Applied Statistical Process Control, London.
Gordon, M. E., Philpot, J. W., Bounds, G. M., & Long, W. S. (1994). Factors associated with the success of the implementation of statistical process control. The Journal of High Technology Management Research, 5(1), 101-121. http://dx.doi.org/10.1016/1047-8310(94)90016-7.
Grigg, N., & Walls, L. (2007a). Developing statistical thinking for performance improvement in the food industry. International Journal of Quality & Reliability Management, 24(4), 347-369. http://dx.doi.org/10.1108/02656710710740536.
Grigg, N., & Walls, L. (2007b). The role of control charts in promoting organisational learning: New perspectives from a food industry study. The TQM Magazine, 19(1), 37-49. http://dx.doi.org/10.1108/09544780710720826.
Haslego, C. (2000). Apply statistical process control with intelligence. Chemical Engineering, 107(3), 86. Retrieved in 8 September 2016, from http://search.proquest.com/openview/72f090549d20ac47b48caaadb1e10a13/1?pq-origsite=gscholar&cbl=41910
Hradesky, J. L. (1989). Aperfeiçoamento da qualidade e da produtividade: guia prático para implementação do Controle Estatístico de Processo – CEP. São Paulo: McGraw-Hill.
International Organization for Standardization. (2015). ISO 9001: 2015: quality management systems: requirements. Geneva: ISO. Krumwiede, D., & Sheu, C. (1996). Implementing SPC in a small organization: a TQM approach. Integrated Manufacturing Systems,
7(1), 45-51. http://dx.doi.org/10.1108/09576069610108435.
Kumar, A., & Motwani, J. (1996). Doing it right the second time. Industrial Management & Data Systems, 96(6), 14-19. http://dx.doi. org/10.1108/02635579610126818.
Lim, S. A. H., & Antony, J. (2013). A conceptual readiness framework for statistical process control deployment. In Proceedings of the IEEE International Conference Industrial Engineering and Engineering Management (pp. 300-304), Bangkok, Thailand. http:// dx.doi.org/10.1109/ieem.2013.6962422.
Lim, S. A. H., & Antony, J. (2014). The implementation of statistical process control in the food industry: a systematic review. In Proceedings of the 2014 International Conference on Industrial Engineering and Operations Management (pp. 1682-1691), Bali, Indonesia. Lim, S. A. H., Antony, J., & Albliwi, S. (2014). Statistical Process Control in the food industry–A systematic review and future research
Lim, S. A. H., Antony, J., & Arshed, N. (2016). A Critical Assessment on SPC Implementation in the UK Food Industry. Systemics. Cybernetics and Informatics, 14(1), 37-42. Retrieved in 8 September 2016, from http://www.iiisci.org/journal/CV$/sci/pdfs/SA430BZ15.pdf Mahanti, R., & Evans, J. R. (2012). Critical success factors for implementing statistical process control in the software industry.
Benchmarking: An International Journal, 19(3), 374-394. http://dx.doi.org/10.1108/14635771211244309.
Mason, B., & Antony, J. (2000). Statistical process control: an essential ingredient for improving service and manufacturing quality. Managing Service Quality: An International Journal, 10(4), 233-238. http://dx.doi.org/10.1108/09604520010341618.
Montgomery, D. C. (2014). Introdução ao controle estatístico da qualidade (4th ed.). Rio de Janeiro: Gen-LTC.
Phyanthamilkumaran, S. Z., & Fernando, Y. (2008). The role of cultural change in the relationship between critical factors with the success of Statistical Process Control (SPC) projects. Proceedings of Annual London Conference on Money, Economy and Management, 3(4), 1-11.
Putri, T. N., & Yusof, S. R. M. (2008). Critical success factors for implementing quality engineering (QE) in Malaysian’s and Indonesian’s automotive industries: a proposed model. International Journal of Automotive Industry and Management, 2, 1-15. Retrieved in 8 September 2016, from http://kari.hyundai.com/karifile/IJAIM_reports/Vol2_No2/vol2_no2_01_Critical%20Success%20Factors%20 for%20Implementing%20Quality%20Engineering%20(QE)%20In%20Malaysian’s%20and%20Indonesian’s%20Automotive%20 Industries-A%20Proposed%20Model.pdf
Putri, N. T., & Yusof, S. M. (2009). Critical success factors for implementing quality engineering tools and techniques in malaysian’s and indonesian’s automotive industries: an exploratory study. In Proceedings of the International MultiConference of Engineers and Computer Scientists (pp. 18-20), Hong Kong, China.
Rantamäki, J., Tiainen, E. L., & Kässi, T. (2013). A case of implementing SPC in a pulp mill. International Journal of Lean Six Sigma, 4(3), 321-337. http://dx.doi.org/10.1108/IJLSS-05-2013-0029.
Rohani, J. M., Yusof, S. R. M., & Mohamad, I. (2009a). The relationship between statistical process control critical success factors and performance: a structural equation modeling approach. In Proceedings of the 2009 IEEE International Conference on Industrial Engineering and Engineering Management (pp. 1352-1356), Hong Kong, China. http://dx.doi.org/10.1109/ieem.2009.5373033. Rohani, J. M., Yusof, S. R. M., & Mohamad, I. (2009b). Statistical process control success factors and performance: an exploratory
analysis. In Proceedings of the Advances in Quality Engineering and Management Reserch, Malaysia. Retrieved in 8 September 2016, from http://eprints.uthm.edu.my/2571/
Rohani, J. M., Yusof, S. R. M., & Mohamad, I. (2010). The development of a survey instrument for measuring a relationship between statistical process control success factors and performance. Jurnal Mekanikal, 30, 1-16. Retrieved in 8 September 2016, from http:// s3.amazonaws.com/academia.edu.documents/41145791/The_development_of_a_survey_instrument_f20160114-15835-1ffuvz1.pd f?AWSAccessKeyId=AKIAJ56TQJRTWSMTNPEA&Expires=1472739132&Signature=MUN%2FuZmuKzRKEldEFgaA0YxvHgI%3D&re sponse-content-disposition=inline%3B%20filename%3DThe_development_of_a_survey_instrument_f.pdf
Rungasamy, S., Antony, J., & Ghosh, S. (2002). Critical success factors for SPC implementation in UK small and medium enterprises: some key findings from a survey. The TQM Magazine, 14(4), 217-224. http://dx.doi.org/10.1108/09544780210429825.
Rungtusanatham, M., Anderson, J. C., & Dooley, K. J. (1999). Towards measuring the “SPC implementation/practice” construct: some evidence of measurement quality. International Journal of Quality & Reliability Management, 16(4), 301-329. http://dx.doi. org/10.1108/02656719910239938.
Sharma, R., & Kharub, M. (2014). Attaining competitive positioning through SPC – an experimental investigation from SME. Measuring Business Excellence, 18(4), 86-103. http://dx.doi.org/10.1108/MBE-10-2013-0050.
Xie, M., & Goh, T. N. (1999). Statistical techniques for quality. The TQM Magazine, 11(4), 238-242. http://dx.doi.org/10.1108/09544789910272913.