Non-destructive ultrasonic tomography for concrete
pavement evaluation: signal processing and image
analysis of crucial parameters
Tomograia ultrassônica não destrutiva para avaliação
de pavimentos de concreto: processamento de sinal e
análise de imagem de parâmetros cruciais
Abstract
Resumo
In recent years, due to the destructive and unproductive character of pavement specimen extraction, pavement maintenance technology intensi-ied the use of non-destructive techniques for pavement evaluation which resulted in the development of several devices and evaluation methods. This paper describes the use of technology based on low frequency ultrasonic tomography for evaluation of concrete pavement parameters. The equipment was applied in three experimental sections with different concrete pavements built at the University of Sao Paulo campus. The ultrasonic signal processing is given. The results analysis enables the eficient and reliable identiication of thickness and reinforcement position within the concrete slab. Construction problems were evidenced in one of experimental sections with thickness deiciencies and reinforcement in a position below projected. Furthermore, the use of a novel concrete quality indicator was correlated with the presence of transverse cracks and alkali-silica reaction within the sections.
Keywords: concrete pavements, non-destructive evaluation, ultrasonic tomography, slab thickness, distresses.
Recentemente, devido ao caráter destrutivo e pouco produtivo de extrações de material de pavimentos em operação, a tecnologia de manu-tenção de pavimentos intensiicou a utilização de técnicas não destrutivas para avaliação de pavimentos o que resultou no desenvolvimento de vários equipamentos e métodos de avaliação. Este artigo descreve a aplicação de tecnologia baseada em tomograia ultrassônica de baixa frequência para avaliação de parâmetros em pavimentos de concreto. O equipamento foi aplicado em três seções experimentais com diferentes tipos de pavimentos de concreto construídas no campus da Universidade de São Paulo. O processamento de sinal é apresentado. A análise de resultados permite a identiicação eicaz e coniável da espessura da placa de concreto e da posição da armadura. Problemas construtivos foram evidenciados em uma das seções experimentais apresentando deiciências de espessura de placa e armadura posicionada abaixo da cota de projeto. Ademais, a utilização de um novo indicador de qualidade do concreto foi correlacionada com a presença de issuras transversais e reação álcali-agregado nas seções estudadas.
Palavras-chave: pavimentos de concreto, avaliação não destrutiva, tomograia ultrasônica, espessura de placa, defeitos.
a School of Engineering. Department of Transportation Engineering, University of São Paulo, São Paulo, SP, Brazil b Department of Transportation Engineering. University of Minnesota, Minneapolis, MN, United States of America
Received: 18 Apr 2017 • Accepted: 18 May 2017 • Available Online: 11 Dec 2017
L. S. SALLES a
J. T. BALBO a
L. KHAZANOVICH b
1. Introduction
Non-destructive evaluation methodologies are structural analysis techniques in which it is not necessary to physically examine the material. It is possible to observe various parameters within the material without actually having contact with its inside. The biggest advantage of this type of study is clearly the not harmful evalua-tion character. For pavements, one of the major problems found in layers analysis and characterization is the great heterogeneity of the material. A single location extraction may not be represen-tative of the whole structure. Additionally, specimen extraction or trenching the pavement may cause a higher or lesser degree of damage. The replacement of the removed material will certainly not present the same properties as the original layer. Furthermore, the extraction vicinities are known potential origins of distresses such as cracks and faulting because the stress coniguration in such points is not the same as the continuous structure. Adhesion problems between the recomposed material and the original layer aggravate this issue. In addition to the structural details, material forensic extraction is costly, laborious, unproductive and potentially not representative of the structure as a whole, again regarding the heterogeneity topic (Grote et al., 2005 [1]).
Currently, the combined use of destructive and non-destructive tech-niques has become the primary means of road structure evaluation. Firstly, a non-destructive device is applied in a comprehensive and rapid assessment of the pavement. After the data interpretation, lo-cations with distresses or where there is doubt on the device’s re -sults receive a more in-depth study with potential material extraction. As, commonly, pavement structures extend for several kilometers, the combination of methods seems to be the key point in the post-construction assessment (thickness check, presence and position-ing of steel bars, early-age distresses, etc.) and in the maintenance feasibility studies (distresses, the presence of water, voids, etc.). In addition to these tasks, unlike the destructive procedures, nonde -structive methods can be quality control tools during construction and not only instruments for assessing distress and/or maintenance and rehabilitation measures. Moreover, distress inspection without causing further damage or destruction of the layer can greatly assist maintenance decisions, such as whether or not to perform a partial or full repair (Hoegh et al. [2]).
The main goal of this paper is the use of nondestructive tomogra-phy technology to analyze very relevant aspects of pavement con-crete structures related to performance and deterioration. Direct comparison of thicknesses by cored samples and non-destructive testing are presented; locations presenting transverse cracks and alkali-silica reaction (ASR) were sought by tomography image re -construction and signal interpretation. The data processing of the ultrasonic tomography device (MIRA) procedure is also presented. The ultrasonic testing was performed in experimental concrete pavements located at the University of São Paulo main campus.
2. Modern non-destructive evaluation
methods for concrete pavements
Non-destructive methods, if properly performed and interpreted, can quickly evaluate a speciic point without damaging it. How -ever, one should be aware that all methodologies have simpliica
-tions which can lead to disastrous results. In this section, the most modern methods of non-destructive evaluation are discussed with emphasis on quality, laws and limitations.
2.1 Ground Penetrating Radar (GPR)
GRP can be equipped with sending and registering antennas with different frequency. By using high frequency antennas, the results appear in high resolution, though the depth ranges are low. Con-versely, low frequency antennas provide deeper penetration with the cost of a lower resolution. Most commercial GPR provide an -tennas with frequencies between 50 MHz and 1.5 GHz (Daniels [3]). The primary GPR evaluative function for pavements was to determine thickness of both asphaltic and concrete layers (Tomp -kins et al. [4]). The possibility of performing surveys with GPR equipment coupled to a vehicle allows this this type of evaluation to be very productive, making it almost continuous, with minimal trafic interruption (Olhoeft and Smith III [5])
GPR calibration is usually done with the use of a concrete speci-men comparing the travel time with the exact specispeci-men thickness (Hugenschmidt [6]). In the mentioned study, the observed error between the measured thickness of the concrete specimen and the thickness determined by GPR was between 50 and 150 mm; what the author regards as an acceptable error margin. It should be noted that other studies found major errors due to inaccurate estimates of the dielectric constant, which intensiies the need for a thorough study of this parameter (Grote et al., 2005 [1]). For bridges, a study was able to correctly measure the concrete cover of 77% of the cases inspected. The average difference between GRP results and the actual data was 10 mm. For concrete thick-ness, 95% of the measurements were successful (9 mm average error) (Hugenschimdt and Mastrangelo [7]).
However, despite the results discussed, several studies point out dificulties and laws in the GPR evaluation. A 2012 study reports that the GPR returns mostly accurate information but only for small thicknesses; according to the authors the extent to which the eval -uation deepens, the readings become less accurate. Furthermore, the visualization of non-uniform cracks is dificult (Hoegh et al. [2]). Others also point out issues in observation of voids and cracks with GPR (Haza et al. [8]). Moreover, when the moisture level is too high, the electromagnetic waves are absorbed rapidly losing potential. Consequently, it is practically impossible to investigate fresh concrete or in the early stages of curing (Maierhofer [9]). Due to concrete’s mitigation effect on the GPR waves, data regarding base and sub-base layers are lost, which does not occur in asphalt pavements. This indicates that if strong relections appear below the slab, the distress level or compromised area is quite alarming. Still, according to the same author, in some places, strong relec-tions have not resulted in areas with water, but clays or saturated bases without voids. This compromises the method, requiring de-structive veriication to certify the distress (Scullion, [10]).
2.2 Infrared tomography
visible and understandable, the technique of thermal-imaging is used to convert this pattern of thermal radiation to a visual image. To this end, an infrared camera is applied. Noteworthy advantages include no direct contact required with the object being analyzed, high productivity readings (rapid response), high resolution and portability (camera) (Clark et al. [11]).
However, infrared evaluations are dependent on several factors such as material temperature, atmospheric temperature and cli-mate conditions. According to the previously mentioned authors, the effects of sunlight more clearly highlight objects which increase their temperature, improving the results. However, sunlight may also affect the infrared techniques masking the real material tem -perature (Park et al. [12]). Another study, while highlighting the technique successful potential to ind delaminations in concrete, yields attention to the interference of climate conditions in the re-sults (Hoegh and Khazanovich, [13]). Furthermore, the tempera-ture inluence on the readings is much more concise on the ma-terial surface, thus deeper assessments are dificult to interpret (Hoegh et al. [2]).
Adding to the infrared tomography disadvantages, one must know that when it is desired to know the object’s temperature, the mea-surements are a combination of the object temperature and the temperature emitted by the object. Therefore materials that trans -mit more heat can inluence the temperature of adjacent materials.
2.3 Magnetic tomography
Magnetic tomography is an evaluation technique that uses pulse induction principles to ind metal parts within these objects. In the case of pavements, the Magnetic Imaging Tools (MIT Scan 2) is of-ten used to check the positioning of dowel and tie bars. The device emits a pulsing magnetic signal of low intensity and measures the
transient signal induced in the steel bars inside the concrete. These signals contain information on the electrical conductivity distribution and magnetic properties, which further allows for determining the position, size, shape, orientation and type of the metal body. Despite the device’s effectiveness in detecting metal elements in the structure (Prabhu et al. [14]), its use is limited to this type of material. For thickness estimation the placing of a metal plate is re-quired at the base top for each measuring point (Nasief et al. [15]). Also, a 2006 study observed points that showed disagreement with real data, with great bar misalignments that did not occur accord-ing to forensic investigation. This, accordaccord-ing to the authors, was due to the fact that the MIT Scan 2 readings are greatly inluenced by the presence of other metal materials uncalibrated in the experi-ment near the analysis site (Hossain and Elino [16]).
2.4 Ultrasonic tomography
Ultrasonic techniques apply high frequency waves (greater than 20,000 Hz) to characterize the properties of materials and detect-ing distresses. Sound waves, generated by transducers, travel through the material being studied and are then received by re-ceptors on the surface. Signal analysis allows discovering infor -mation about the means by which the signal has traveled. This technique has been used successfully for many years in medicine and evaluation of metallic and composite materials. In concrete materials, ultrasonic testing has been used for detection of inclu-sions, estimation of compressive strength and elastic modulus in concrete specimens (Perlin and Pinto [17]; Carnonari et al. [18]; Diogenes et al. [19]). However, most methods require the coupling of transducers and sensors in at least both sides of the specimen which is not applicable for pavement layers. Also, application of ultrasonic methods in typical pavement materials such as concrete
Figure 1
and asphalt has been problematic due to the need for a coupling liquid and the dificulty in reaching the required thickness, because of the different layers which causes wave attenuation (Hoegh et al. [20] 2011). These dificulties led to the use of rudimentary meth -ods such as chain dragging and impact echo. However, the former is much inluenced by the operator and the second only correctly evaluates lat and uniform structures and distresses being both slow and unproductive (Hoegh and Khazanovich, [13]).
To overcome these problems, dry contact point transducers with the ability to send shear waves of low frequency (55 kHz) allowing the effective penetration at greater depths were created. MIRA, one example of such device, has 45 pairs of transducers and re-ceivers. A survey takes less than 2 seconds and results in a 2D image area. The great amount of data is interesting so that there is a perfect image compilation, especially for very heterogeneous materials. Low frequency waves (typically 50 kHz) allow the signal to navigate through the concrete despite the material heteroge-neous characteristics. The signals are always relected when an acoustic discontinuity takes place, which is deined as the inter-face between a medium wherein the impedance of the following medium is different. The acoustic impedance is a material property and is the product of sound velocity and material density (Vancura et al. [21]). Figure 1 shows the device and compares its operating principle to the impact echo.
A high correlation between MIRA and specimens extracted in situ for concrete cover and slab thickness was observed (Hoegh et al. [10]). A combination of various studies certify the sensitivity of MIRA with a correlation index of 0.9968 between specimen thick-nesses and thickness measurements with MIRA (Vancura et al. [21]). Regarding distresses in comparison with other methods, ul-trasonic evaluation with MIRA showed the best correlation with the destructive forensic studies showing the distress location and its depth (Hoegh et al. [22]).
3. Processing of ultrasonic signals
Data obtained from MIRA were processed with the technique de-veloped by Hoegh et al. (Hoegh et al. [20]). Briely, ultrasonic time-history data provided by 10 transducers are processed using the synthetic aperture focusing technique (SAFT) that is based on the instantaneous amplitude of the readings. The information received by the transducer pairs (45 pairs) located at different spacing al-lows the reconstruction of the region of interest (ROI) relectivity creating an image (B-Scan) through equations 1 and 2:
(1)
(2)
Where,
,
i k
ô
= the image relectivity of each position inside the ROI;T = number of transducers positions;
e, r = index of the emitting and receiving transducers; V = shear wave velocity;
i, k = index of the ROI’s horizontal and vertical positions;
st = the response magnitude at the evaluated time for given trans-ducers;
A = apodization coeficient, which is related to the various incident angles of the signal
The shear wave velocity is determined through the pulse-time data by knowing the spacing between the transducers and the time of the direct pulse arrival. Equation 3 can be applied in redundant information provided by the 45 signal pairs.
(3)
Where V is the calculated shear wave velocity, i, j and k are the transducers 1 through 10, xis the distance between transducers i, j and k and t is the time of the direct arrival pulse for the time history related to transducers i, j and k.
When plotting all xi,j values and ti,j the linear trend line shows the actual shear wave velocity. The delay time can be removed from all points because it is a constant for all transducers. Figure 2 shows an example of this calculation. In this case the shear wave velocity is 2.739 m/ms.
As the survey amplitude with MIRA has limitations (each survey measures approximatively 360 mm), a technique of combination of several consecutive B-Scans into a single panoramic image (SAFT-Pan) was created (Hoegh and Khazanovich [23]).
Furthermore, the analysis of the 45 signs in each survey allows the determination of a concrete quality indicator. Researchers comparing sound concrete with slabs with freeze-thaw distresses developed the Hilbert Transform Indicator (HTI) that was able to characterize the quality of the ultrasonic signal (Freeseman et al [24]). The indicator calculation is provided by Equation 4:
(4)
where HT (t) is the signal envelope of the Hilbert transform that is analyzed for the irst 500 us of signal time (enough to capture the pulse of the irst arrival and to the signal to travel through the speci-men). The HTI was also successfully used to show alkali-silica reac-tion related distresses (Dwight et al. [25]). For the two studies cited above, HTI above 90 indicated the presence of some damage level.
Figure 2
4. Analysis of parameters in diferent
concrete pavement structures
The ultrasonic survey was performed in three experimental pave -ment sections located at the campus of the University of São Pau -lo. The experimental sections are: (I) a parking lot with jointed-plain concrete pavement (JPCP) with slab thickness of 150 and 250 mm, (II) a ultra-thin whitetopping (WTU) with a 100 mm thickness located at a bus stop and (III) a continuously reinforced concrete
pavement (CRCP) with a 240 mm thick slab located on an avenue. Constructive data and structural analysis on these three pave-ments can be found in Balbo and Severi [26], Balbo and Pereira [27] and Salles et al. [28], respectively.
4.1 Concrete slab thickness
In order to identify the division between two materials (two layers), the higher level relection captured by the ultrasound (higher signal amplitude) is considered. As the concrete slab and the base material
Figure 3
Thickness surveys reconstructions in concrete slabs with designed thickness of (a) 150 mm; (b) 250 mm;
(c) and (d) 100 mm; and (e) and (f) 240 mm
B
B
B
B
B
B
A
C
E
B
D
have different properties, it is expected that the shear wave veloc -ity in these mediums will be different. The simplic-ity of pavement structure geometry also helps in the identiication of such relections. Figure 3 shows some cases of B-Scans for thickness determination. In Figure 3, the delineation between slab and base is represented by a relection line differing from the B-scan remain. The most per-fect representation of the interface between slab and base would be a continuous line as shown by Figure 3b. However, several fac-tors such as calibration, concrete heterogeneity, micro cracks and slab-base adhesion can modify the signal shape and strength. The signal attenuation is clear in Figures 3c and 3d for the WTU. Note that the relection intensity (bar located on the right side of the B-Scans) has a maximum peak of 2 for the WTU, while for the JPCP the peak value is the standard 3. Relections on a smaller scale show more details of the B-SCAN. This scale increase is neces -sary to better visualize the interface line. It is assumed that due to the WTU slab being completely adhered to the base layer (as-phalt), the ultrasound signal suffers less attenuation than in other cases where the concrete slab is not bounded to the base. Most WTU B-scans show cases similar to Figure 3c, with only three cases having a greater interface relection as in Figure 3d. This may be an indication of adhesion loss in the latter case. MIRA was applied to identify adhesion loss between two asphalt layers with (Hoegh et al. [29]). In the case of Figure 3f (also with enlarged relectivity scale of 2), it is possible to visualize a higher level of noise above the interface. These attenuations can result from mi-nor distresses, segregation of coarse aggregates or problems in measurement calibration. However, for all cases it was possible to measure the highest value of the relection signal disclosing its depth. This value (located below each B-Scan) is considered the thickness of the each slab. Relections below the slab/base inter-face should not be considered because the device calibration only takes into account the irst layer (concrete) being of little use for the analysis of layers below it.
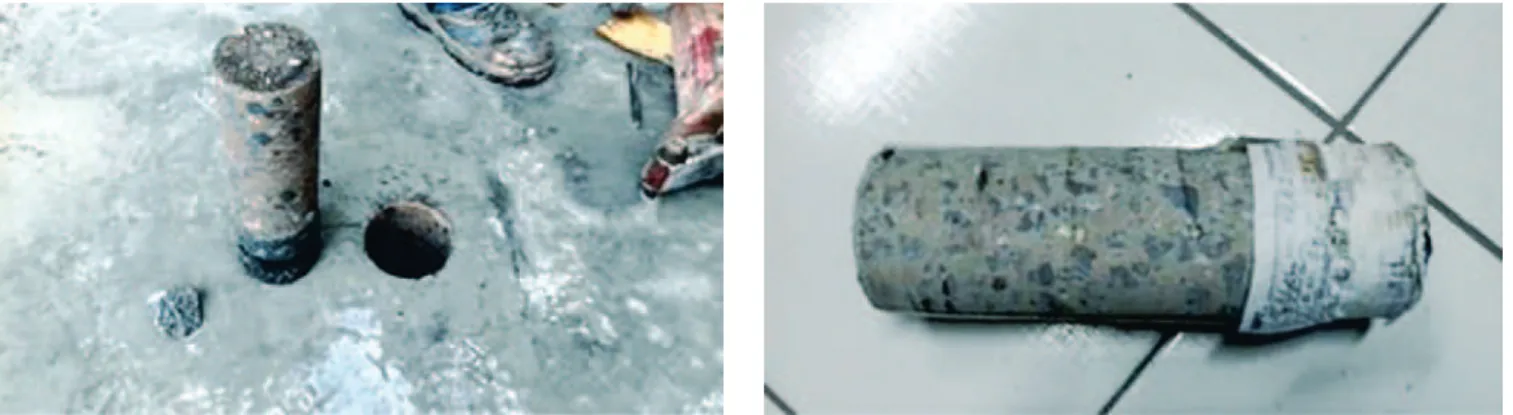
The WTU thickness is substantially equal to the designed thick -ness. However, for the JPCP and especially for the CRCP, major variations were found. The irst had a slab thickness about 15 mm thinner than the project. The CRCP presents a case (Figure 3e) slightly thicker than the project thickness and other well below it (Figure 3f). Specimens were removed in both positions (Figure 4) with a thickness of 240.6 for the irst case and 190.1 for the second
case. The forensic extractions conirm the method accuracy show-ing error variation around 5 mm, consistent with that found in the technical literature (Edwards [30]).
4.2 Reinforcement
Alterations in the acoustic impedance within the material are auto-matically recorded by the analytical process described above. As the bar’s geometry is commonly known, the reinforcement identi-ication is quite simple. Figure 5 shows B-Scans reconstructions of CRCP reinforcement. Typically, the signal amplitude on the in -terface between slab and base is greater than the reinforcement amplitude explaining the former greater level of relection. Inter -face relection breaks (Figure b) or weakening (Figures 5b and 5c) are also expected right below the reinforcement due to loss or at -tenuation of the ultrasonic signal in that region. This evaluation is important to verify important aspects of the structure as reinforce-ment existence, depth and spacing. For the CRCP, the investiga-tion found that in several cases the reinforcement was posiinvestiga-tioned below the steel depth indicated by the project, showing another constructive problem in this experimental section. The steel depth/ thickness ratio was designed at 0.42, however, thickness deicien -cies coupled with steel bars misplacement made the as built ratio to be 0.55.
4.3 Distresses
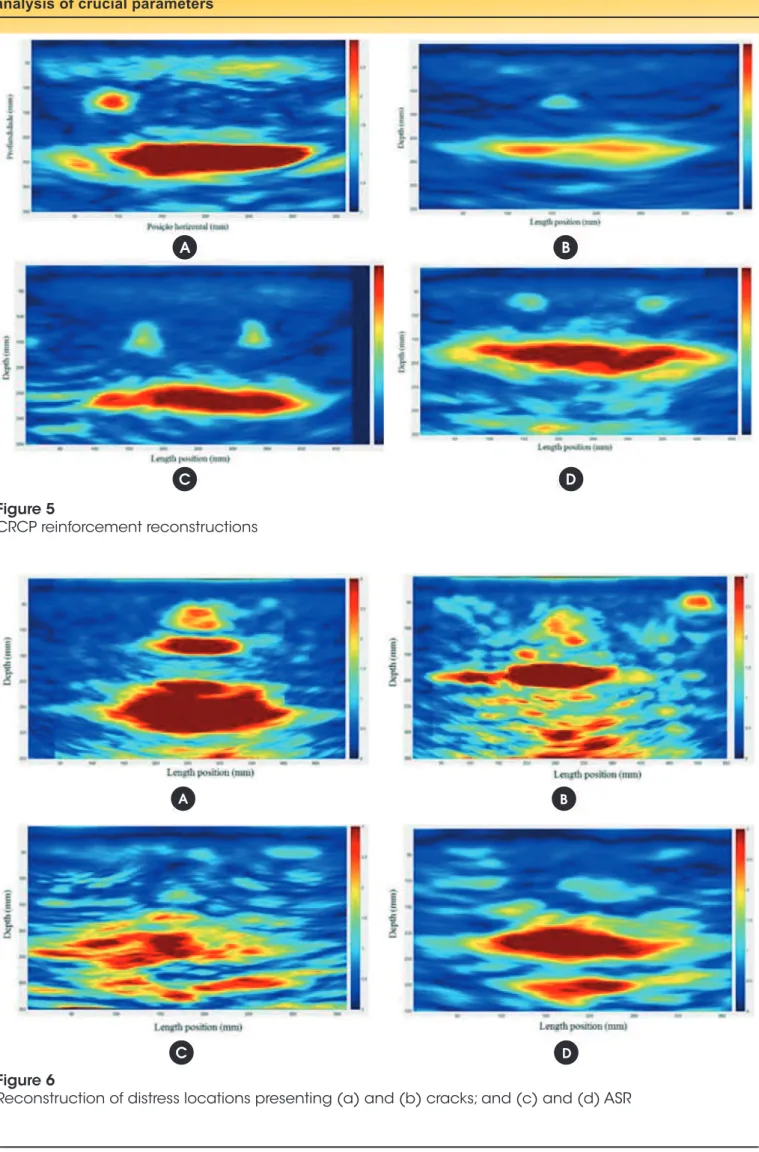
Aside from thickness and reinforcement reconstructions, most of the common concrete pavement distresses do not have a known geometry in both size and shape making the distress identiication more complex. Thus, two reconstruction features are the main fo -cus: unexpected relections above the slab/base interface (Figure 6a-d) and/or breakage at the same interface (Figure 6b and c). As evidenced with the reinforcement in the previous item, inclusions above the interface induce a loss of signal amplitude when the signal reaches the interface. In Figure 6, four cases of distress being two transverse cracks in the CRCP and two alkali-silica re-action (ASR) in the JPCP are presented. It is possible to observe a great difference between the reconstructions shown in Figure 6 and in Figures 3 and 5. Due to changes in the concrete homogene-ity (voids, delaminations and degradation of the cement paste), the
Figure 4
Figure 5
CRCP reinforcement reconstructions
B
B
B
B
A
C
B
D
Figure 6
Reconstruction of distress locations presenting (a) and (b) cracks; and (c) and (d) ASR
A
B
B
distresses reconstructions showed unexpected relections through the concrete. Again, relections below the interface are the result of the calibration material referent only to the irst layer. However, the distress presence in the concrete makes these relections more obvious in these cases.
4.4 Concrete quality indicator
Due to the unpredictable shape and depth of concrete pavement dis-tresses, some reconstructions are not as clear as the ones presented in Figure 6. In order to address this issue, an ultrasonic signal quality index, the Hilbert Transform Indicator (HTI), was created. Figure 7 presents two cases on the same slab with their respective ultrasonic signals. The irst case (Figure 7a) corresponds to a concrete with -out degradation where the ultrasonic signal has little amplitude varia -tion. In the other hand, in Figure 7b (location with surface indication of ASR), it is possible to observe several amplitude peaks indicating changes of material property (distress). The HTI values were 82 for the irst case and 112 for the latter. It is also interesting to note that the mere B-Scan reconstruction would not necessarily inform about the distress presence as few mid-slab relections show up in the second case, stressing the importance of a direct analysis of the ultrasonic
signal. Table 1 shows the HTI value for reconstructions presented in Figures 3, 5 and 6. Note that the cases presented in Figure 6 (dis -tresses) present HTI greater than 90 as expected. Values around 90 may be indicative of incipient distresses demonstrating the HTI ability to predict distresses not yet developed to the surface.
5. Final considerations
In order to fully investigate the potential of ultrasonic non-destruc-tive evaluation for concrete pavements, a series of surveys was carried out in three experimental sections located at the University of São Paulo campus.
The ultrasonic device and the signal analysis methodology allowed thickness veriication on three concrete slabs without causing any damage to the pavement. The forensic investigation (concrete specimens) at two locations proved the device’s accuracy. Further-more, considerations on the boundary condition of the ultra-thin whitetopping section were observed. Similarly, the methodology al-lowed the location of the longitudinal reinforcement in continuously reinforced concrete pavement (CRCP) section. For the CRCP, thickness below the designed one and misplaced reinforcement indicate serious construction problems.
Figure 7
Differences in signal amplitude for sound (a) and damaged (b) concrete
B
B
A
Table 1
Hilbert Transform Indicator (HTI) for the cases presented
Case Concrete
pavement HTI
3a JPCP 86
3b JPCP 80
3c UTW 71
3d UTW 93
3e CRCP 72
3f CRCP 57
5a CRCP 67
5b CRCP 61
5c CRCP 70
5d CRCP 79
6a CRCP 103
6b CRCP 105
6c JPCP 113
6d JPCP 105
Distresses like transverse cracks in the CRCP and alkali-silica reaction (ASR) in the jointed plain concrete pavement (JPCP) were observed thought unexpected mid-slab relections (material changes) in the ultrasonic images reconstructions performed on the distress. However, only the image reconstruction analysis was not enough to suggest distress presence. Therefore, the technique of direct analysis of the ultrasonic signals was able to numerically differ between damaged and undamaged locations showing prom -ise to predict distress before it reaches the slab surface.
6. Acknowledgements
The authors gratefully acknowledge the Coordenacão de Aperfe-icoamento de Pessoal de Nível Superior (CAPES – Brazil Ministry of Education) for the scholarship granted to the irst author through international program PDSE (Process - 99999.003858/2015-04).
7. References
[1] GROTE, K.; HUBBARD, S.; HARVEY, J.; RUBIN, Y. Evalu -ation of iniltr-ation in layered pavements using surface GPR relection techniques. Journal of Applied Geophysics, v. 57, 2005, p. 129 – 153.
[2] HOEGH, K.; KHAZANOVICH, L.; YU, T. Concrete Pavement Joint Diagnostics with Ultrasonic Tomography. Transporta-tion Research Record, v. 2305, 2012, p. 54 – 61.
[3] DANIELS, D. J. Surface-penetrating radar. ERA Technology, Institution of Electrical Engineers Radar Series no. 6, 1996, London.
[4] TOMPKINS, D. M.; KHAZANOVICH, L.; JOHNSON, D. Ben -eits of the Minnesota Road Research Project. Transporta -tion Research Record, v. 2087, 2008, p. 12 – 19.
[5] HUGENSCHMIDT, J. Concrete bridge inspection with a mo -bile GPR system. Construction and Building Materials, v. 16, 2002, p. 147 – 154.
[6] OLHOEFT, G. R.; SMITH III, S. S. Automatic Processing and Modeling of GPR data for Pavement Thickness and Prop -erties. Proceedings of the 8th International Conference on Ground Penetrating Radar, 2000, Gold Coast, Australia. [7] HUGENSCHMIDT, J.; MASTRANGELO, R. Concrete bridge
inspection with a mobile GPR system. Cement & Concrete Composites, v. 28, 2006, p. 384 – 392.
[8] HAZA, A. O.; PETERSEN, C. G.; SAMOKRUTOV, A. Three Dimensional Imaging of Concrete Structures Using Ultrason -ic Shear Waves. German Instruments SA, 2011, Denmark. [9] MAIERHOFER, C. Nondestructive Evaluation of Concrete
Infrastructure with Ground Penetrating Radar. Journal of Materials in Civil Engineering, v. 15, 2003, p. 287 – 297. [10] SCULLION, T. Using Rolling Delectometer and Ground
Penetrating Radar Technologies for Full Coverage Testing of Jointed Concrete Pavements. Report No FHWA-HIF-13-025, 2006, Federal Highway Administration.
[11] CLARK, M.R.; MCCANN, D. M.; FORDE, M. C. Application of infrared thermography to the non-destructive testing of concrete and masonry bridges. NDT & E International, v. 36, 2003, p. 265 – 275.
[12] PARK, J. H.; CHOI, M. Y.; KIM W. T. Infrared Thermogra -phy and Modeling to the Concrete Deck with Internal Defects as a Non-destructive Testing. Key Engineering Materials, v. 270-273, 2004, p. 938 – 943.
[14] PRABHU, M..; BUCH, N.; VARMA, A. H.; THANDAV-ESWARA, D. Experimental Investigation of Effects of Dowel Misalignment on Joint Opening Behavior in Rigid Pave-ments. Transportation Research Record, v. 1947, 2006, p. 15 – 27.
[13] HOEGH, K.; KHAZANOVICH, L. Correlation Analysis of 2D Tomographic Images for Flaw Detection in Pavements. ASTM Journal of Testing and Evaluation, v. 40, No, 2, 2012, p. 105 – 110.
[15] NASIEF, H. G.; WHITED, G. C.; LOH, W. Y. Wisconsin Method for Probing Portland Cement Concrete Pavement for Thickness Statistical Comparison and Validation. Trans-portation Research Record, v. 2228, 2011, p. 99 – 107. [16] HOSSAIN, S.; ELFINO, M. K. Field Demonstration of Magnetic
Tomography Technology for Determination of Dowel Bar Po -sition in Concrete Pavement. Report No FHWA/VTRC 06-R40, 2006, Federal Highway Administration.
[17] PERLIN, L. P.; PINTO, R. C. A. Ultrasonic Tomography in Concrete. Ibracon Structures and Materials Journal, v. 6, n. 2, 2013, p. 246-269.
[18] CARBONARI, B. T.; CAVALARO, S. H.; CASTANHA, J. C. M; GUACELLI, P. A. G; SILVA, C. C. Utilization of the ultra-sonic method to evaluate the properties of high performance concrete. Ibracon Structures and Materials Journal, v. 3, n.4, 2010, p. 494-511.
[20] HOEGH, K.; KHAZANOVICH, L.; YU, T. Ultrasonic Tomog -raphy for Evaluation of Concrete Pavements. Transportation Research Record, v. 2232, 2011, p. 85 – 94.
[21] VANCURA, M.; KHAZANOVICH, L.; BARNES, R. Concrete Pavement Thickness Variation Assessment with Cores and Nondestructive Testing Measurements. Transportation Re-search Record, v. 2347, 2013, p. 61 – 68.
[22] HOEGH, K.; KHAZANOVICH, L.; WOREL, B. J.; YU, T. De-tection of Subsurface Joint Deterioration Blind Test Com-parison of Ultrasound Array Technology with Conventional Nondestructive Methods. Transportation Research Record, v. 2367, 2013, p. 3 – 12.
[23] HOEGH, K.; KHAZANOVICH, L. Extended synthetic aper -ture focusing technique for ultrasonic imaging of concrete. NDT & E International, v. 74, 2015, p. 33 – 42.
[24] FREESEMAN, K.; HOEGH, K.; KHAZANOVICH, L. Charac-terization of Concrete at Various Freeze-Thaw Damage Con-ditions Using SH-Waves. Proceedings of the 42nd Review of Progress in Quantitative Nondestructive Evaluation (QNDE), 2015, Minneapolis.
[25] DWIGHT, C.; KHAZANOVICH, L.; SALLES, L. Linear Array Ultrasonic Test Results from Alkali-Silica Reaction (ASR) Specimens. Report No ORNL/TM-2016/159. Oak Ridge National Laboratory. Electrical and Electronics Systems Re -search Division, 2016, US Department of Energy, Washing -ton, D.C.
[26] BALBO, J. T.; SEVERI, A. A. Thermal gradients in concrete pavements in tropical environment. Experimental appraisal. Transportation Research Record, v. 1809, 2002, p. 12 – 22. [27] BALBO, J. T.; PEREIRA, D. S. Gradientes Térmicos em
Whitetopping Ultradelgado na Pista Experimental Instru-mentada da USP. [in portuguese]. Transportes, Rio de Ja -neiro, v. 9, n.1, 2001, p. 69-87.
[28] SALLES, L. S.; BALBO, J. T. Experimental continuously re -inforced concrete pavement parameterization using nonde -structive methods. Ibracon Structures and Materials Journal, v. 9, 2016, p. 263-274.
[29] HOEGH, K.; KHAZANOVICH, L.; MASER, K. TRAN, N. Evaluation of Ultrasonic Technique for Detecting Delamina-tion in Asphalt Pavements. TransportaDelamina-tion Research Record, v. 2306, 2012, p. 105 – 110.